Visual Flight Control in the Honeybee
Emily Baird
April 2007
A thesis submitted for the degree of Doctor of
Declaration
The following provides an account of my contribution to the studies presented in this
thesis.
Chapter 2: Richard Lamont assisted in the recording and data collection and wrote the software that was used to track bees and generate three-dimensional trajectories..
I designed and ran the experiments and performed all of the analyses. The
conclusions are my own.
Chapter 3: I designed the wind tunnel that was used in this study. An apparatus like this has not been described in the literature, so its development required research into
small wind tunnel design and extrapolation from fluid mechanics theory. I designed
and ran all of the experiments and performed all of the analyses, the conclusions are
my own.
Chapter 4: The hypothesis and the supporting mathematical model were developed by Prof. Srinivasan. The mathematical calculations that appear in this thesis were
developed from Prof. Srinivasan’s hypothesis but they were derived independently
and then tested against Prof. Srinivasan’s calculations to ensure that they were
correct.
I designed and ran all of the experiments and performed all of the analyses.
The conclusions were based on the predictions of the model and therefore, were
related to Prof. Srtinivasan’s original hypothesis although the discussion represents
my own interpretations. The observations and discussion regarding the implications
of the changes in the lateral component of flight are my own.
Chapter 5: The active gaze theory for ground height control is my own. I developed the theory that honeybees use optic flow cues generated by regular changes in lateral
position to control their ground height and to gain information about the spatial
layout of their environment from observations made throughout the course of my
Honours and PhD work.
Acknowledgements
To my supervisors...
To Shaowu, thank you for your endless support and encouragement
To Srini, thank you for introducing me to the wonderful world of the honeybee.
To my family...
To my mother and father whose encouragement, support and contribution to every aspect of this work have been immeasurable.
To Jess, for teaching me how to eat an elephant!
To the people at ANU...
Thanks to the people in the Centre for Visual Sciences, RSBS and ANU - many of whom provided invaluable assistance throughout the course of this study.
I would especially like to thank Richard Lamont, Cathy Stewart Moore, Mark Snowball and the Workshop boys for making the impossible, possible!
To Paul, thank you for your support and guidance and showing me how fascinating honeybees really are!
To Hong, for teaching me how to learn from the honeybee.
To my friends...
For my dear friend Dr Aung Si, thank you for making the world a better place.
Regan - none of this would have been as enjoyable without you next door. What else can I say except.. .that’s a Noogyin’!
Ich danke meinem freund und Kollege Norbert für seinen Enthusiasmus und sein unemessliches Wissen.
Riccardo, grazie per essere cosi buon amico.
Sharyn, le agradece por ser un buen amigo.
To the ever tolerant Mr Nicholas Brown and his rubber chicken, Rudigar.
Tack till min käre vän Birger - du är toppen!
Ä mon eher ami Antoine, merci de m'avoir motivee et inspiree ... et d'avoir reveille en la geek en moi!
And, finally...
Abstract
In a single foraging flight, a honeybee may navigate over large distances across open and often turbulent environments, avoid collisions in the cluttered spaces around bushes and trees and make repeated landings on flowers of different shapes, sizes and orientations. The studies described in this thesis investigate the mechanisms of visual ground speed and ground height control in both freely flying and landing honeybees. The findings of this thesis reveal details of the elegant and computationally efficient strategies that honeybees use in order to achieve these extraordinary feats of flight control.
Previous research has shown that honeybees regulate their ground speed by holding the rate of optic flow constant. The efficacy of this simple strategy is highlighted by some of the novel findings presented in this thesis which reveal that honeybees are able to maintain a constant forward speed in both outdoor and indoor flight tunnels, over short and long distances and in the presence of head and tail winds. Detailed analyses of flight trajectories reveal for the first time that honeybees are also able to sustain a constant forward speed despite modulations in the lateral and vertical components of flight.
Little is known about the mechanisms of ground height control in flying insects. The results of this thesis reveal for the first time that honeybees use lateral optic flow cues to regulate ground height. Based on the findings of this thesis, a novel theory of ground height regulation is proposed. The ‘active gaze’ theory of ground height control proposes that during flight honeybees actively change their lateral position in a consistent manner to extract ground height information from the lateral component of optic flow in the ventral visual field. It is hypothesised that the active gaze strategy of ground height control may also have a more general function that enables honeybees to gain information about the three-dimensional structure of their environment during forward flight.
The findings of this thesis reveal the details of the honeybee’s simple, yet elegant strategy for accomplishing smooth landings on a vertical surface. The strategy used for landing on vertical surfaces is an extrapolation of that used for landing on horizontal surfaces. It is hypothesised that the strategy that is described here for facilitating smooth landings on vertical surfaces represents a computationally simple method for ensuring that the speed of approach will be reduced to near zero when contact with a surface is made, regardless of its orientation
Table of Contents
Declaration... i
Acknowledgements... ii
Abstract... iii
Chapter 1 General Introduction... 1
Optic flow ... 1
Rotational optic flow...2
Translational optic flow...3
Ground speed control...6
Ground height control...7
Flight control during landing...9
Aims... 11
Chapter 2 Visual Flight Control in an Outdoor Setting... 12
Introduction... 12
Methods... 14
Experiment 1: Effect of changes in ventral visual texture on flight control...14
Experimental apparatus... 14
Training... 16
Experimental conditions... 16
Analysis o f flight trajectories...17
Statistical analysis... 18
Experiment 2: Head orientation during flight... 19
Experimental apparatus... 19
Analysis o f flight trajectories...19
Results... 20
Experiment 1: Effect of changes in ventral visual texture on flight control... 20
Is flight control different when honeybees are flying from the feeder to the hive than when they are flying from the hive to the feeder?...20
Effect o f changes in ventral visual texture on axial flight velocity...20
Effect o f changes in ventral visual texture on ground height...22
Obserx’ations o f the flight trajectories...22
Effect o f visual texture on the properties o f lateral oscillations...25
Experiment 2: Head orientation during flight...25
The role of ventral optic flow cues in the regulation of fligh t...28
Gaze orientation during lateral translation...30
Active gaze: a novel mechanism of visually mediated ground height control...32
Chapter 3 Visual Flight Control in W ind...33
Introduction...33
Methods...34
Training...34
Experimental Apparatus...36
Experimental conditions...37
Experiment 1: Effect of wind on flight control in the presence of lateral and axial optic flow cues...39
Experiment 2: Effect of wind on flight control in the absence of lateral optic flow cues...39
Experiment 3: Effect of wind on flight control in the absence of axial optic flow cues...40
Experiment 4: Effect of wind on flight control in the absence of optic flow cues...40
Effect o f optic flow on lateral oscillation...40
Image analysis...41
Data analysis...41
Statistical analysis...42
Results... 42
Experiment 1: Effect of wind on flight control in the presence of lateral and axial optic flow cues...43
Experiment 2: Effect of wind on flight control in the absence of axial optic flow cues...43
Experiment 3: Effect of wind on flight control in the absence of lateral optic flow cues...45
Experiment 4: Effect of wind on flight control in the absence of optic flow cues...45
Effect of optic flow on lateral oscillation...46
Discussion... 48
Effect of wind on ground speed control...49
Effect of wind on ground speed when axial optic flow cues are present...49
Effect of wind on ground speed when axial optic flow cues are absent...50
Effect of wind on ground height control...50
Effect of wind on ground height when lateral optic flow cues are present...51
Effect of wind on ground height when lateral optic flow cues are absent...52
What optic flow cues are honeybees using to control ground height in wind?...52
Effect of optic flow cues on lateral oscillation...54
Chapter 4 How Honeybees Land on Vertical Surfaces... 58
Introduction...58
Model for controlling forward speed when landing on a vertical surface... 61
What is the optic flow profile that is generated when a honeybee approaches a stationary disc? ... 63
What are the properties o f a spiral pattern which will generate the same optic flow profile whether it is stationary or rotating?... 64
What is the perceived angular velocity o f point R when a stationary' honeybee views the rotating spiral?... 66
What is the angular velocity’ at a viewing direction 0 o f point R when a honeybee approaches the rotating spiral pattern?...67
Methods... 68
Training...68
Experimental Apparatus... 70
Experiment 1: Effect of radial expansion on landing...70
Experiment 2: Effect of spatial frequency on landing...71
Recording o f honeybee flight trajectories... ...71
Data analysis...72
Statistical analysis...72
Results... 73
Experiment 1: Effect o f radial expansion on landing... 73
Experiment 2: Effect o f pattern texture on ground speed during landing...78
Observations o f the flight trajectories... 81
Discussion... 84
What is the rate o f radial expansion that the honeybees experience when approaching the spiral pattern?... 84
What is the effect o f reducing the rate o f radial expansion on ground speed during landing? ...86
What is the effect o f spatial frequency on ground speed control during landing?... 86
How do honeybees know when to land?...87
What effect do changes in lateral position have on the optic flow profile generated during landing?... 88
What is the consequence o f oscillating the lateral component o f flight during landing?...89
Conclusion...90
Chapter 5 General Discussion...91
Visual control of ground speed...91
Visual control of ground height...92
What cues do honeybees use to estimate their ground height?...92
Estimating ground height from the lateral component of optic flo w...94
Minimising rotational optic flow during lateral translation...96
Detecting changes in optic flow from changes in ground height... 97
Visual information processing of lateral optic flow generated by lateral translation...98
Functional role o f the ‘active gaze’ theory of ground height control...99
Role o f active gaze strategy for estimating the distance to surfaces...100
Visual control of landing... 101
A general theory of landing in the honeybee...101
Conclusion... 101
Chapter 1
General Introduction
The navigational achievements of the honeybee have for centuries fascinated
apiarists, researchers and casual observers alike. The interest in honeybee navigation
is due not only to their ability to fly up to ten kilometres to a food source and fly the
shortest route back, but also to their ability to communicate the location of the food
source to other foragers in the hive (for a review, see: von Frisch 1993). These
navigational feats are made possible by the honeybee’s ability to maintain stable
flight. To achieve this, honeybees must be able to control the principal forces of drag
and lift by regulating both their ground speed and their ground height in a reliable
way. Despite possessing a brain that contains less than one million neurons,
honeybees are able to process with extraordinary accuracy all of the complex sensory
information that is necessary for achieving stable flight. Honeybees overcome the
limitations of their small brain by employing a range of computationally simple
techniques to aid flight control and navigation. By studying the mechanisms of
ground speed and ground height control in the honeybee, it is possible to gain some
insight into how a small and relatively simple brain can achieve the high level of
sophistication that is necessary for stable flight and navigation.
Optic flow
For safe and reliable navigation, honeybees require information about their current
position, speed and orientation in space and information about the proximity of
surfaces in their environment. Investigations into honeybee navigation show that they
generated on their retina during flight (for a review see: Srinivasan and Zhang 2004).
This pattern of apparent motion is called optic flow. Properties of optic flow, such as
the direction and velocity of motion in the visual scene, provide useful cues for
detecting course deviations or the proximity of objects in the environment.
Honeybees are known to use optic flow information to stabilise flight, estimate the
range of objects, negotiate narrow gaps and estimate the distance flown to a food
source (Kirchner and Srinivasan 1989; Srinivasan et al 1991; Srinivasan et al 1996;
Srinivasan et al 2000a).
To be able to extract information from the pattern of optic flow honeybees and other
flying insects must have visual systems that are capable of detecting and measuring
motion in the visual scene. Based on the findings of a series of behavioural
experiments in flies, Reichardt (1969) proposed a mechanism of motion detection
that would enable insects to obtain information from the pattern of optic flow they
experience during flight. According to this model, the direction of motion of the
scene is extracted by computing the temporal correlation between the signals from
neighbouring photoreceptors when there is movement in the visual scene (Reichardt,
1969; Borst and Egelhaaf, 1989).
The validity of the Reichardt model as a representation of the neural underpinnings
of the system of motion detection in the insect visual system has been affirmed by
the accuracy with which it can be used to predict the strength of some motion-driven
behavioural responses. The Reichardt model, and modifications of it are also able to
account for the response properties of neurons mediating this behaviour in many
species of vertebrates and invertebrates (Egelhaaf and Borst, 1989; Egelhaaf et al.,
1989; Hausen, 1993; Krapp and Hengstenberg, 1996; Single et al, 1997).
Rotational optic flow
Flying insects must be able to detect and correct for rotations about the body axes to
changes in optic flow and performing compensatory gaze adjustments (review:
Reichardt 1969; Hengstenberg 1993; Srinivasan and Zhang 2004). This behaviour is
known as the optomotor response (Reichardt 1969). The compensatory movements
of the optomotor response operate as a reflex course correction and flight
stabilisation mechanism (Kaiser 1975). For example, if an insect is flying on a
straight path and a gust of wind generates an unintended yaw to the right, the eyes
would experience an image shift to the left. The resulting optomotor response would
allow the insect to stay on course by generating a compensatory yaw to the left. The
optic flow cues that are generated by rotations about the yaw, pitch or roll axes of the
insect, known as rotational optic flow cues, thus provide insects with important
information about changes in flight direction.
Translational optic flow
Rotational optic flow cues do not contain any information about the distance to
surfaces or the translational speed of the viewer with respect to these surfaces
(Koenderink 1986). Insects extract translational speed and range information from
the visual scene by relying on information generated from translational rather than
rotational changes in position. The pattern of optic flow generated during translation
radiates from a stationary point, known as the focus of expansion, which is centred in
the direction of motion (Gibson 1950). The apparent speed of a point on the image
increases with its angular distance from the centre of expansion which produces no
apparent image motion. This general pattern of translational optic flow is modified
depending on the distances between the viewer and surfaces in the environment. For
a constant speed and direction of translation, the angular velocity of a point in the
image will increase as the distance between the observer and the surface decreases,
i.e. surfaces that are closer generate higher image angular velocities than those that
are further away, a phenomenon known as motion parallax.
Information about the absolute distance to surfaces can be obtained from
c lO
surface varies with the distance at which it is being viewed (h) according to the
following relationship:
dO V
(,)
where V is the velocity of the eye with respect to the surface and 6 is the angle from
the vertical at which the surface is being viewed (e.g. Nakayama and Loomis 1974).
If an animal knows how far or how fast it has moved its eyes, it can compute the
distance to a surface from the angular velocity that the surface generates on the
retina. The first evidence that insects use motion parallax information to estimate the
distance to surfaces came from a series of experiments on locusts (Wallace 1959).
Prior to jumping across a gap, locusts make side to side translational movements of
their head. These head motions, known as ‘peering’ represent an active gaze strategy
that allows the insects to estimate the distance to objects by measuring the changes in
optic flow that are generated by these lateral translations in eye position (Wallace
1959; Collett 1978; Sobel 1990; Horridge 1986; Poteser and Krai 1995). Locusts and
mantids perform these peering movements when they are not in locomotion. This
makes the task of extracting information about the distance to objects a relatively
simple one, as the retinal velocities of the fixated object that are generated by the
lateral translations of the insect’s head can be directly translated into distance
information.
Is it possible for flying insects to estimate the distance to the ground by using an
active gaze strategy in flight? The optic flow pattern generated in flight is more
complicated as, unlike when the body is stationary, it comprises components of axial,
vertical and horizontal translation. As a result, the changes in angular velocity
produced by peering movements would need to be extracted from the overall pattern
of optic flow that is induced by three-dimensional translation. There is evidence that
insects such as wasps (Voss and Zeil 1998) and honeybees (Lehrer and Srinivasan
1994) use active gaze strategies to determine the distance to novel objects and to
is able to extract information about the spatial layout of the environment by utilising
intervals of stable translation resulting from the saccadic viewing strategy of the fly
(Schilstra and van Hateran 1998). Between saccades, the neuron provides
information about translatory self motion and thus, implicitly, about the spatial
relation of the animal to its surroundings (Boeddeker et al 2005; Kern et al 2005,
2006; van Hateran et al 2005; Karmeier et al 2006). However, it is not known
whether flying insects actively change the position of their eyes during free flight to
gain information about the distance to nearby surfaces.
Further evidence that flying insects exploit information contained within the pattern
of translational image motion during free flight is provided by studies of the
navigation behaviours of the honeybee. Due to their small inter-ocular separation,
honeybees are unable to use stereoscopic vision to measure the distances to surfaces
(Collett and Harkness 1982; Horridge 1986; Srinivasan 1993). Yet honeybees display
the remarkable ability to centre themselves when flying through narrow gaps.
Despite their lack of stereo vision, this ‘centring’ behaviour suggests that honeybees
are able to determine the distance to the edges of the gap. An investigation into this
remarkable behaviour, known as the ‘centring response’, revealed that honeybees
balance the rate of translational optic flow in each eye when flying through narrow
spaces (Kirchner and Srinivasan 1989). By balancing the rates of translational optic
flow in the two eyes, honeybees can automatically ensure that they are centred
between the surfaces of the gap without requiring any absolute distance information.
Other investigations have provided further evidence that honeybees determine the
relative distance of an object by the speed of the translational optic flow generated on
their retinas (Lehrer et al 1988; Srinivasan et al 1989, 1991; Srinivasan and Zhang
2000). The ability to infer range from image motion allows honeybees to avoid
collisions by centring themselves in narrow spaces and to detect and avoid obstacles
they may encounter whilst flying. This is illustrated by the tendency of honeybees to
avoid flying toward rapidly moving objects, a behaviour known as the movement
Ground speed control
Several investigations have revealed that translational optic flow cues are also
important for ground speed control in insects. David (1982) found that Drosophila,
flying in a wind tunnel with movable patterns on the walls, adjusted their ground
speed to keep the velocity of translational image motion on the eye constant.
Srinivasan et al (1996) found that honeybees flying through a tapered tunnel
decreased their ground speed as the tunnel narrowed and increased their ground
speed as it widened. Based on this result, Srinivasan et al concluded that the
honeybees were regulating their ground speed to keep the speed of the image of the
walls constant. This was tested directly in a further study by Baird et al (2005). The
results of this study show that, when flying in a tunnel with moveable patterns on the
walls, honeybees reduce their ground speed when the patterns are moved against the
direction of flight (generating an increase in apparent image motion) and increase
their ground speed when the patterns are moved in the direction of flight (generating
a decrease in apparent image motion). The change in ground speed observed in
response to the speed and direction of pattern motion on the walls of the tunnel was
consistent with the change that would be required if the honeybees were holding
constant the axial (front-to-back) component of translational optic flow. This study
confirmed the hypothesis of Srinivasan et al (1996) that honeybees regulate their
ground speed by holding the rate of translational optic flow constant.
What are the consequences of maintaining the axial component of translational optic
flow constant during flight? Because perceived image velocity is related to the
distance of the viewer from the substrate, ground speed is adjusted according to the
proximity of objects and surfaces in the environment. Although this strategy will not
achieve a constant ground speed - the ground speed will depend upon the distances
to objects and surfaces in the lateral fields of view - it will ensure that the ground
speed is automatically adjusted to suit the flight environment. For example, ground
speed would tend to be high when flying in an open field, where distances to surfaces
the environment. This mechanism of ground speed control represents a simple and
elegant strategy that automatically regulates flight in a safe and reliable way without
requiring any knowledge of ground speed or the absolute distance to surfaces in the
environment.
Ground height control
Is ground height regulation important for flying insects? Evidence that ground height
regulation is functionally relevant to honeybee behaviour comes from what is known
about the mechanisms that underlie the visually driven odometer. Recent studies
show that honeybees estimate the distance flown on the journey to a food source by
integrating the amount of optic flow that they have experienced during the journey
(Esch and Burns 1995, 1996; Srinivasan et al 1996, 1997, 2000a; Esch et al 2001; Si
et al 2003). The amount of optic flow that a honeybee experiences on the flight to a
food source depends on the distance to surfaces in the environment. The amount of
optic flow experienced during flight will increase as ground height decreases: flight
at a low ground height will experience more optic flow and thereby estimate a larger
distance than flight at a higher ground height (Srinivasan et al 2000a). A honeybee’s
estimate of the distance flown will therefore depend on the ground height at which it
flies. The reliability of the honeybee’s odometer, as demonstrated by the precision
with which naive honeybees are able to locate a food source based on the odometric
estimate of an experienced forager, thus depends upon their ability to estimate and
control their ground height. Indirect evidence from the honeybee’s visual odometer
therefore provides support for the functional role of ground height control in the
honeybee.
What cues do flying insects use to regulate their ground height? Previous studies
show that insects flying at different ground heights will fly at different ground speeds
(Drosophila: David 1982; Moths: Keunen and Baker 1982; Beetles: Fadamiro et al
1998). However, in each of these investigations, the flight paths of the insects were
dictated by an odour plume that regulated the height at which the insects flew. In
these studies, the insects were using odour cues to regulate ground height. These
However, in the often turbulent air conditions of the natural environment, odour cues
would be unreliable, especially for regulating ground height over large distances. It is
therefore unlikely that insects like the honeybee which can fly up to 10 km from the
hive in a single foraging trip rely on odour cues to regulate their ground height.
David (1979) provided the first evidence that optic flow cues may play a role in
ground height regulation in flying insects. In this study, the effect of optic flow on
the ground height of Drosophila was tested by moving patterns on the floor of a wind
tunnel. When the speed of image motion in the ventral visual field was increased by
moving the patterns against the direction of flight, the flies increased their ground
height. However, the flies also increased their ground height in response to a
decrease in the rate of optic flow the insects experienced in their ventral visual field
caused by moving the patterns on the floor of the tunnel in the direction of flight.
From these results, David concluded that the increase in ground height that was
observed in response to moving the floor patterns in either direction represented a
movement avoidance response. This study indicated that the ground height of
Drosophila is affected by changes in optic flow in the ventral visual field but it did
not reveal what cues the insects were using to control their changes in ground height.
A recent study by Baird et a\ (2006) provided the first direct evidence that optic flow
cues are important for ground height control in flying insects. The authors found that,
when the texture on the floor of a flight tunnel is a longitudinal stripe pattern,
honeybees fly lower than when the floor of the tunnel displays a chequerboard
pattern. The results of this study reveal that optic flow cues in the ventral visual field
play a role in ground height control in the honeybee. Although previous
investigations have provided an indication that flying insects use visual cues to
control ground height, little is known about how insects use these cues to obtain
information about their height above the ground.
Current knowledge about the relationship between visually guided ground speed and
ground height control in the honeybee is limited. Previous investigations into the
behavioural responses observed under these conditions relate to the behaviour of
honeybees flying over large distances in an outdoor environment. The mechanisms
of visually guided ground speed and ground height control is investigated in an
outdoor setting in Chapter 2. By investigating flight control over large distances in an
outdoor environment it is possible, for the first time, to gain some insight into how
the behaviours that have been observed in the laboratory environment translate to the
flight behaviour of the honeybee in a natural setting.
How would the mechanism of flight control employed by the honeybee respond to
wind? To maintain a constant rate of optic flow in the often turbulent air conditions
of the natural environment, it would be necessary for honeybees to compensate for
the effect of head and tail winds on ground speed. One method of maintaining a
constant rate of optic flow in strong head or tail winds would be to restore the
apparent angular velocity generated by the ground to its original value by decreasing
or increasing ground height. The relationship between ground speed and ground
height in wind has not been investigated experimentally. This investigation is carried
out in the study described in Chapter 3. This chapter investigates the effect of head
and tail winds on the visual regulation of ground speed and ground height of
honeybees flying under different conditions of optic flow. This investigation will aid
in the understanding of the relationship between the visual mechanisms of ground
speed and ground height control and how their response changes in the speed and
direction of air flow.
Flight control during landing
To achieve smooth and safe landings, flying insects must be able to regulate their
speed in such a way that it is near zero when they make contact with the surface. Few
studies have investigated the cues that insects use to control their ground speed when
landing. Research into the landing strategies of flying insects has focussed on the
cues used to initiate the final step of the landing response - the extension of the
insect’s legs. These studies show that flies rely on optic flow cues to determine when
to extend their legs in anticipation of contact with an object (Goodman 1960; Borst
deceleration of flies approaching a spherical target is dependent upon the ratio of
retinal velocity and retinal size of the target. While these studies show that flying
insects rely on optic flow cues to prepare for landing, they do not reveal how insects
regulate their ground speed as they approach a surface in order to produce a smooth
touchdown.
Control of ground speed and ground height are crucial to the ability of honeybees to
execute smooth landings. In an investigation into how honeybees make grazing
landings on horizontal surfaces Srinivasan et al (1996, 2000b) discovered that, as the
landing surface is approached, the forward speed and ground height of a honeybee
decreases steadily. This deceleration in ground speed is directly proportional to the
height of the honeybee above the surface. The authors concluded that honeybees
achieve a smooth landing by holding constant the image velocity of the surface. By
using image velocity to control flight during landing, ground speed and ground
height can be reduced to zero at touchdown without requiring any explicit knowledge
of the absolute or moment to moment distance from the surface. Ground height and
ground speed regulation through optic flow cues thus provide a simple, yet highly
effective technique for the execution of smooth landings on horizontal surfaces.
When a honeybee approaches a horizontal surface, the optic flow it experiences will
be dominated by axially-directed image motion. The strategy of holding axial optic
flow constant would only produce a smooth touchdown when the optic flow
generated by the surface contains image motion in the axial direction. It is not clear
what strategies honeybees use to land on surfaces of other orientations, such as
inclined or vertical surfaces, which would generate very different patterns of optic
flow. Surfaces that are vertically oriented would not necessarily generate any optic
flow in the axial direction. Chapter 4 develops a theoretical model of a flight control
strategy which regulates ground speed when landing on a vertical surface and test the
model predictions with empirical observations of honeybees landing on a vertical
surface under different optic flow conditions. This investigation will not only provide
insights into how visual information is used to orchestrate landing on a vertical
Aims
The control of ground speed and ground height are crucial aspects of stable flight and
navigation, yet very little is known or understood about the mechanisms that
honeybees use to achieve these behaviours. This thesis investigates the mechanisms
of visually guided flight control in the honeybee in free flight and landing. By
analysing free flight behaviour during cruising flight and landing in the honeybee,
the aim of this study is to discover the strategies that are used by a simple brain to
achieve these complex tasks.
The aim of Chapter 2 is to investigate the mechanisms of visually guided ground
speed and ground height control in an outdoor setting.
The aim of Chapter 3 is to investigate the relationship between ground speed and
ground height in wind.
The aim of Chapter 4 is to develop a theoretical model of a flight control strategy
which regulates ground speed when landing on a vertical surface and to test the
model predictions with empirical observations of honeybees landing on a vertical
surface.
Interest in the flight control strategies of insects has expanded rapidly in recent times
as engineers seek to develop computationally simple visual guidance systems for
applications in autonomous aerial vehicles. The elegant strategies described in this
thesis not only reveal how a simple brain can extract and apply information from the
visual scene to control flight. They also suggest novel, biologically-inspired ways,
Chapter 2
Visual Flight Control in an Outdoor Setting
Introduction
The ability to control ground speed is fundamental for reliable navigation in the
turbulent air conditions of the natural environment. To maintain a constant
groundspeed, it is necessary that a flying insect obtain information about its speed
relative to the ground. Honeybees regulate their ground speed during flight by
holding constant the axial (front-to-back) speed of the image of the environment
(Srinivasan et al 1996; Baird et al 2005). Because the apparent speed of the image of
the ground will vary with ground height, the ground speed of a honeybee will vary
with the height at which it flies. Very little is known about how honeybees obtain
ground height information. As a result, the relationship between the mechanisms of
ground speed and ground height control in the honeybee is not well understood.
How do honeybees acquire information about their ground height? A recent study by
Baird et al (2006) provided the first direct evidence that visual cues play an
important role in ground height control in the honeybee. In this study, the ground
speed and ground height of honeybees were recorded when the axial optic flow cues
(optic flow cues generated by axial translation) on the floor of an experimental tunnel
were either strong (chequerboard) or weak (longitudinal stripes). In both cases the
walls of the tunnel provided strong optic flow cues in the lateral visual field. The
their ground speed and their ground height even when strong optic flow cues are
present in the lateral visual field. The findings of Baird et al provide the first
experimental evidence that honeybees use optic flow cues to regulate their ground
height. However, these results do not reveal the nature of the information that
honeybees extract from optic flow cues in the ventral visual field and how they use
this information to regulate ground height.
What component of optic flow do honeybees use to control their ground height?
Based on a series of experiments using a bio-inspired robot, Franceschini et al (2007)
proposed that insects could regulate both their ground speed and their ground height
by measuring the axial optic flow in different regions of the visual field. According
to this hypothesis, insects could regulate their ground speed by measuring axial optic
flow cues in the lateral visual field and regulate ground height by measuring axial
optic flow cues in the ventral visual field. This theory has not, as yet, been
investigated experimentally with flying insects. Evidence against the hypothesis of
insect flight control proposed by Franceschini et al comes from experiments carried
out on honeybees. Baird et al (2006) show that changes in ventral optic flow cues
affect both the ground speed and the ground height at which honeybees fly. If
honeybees were using optic flow cues in the lateral visual field to regulate their
ground speed, then the absence of axial optic flow cues from the ventral visual field
in these experiments should not have resulted in a change in ground speed. These
results suggest that honeybees do not use different regions of the visual field to
independently regulate ground speed and ground height. To date, the mechanism by
which honeybees use optic flow to estimate and regulate their ground height remains
unclear.
Most of what is known about the mechanisms of honeybee flight control is derived
from experiments that were conducted in small, experimental tunnels positioned
inside a temperature controlled facility (Srinivasan et al 1996; Baird et al 2005,
2006). The experimental conditions under which the flight control behaviours have
been observed come from an environment that is quite unlike the natural foraging
environment of the honeybee. It is unclear how the behaviours that have been
honeybees use when foraging in the outdoors environment. With the development of
sophisticated analysis software and modern camera systems it is possible, for the first
time, to record in three dimensions, the flight trajectories of honeybees flying in an
outdoor experimental tunnel. It has therefore become possible to test whether the
behaviours that have been observed in an indoor environment relate to the more
variable outdoor environment.
The aim of this study is to investigate the role of ventral optic flow cues in ground
speed and ground height control of honeybees flying over large distances in an
outdoor environment. This was examined by changing the visual texture on the floor
of a large outdoor flight tunnel and observing the effect on the three-dimensional
flight trajectories of honeybees flying over a distance of nine metres. Observations of
the flight trajectories under these conditions indicate that honeybees may actively
induce regular changes in the lateral component of flight to obtain visual information
about their ground height. To test whether the observed behaviour could represent a
viable strategy for ground height estimation, the relationship between head position
and flight direction of honeybees flying in an indoor tunnel is examined.
Methods
Experiment 1: Effect of changes in ventral visual texture on flight control
Experimental apparatus
The experiment was carried out on a levelled section of bushland on the grounds of
the Australian National University. The experimental tunnel consisted of two 2.5 m
high, 27 m long wooden walls set 2.6 m apart (Figure 2.1). The tunnel was closed at
one end with a 2.5 m high, 2.6 m wide wooden panel. The construction of the tunnel
was such that all of the walls of the tunnel were suspended 20 cm above the surface
of the ground. The cloth that was used to occlude the natural ground texture in two of
the experimental conditions was suspended from the bottom of the tunnel walls. By
suspending the cloth from the bottom of the tunnel walls it was possible to secure it
in such a way that wrinkles (which might provide undesired optic flow cues) were
b a
entrance 2.6 m
feeder
A <— transverse d irection--- ►
axial velocity direction of axial optic flow
lateral 1 velocity 1 direction N 1 of lateral • ' 1 optic flow
1 \
instantaneous velocity (flight direction)
[image:23.511.16.500.47.569.2]blank
Figure 2.1 Illustration of the outdoor tunnel and visual textures
(a) Illustration of the geometry of the outdoor tunnel and the axes of flight. (b) Illustration of the direction of flight and optic flow as viewed from above
A small beehive was placed on the outer side of the end wall of the tunnel.
Honeybees were able to enter the tunnel by means of a plastic tube that ran from the
hive through a hole in the end wall which was set 60 cm above the floor of the
tunnel. The end wall of the tunnel was painted white which provided a high-contrast
background against which honeybees could be identified and digitally tracked (see
below). The long walls of the tunnel were painted black in order to limit the visual
cues in the lateral visual field of honeybees flying along the tunnel. The top of the
tunnel was covered with mesh to prevent unwanted honeybees from entering the
tunnel.
Training
Honeybees were trained to fly from the tube in the end wall of the tunnel to a feeder
placed in the centre of the tunnel at a distance of 15 m from the end wall. The feeder
was placed on a small tripod and set at a height of 60 cm from the floor of the tunnel
(to match the height of the entrance hole). The cloth and the stripe textures that were
used in the experiment were put in place for at least one day before recording
commenced.
Experimental conditions
Flights of honeybees were recorded under three experimental conditions (illustrated
in Figure 2.1): ground, stripe and blank. In the ‘ground’ condition, the natural texture
of the ground was visible on the floor of the tunnel, providing the honeybees with
strong, natural optic flow cues in the ventral visual field. In the ‘stripe’ condition, the
ground between the hive and the feeder was covered with a dark cloth which had a
white stripe 60 cm in diameter running along its length, parallel to the walls of the
tunnel. In this condition, axial optic flow cues (optic flow cues generated by axial
translation) were minimised, whilst lateral optic flow cues (optic flow cues generated
ground, stripe and blank are used to define the different visual textures used in this
experiment.
It is important to note that it would have been instructive to include in this
experiment a visual condition where the cloth had white stripes oriented transverse to
the longitudinal axis of the tunnel. A transverse stripe pattern would provide axial
optic flow cues but no lateral optic flow cues to a honeybee flying along the tunnel.
A pattern such as this would have provided a condition with which to compare the
effects of removing the lateral component of optic flow with the effects of removing
the axial component of optic flow (the longitudinal stripe condition). It was not
feasible to include this condition in the present study due to the complexity of laying
the stripes on the cloth while it was suspended from the walls of the tunnel. A
transverse stripe condition was included in the experiments described in Chapter 4,
making redundant the inclusion of such a condition in this study.
Analysis o f flight trajectories
Flights between the hive and the feeder were recorded using a stereo camera system
that consisted of two synchronised CCD cameras (Pulnix TM-9701s), each equipped
with 200 mm lenses. Data from the cameras was captured directly and
simultaneously into a computer via a capture card (Euresys Domino Alpha) at a rate
of 30 frames per second. The cameras were each positioned at a distance of 50 m
from the end wall of the tunnel such that the field of view of each camera converged
at a point that was 17 m from the end wall (2 m from the position of the feeder).
With this camera arrangement it was possible to reconstruct the real world three-
dimensional flight trajectories of honeybees flying over a distance of 15 m between
the feeder and the entrance hole. This was done by tracking the position of the
honeybees in each camera view and obtaining the pixel coordinates. The system of
three-dimensional reconstruction was calibrated and tested by tracking the position
of objects in the tunnel that had a known start position and trajectory. The system
reliably tracked honeybees from a distance of 50 metres with a calculated positional
accuracy of 100 mm in the axial direction, 3 mm in the vertical direction and 3 mm
vertical and lateral axes, respectively. Segments of flights within 3 m of the hive and
the feeder were excluded from the analysis in order to leave out any flight
manoeuvres that might be related to landing behaviour.
Fourier transform analyses were performed on the lateral velocity values obtained
from each individual flight using Matlab (The Mathworks Inc). Observations of the
individual power spectra for each flight indicated that, in almost all flights, the lateral
oscillations of the honeybees contained a single, dominant frequency. The dominant
frequency for each flight was obtained by finding the frequency value with the
highest power. These values were then averaged across flights to obtain the mean
frequency value for each pattern condition.
The maximum lateral velocity or amplitude of each oscillation within individual
flights was identified by locating the values of lateral velocity where the preceding
and succeeding values were smaller, indicating a maximum. It was necessary to use a
Gaussian filter to remove the noise (caused by tracking inaccuracies) from the lateral
velocity data before performing this analysis in order to be able to accurately identify
the maximum velocity for each lateral oscillation. The mean of all the maximum
lateral velocity values were then calculated for each flight.
Statistical analysis
It was not possible to identify individual honeybees in the recordings due to the
limited resolution of the cameras and the large distances involved in this experiment.
It is therefore possible that the flight data includes several flights from the same
honeybee. All of the statistical analyses were conducted on the presumption that the
effects of using repeated flights from the same honeybee did not influence the
variation observed in each experimental condition. Detailed analyses from previous
experiments (Baird et al 2005, 2006 and the study presented in Chapter 4 of this
thesis) have indicated that the variation between flights from the same individual
one way analyses of variance (ANOVA) and Student’s t-tests were appropriate for
all of the analyses. All values presented in the results are given as the mean ±
standard deviation.
Experiment 2: Head orientation during flight
Experimental apparatus
The experiments were carried out in an indoor facility at the Australian National
University. The experimental tunnel was made of clear Perspex (length: 350 cm;
cross-section: 20 cm x 20 cm). Random dot patterns (dot size: 2.5 cm in diameter)
were placed on the walls and floor of the tunnel providing strong visual cues in the
lateral and ventral visual fields of honeybees flying in the tunnel. The tunnel and the
camera that was used to record the flights were covered with a white cloth to allow a
clear view of the honeybees’ orientation and position whilst recording by minimising
reflections from the Perspex roof. This had the effect of minimising optic flow cues
in the dorsal region of the visual field by occluding the structures on the roof of the
facility.
Analysis of flight trajectories
Honeybees flying to the feeder were recorded over a distance of 20 cm at 400 frames
per second using a CMOS camera (Motion Pro 10000 Redlake, Inc.) mounted 180
cm above the central section of the tunnel. The camera was fitted with a macro lens
(Nikon 90 mm) that allowed the head and body position of the honeybees flying in
the tunnel to be identified. The yaw orientation of the head and body of the
honeybees within each flight was determined manually using a program developed in
Matlab (The MathWorks, Inc.). The camera system was calibrated by using reference
Results
Experiment 1: Effect of changes in ventral visual texture on flight control
Is flight control different when honeybees are flying from the feeder to the hive than when they are flying from the hive to the feeder?
Table 2.1 shows the values for ground speed and ground height for flights from the
feeder to the hive and from the hive to the feeder as well as the total value obtained
when these results are pooled together for each condition. This data indicates that,
within each condition, ground speed and ground height are the same for flights both
to and from the feeder. In light o f this result, all o f the flights from each condition
were pooled together for the following analyses.
T a b l e 2 . 11’h e g r o u n d s p e e d a n d g r o u n d h e i g h t o f l i g h t s in e a c h e x p e r i m e n t a l c o n d i t i o n
G r o u n d s p e e d ( c m . s 1)
m e a n ± s d
G r o u n d h e ig h t ( c m )
m e a n ± sd
C o n d it io n F e e d e r to h iv e H iv e to f e e d e r d if f e r e n c eT e s t fo r p o o le dT o ta l F e e d e r to h iv e H iv e to f e e d e r d if f e r e n c eT e s t fo r p o o le dT o ta l
G ro u n d 3 7 0 ± 7 8 n = 3 3
3 6 7 ± 7 8 n = 11
t43 = 0.1 3 p = 0 .8 9 5
3 6 2 ± 7 1 n = 4 4
11 9 ± 17 n = 3 3
115 ± 16 n = 11
t43 = 0 .6 p = 0 .5 6 8
1 1 9 ± 15 n = 4 4
S trip e 3 1 8 ± 4 5 n = 41
3 3 6 ± 4 4 n = 16
t57 = 1 .3 p = 0 .1 8 9
3 2 3 ± 4 5 n = 57
113 ± 19 n = 41
113 ± 2 5 n = 16
tj7 = 0.1 p = 0 .9 1 7
113 ± 2 0 n = 5 7
B lank 3 0 2 ± 4 8 n = 9 2
3 0 4 ± 4 8 n = 2 8
ti i9 = 0 .2 p = 0 .8 2 8
3 0 2 ± 4 8 n = 120
127 ± 15 n = 9 2
1 2 4 ± 2 7 n = 2 8
1119 = 0 .4 p = 0 .7 1 7
127 ± 2 1 n = 120
Effect o f changes in ventral visual texture on axial flight velocity
The dependence between axial ground speed (i.e. speed in the direction aligned with
the tunnel’s longitudinal axis) and ventral visual texture is shown in Figure 2.2a.
Ground speed is greatest in the ground condition but, in comparison, is significantly
reduced in the stripe (foo = 3.2, p = 0.0018) and blank (ti62 = 5.2, p <0.0001)
conditions. Ground speed is also significantly lower in the blank condition in
[image:28.511.39.447.328.504.2]a
b
O 40
n = 58
n = 45 n = 120
[image:29.511.12.502.31.590.2]ground
Figure 2.2 Effect of ventral visual texture on ground speed and ground height (a) Effect of ventral visual texture on ground speed (axial velocity). (b) Effect of ventral visual texture on ground height
Effect o f changes in ventral visual texture on ground height
The relationship between ground height and ventral visual texture is shown in Figure
2.2b. The mean ground height at which honeybees fly is lowest in the ground
condition but is not significantly different from the mean ground height in the stripe
condition (tioo = 1-52, p = 0.1350). Honeybees fly at a significantly higher ground
height in the blank condition than in both the ground (ti62 = 2.53, p = 0.0140) and the
stripe (ti76 = 4.01, p = 0.0001) conditions. These results indicate that the ground
height of honeybees is affected when the optic flow cues on the floor of the tunnel
are removed but is unaffected when lateral optic flow cues are present.
Observations o f the flight trajectories
Figure 2.3 shows examples of flight trajectories from each experimental condition,
which illustrate some very interesting observations. In almost all flights, the
relationship between axial position and time is linear, indicating that ground speed
along this axis, i.e. axial velocity, is kept constant (Figure 2.3: a(i), b(i) and c(i)). The
lateral position of the honeybees oscillated from side to side with relative constancy
(Figure 2.3: a(ii), b(ii) and c(ii)). The regularity with which the position along this
axis oscillates becomes clear when the velocity of these lateral translations is plotted
against time (Figure 2.3: aiii, biii and ciii). A Fourier analysis (Figure 2.3: a(iv), b(iv)
and c(iv)) reveals that the changes in lateral velocity contain a single dominant
frequency component. The regular, near sinusoidal fluctuations in lateral velocity
were observed in most flights across all of the experimental conditions. The ground
height, i.e. vertical position, of the honeybees is not always held constant but, unlike
the changes in lateral translation, the deviations did not oscillate in a regular pattern
(Figure 2.3: a(i), b(v) and c(v)). The relationship between vertical velocity and time
contains some small oscillations but they are not as consistent as those observed
along the lateral axis and they are not present in all flights (Figure 2.3: a(vi), b(vi)
a(i)
■g 500
I
1
< 0
a(ii)
ground b(i) stripe c(i) cloth
Time (s)
b(ii) Time (s) c(ii) Time (s)
c(iii)
200 400 600 800
Axial position (cm)
1.5 0 1.5 0
Time (s) Time (s)
Time (s)
x 10
F ig u r e 2.3 Examples of flight trajectories from each of the three experimental conditions
(a) ground condition, (b) stripe condition and (c) blank condition
[image:31.511.8.499.26.713.2]a
n = 120 n = 58
n = 45
ground
b
n = 58
n = 45 n = 120
E 120
> 80
to 20
[image:32.511.12.502.34.610.2]ground
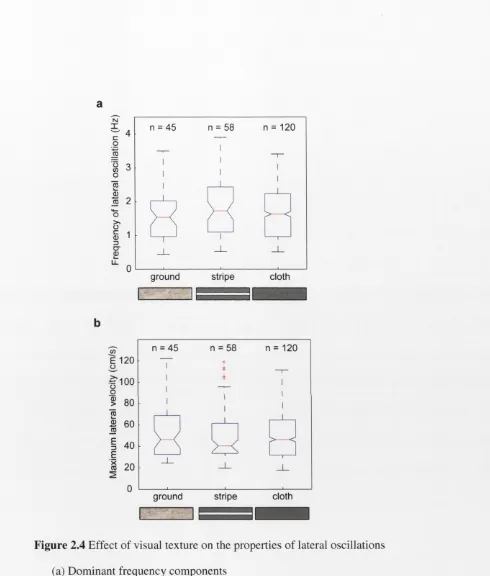
Figure 2.4 Effect of visual texture on the properties of lateral oscillations (a) Dominant frequency components
(b) Mean maximum lateral velocity (amplitude of lateral oscillations)
Effect o f visual texture on the properties o f lateral oscillations
To test whether the changes in lateral velocity that were observed in each flight
occurred at a constant frequency (i.e. contained a dominant frequency component),
as the data from individual flights suggested, a Fourier analysis was used. The results
of this analysis are shown in Figure 2.4a. Interestingly, there is no effect of visual
texture on the dominant frequency component of lateral oscillations (F2 = 1.86, p = 0.1567). The frequency of lateral oscillation is 1.65 Hz in the ground condition, 1.71
Hz in the stripe condition and 1.64 Hz in the blank condition. In contrast, no
dominant frequency components were evident in either the axial or the vertical
components of flight. The results of an analysis on the mean maximum lateral
velocity values in each condition are shown in Figure 2.4b. This data indicates that
the maximum lateral velocity is not affected by changes in visual texture (F2 = 0.37, p = 0.6900). The mean maximum lateral velocity is 57 ± 36 cm.s’1 in the ground
condition, 53 ± 29 cm.s’1 in the stripe condition and 54 ± 27 cm.s'1 in the cloth
condition. This data indicates that the maximum lateral velocity is not affected by
changes in visual texture. This result further supports the findings of the frequency
analysis by showing that neither the frequency, nor the maximum velocity
components of the lateral oscillations were affected by changes in the visual texture.
The results from these analyses suggest that the oscillations that were observed in the
lateral component of flight were occurring in a systematic, near sinusoidal way,
regardless of the changes in texture in the ventral visual field.
Experiment 2: Head orientation during flight
Based on the analysis of the flight trajectories in the previous experiment, it is
hypothesised that honeybees actively change the lateral component of flight to obtain
ground height information from the lateral optic flow cues that are generated in the
ventral visual field. To test the validity of this hypothesis, it is necessary to
investigate whether the visual field remains oriented in the axial direction of flight
are described in detail in the discussion). This can be achieved by examining the
orientation of the head (and hence the eyes) with respect to the changes in flight
direction (the instantaneous of forward motion) and the axial direction of flight (the
mean direction of flight). It is not possible to gain this information from the
recordings made in the first experiment due to the limited resolution of the cameras
and the large distances over which the flights were filmed. To overcome this, we
conducted a second experiment in which flights were recorded at high resolution,
permitting an analysis of the honeybees’ head orientation during changes in flight
direction.
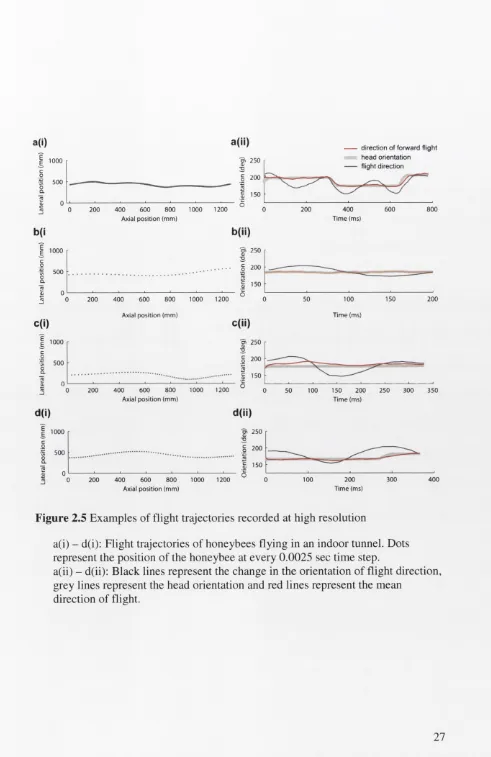
Figure 2.5: a(i)-d(i) shows example trajectories of flights in the small, indoor tunnel.
Interestingly, when flying in the small tunnel, honeybees performed lateral
translations that were similar to those observed in the outdoor tunnel, although the
frequency of oscillations in lateral velocity occurred at a higher rate (~ 4 - 5 Hz).
Figure 2.5: a(ii)-d(ii) shows a comparison between the head orientation and flight
direction for each of the trajectories shown in Figure 2.5: ai-di. An analysis of head
orientation during changes in flight direction reveals that, for a significant proportion
(70 ± 19 % ) of the total duration of each recording, the head does not follow the
changes in flight direction but instead remains oriented in the axial direction of
flight. In all but two out of the 20 flights that were analysed in this experiment, the
angle of head orientation changed during the flight. When these changes in head
orientation, or saccades were made, they were performed rapidly: the head is held at
a constant orientation for 86 ± 9 % of the duration of the flight. The results from this
experiment indicate that honeybees stabilise their heads against changes in the
direction of flight that are induced by lateral translations. Because the gaze direction
of the honeybees is held constant against the changes in flight direction, the lateral
translations that the honeybees perform during flight would serve to generate lateral
a(i)
I
s b(i c(i) 1000 500 1000 500 d(i) 1000 500 1000 500a(ii) direction of forward flight
200 400 600 800
Axial position (mm)
1000 1200
200 400 600 800
Axial position (mm)
1000 1200
b(ii)
O) 250
3 § 200 (O I 150 O
c(ii)
100 Time (ms)
150 200
200 400 600 800
Axial position (mm)
1000 1200
d(ii)
o> 250 a>
3
.2 200 ■■ (5
I 150
6
100 200
Time (ms)
[image:35.511.9.500.21.778.2]300 400
Figure 2.5 Examples of flight trajectories recorded at high resolution
a(i) - d(i): Flight trajectories of honeybees flying in an indoor tunnel. Dots represent the position of the honeybee at every 0.0025 sec time step.
a(ii) - d(ii): Black lines represent the change in the orientation of flight direction, grey lines represent the head orientation and red lines represent the mean