COMMISSION OF THE EUROPEAN COMMUNITIES
Brussels, 12.12.2003 SEC (2003) 1425
COMMISSION STAFF WORKING PAPER
"DRAFT JOINT INCLUSION REPORT"
Statistical Annex
COMMISSION STAFF WORKING PAPER
Statistical Annex to the Draft Joint Inclusion Report
The Common Indicators of Poverty and Social Exclusion: background, definitions,
methodological notes ... 3
The common indicators of poverty and social exclusion: statistical tables ... 10
Table 1: At-risk-of-poverty rate by broad age group and gender1, selected years (%)... 10
Table 2: At-risk-of-poverty rate for individuals aged 16 years and over by age group and gender1, 2001 (%) ... 11
Table 3: Persistent risk of poverty by broad age group and gender1, 2001 (%)... 11
Table 4: Relative median at-risk-of-poverty gap by age group and gender1, 2001 (%) ... 11
Table 5: At-risk-of-poverty threshold (illustrative values in PPS1), 2001 ... 12
Table 6: Income quintile ratio (S80/S20), selected years (%)... 12
Table 7: Gini coefficient, selected years (%) ... 12
Table 8: Dispersion around the at-risk-of-poverty threshold1, 2001 (%)... 12
Table 9: At-risk-of-poverty rate by household type,1 2001 (%) ... 13
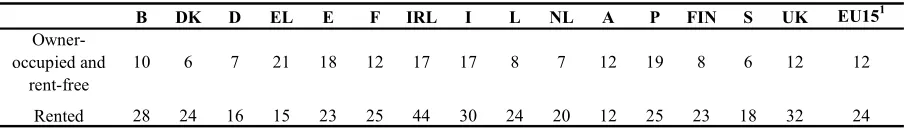
Table 10: At-risk-of-poverty rate by accommodation tenure status, 2001 (%) ... 14
Table 11: At-risk-of-poverty rate anchored at one moment in time (1998), 1998-2001 ... 14
Table 12: At-risk-of-poverty rate after and before social cash transfers, by broad age group and gender1, 2001 (%)... 15
Table 13: At-risk-of-poverty rate by gender1 and most frequent activity status, 2001 (%) ... 15
Table 13bis: Distribution of the adult population (aged 16 years and over) at risk of poverty by gender1 and most frequent activity status, 2001 (%) ... 16
Table 14: In- work poverty risk by main characteristics of the employed population... 17
Table 15: Dispersion of regional employment rates1, selected years (%)... 18
Table 16: People living in jobless households: children and working-age women and men, selected years (%) ... 18
Table 17: Long-term unemployment rate by gender, selected years (%) ... 19
Table 18: Long-term unemployment share by gender, selected years (%) ... 20
Table 19: Very long-term unemployment rate by gender, selected years (%)... 21
Table 20: Early school leavers not in education or training, by gender, selected years (%) ... 22
Table 21: Persons with low educational attainment by age and gender, 2003 (%)... 23
Table 22: Life expectancy at birth by gender, 1990 and 2000 (%) ... 23
Table 23: Self defined health status by income quintile1, 2000 (%) ... 23
Context information: population ... 24
THE COMMON INDICATORS OF POVERTY AND SOCIAL EXCLUSION: BACKGROUND, DEFINITIONS, METHODOLOGICAL NOTES
Background
In December 2001, the Laeken European Council endorsed a first set of 18 indicators of social exclusion and poverty, organised in a two-level structure of primary indicators – consisting of 10 lead indicators covering the broad fields that have been considered the most important elements in leading to social exclusion – and 8 secondary indicators – intended to support the lead indicators and describe other dimensions of the problem.
After that date, the Indicators Sub-Group has continued working with a view to refining and consolidating the original list of indicators. The list of common indicators as approved by the Social Protection Committee in July 2003, together with their definition, is included in the table below. Those indicators that have been re-defined can be identified thanks to the * sign that has been added in the first column. Similarly, new indicators can be identified thanks to the mention "new" that has been added in this column.
Breakdowns of the common indicators by age and gender
As far as possible, children must be given a special focus within the common indicators of social exclusion and poverty. In particular, it is recognised that it is especially important not to base the examination of child poverty and social exclusion on one single at-risk-of-poverty indicator. It is therefore recommended to apply a standard breakdown by broad age groups to all the Laeken indicators, wherever relevant and meaningful. In deciding the degree of disaggregation by age, considerations of statistical robustness must also be taken into account. Similarly, a gender breakdown must be applied to all the indicators, always wherever relevant and meaningful. It should be noted that, in the case of income-based indicators, the gender breakdown is based on the assumption of equal sharing of resources within households. Furthermore, in most instances a gender breakdown is only meaningful when applied to the adult population, as there cannot be any normative interpretation of gender differences in, for example, the poverty risk rate for children.
Definitions: the primary indicators
Indicator Definition Age
breakdown
Gender breakdown
Data source 1a At-risk-of
poverty rate
Share of persons with an equivalised disposable income below 60% the national equivalised median income.
Equivalised median income is defined as the household's total disposable income divided by its "equivalent size", to take account of the size and composition of the household, and is attributed to each household member.
Yes.
Age groups: 0-15; 16 and over; 16-24; 25-49; 50-64; 65+. Yes (applying to people aged 16 years and over).
ECHP
1b Incidence of poverty risk by most frequent activity status
Share of individuals in each activity status group who are at risk of poverty.
The most frequent activity status is defined as the status that individuals declare to have occupied for more than half the number of months in the calendar year. The status categories are: employment (broken down by wage and salary employment and self-employment); unemployment; retirement; other inactivity.
Yes Yes ECHP
1c Incidence of poverty risk by household type
Share of individuals in each household type who are at risk of poverty.
Households with no dependent children: - Single person, under 30 years old - Single person, 30-64 years - Single person, 65 years and over - Single women
- Single men
- Two adults, at least one person 65 years and over
- Two adults, both under 65 years - Other households
Households with dependent children: - Single parent, 1 or more dependent
children
- Two adults, one dependent child - Two adults, two dependent children - Two adults, three or more dependent
children
- Three or more adults with dependent children
Dependent children are individuals aged 0 – 15 years and 16 – 24 years if inactive and living with at least one parent.
Already specified in the typology of households. Already specified in the typology of households. ECHP
1d Incidence (and distribution) of poverty risk by accommodati on tenure status
Share of individuals in each
accommodation tenure status who are at risk of poverty (distribution: share of the population at risk of poverty by
accommodation tenure status). Accommodation tenure categories: - Owner-occupied or rent free - Rented
Yes Yes
(applying to people aged 16 years and over).
Indicator Definition Age breakdown Gender breakdown Data source 1e
At-risk-of-poverty rate threshold (illustrative values)
The value of the at-risk-of-poverty
threshold (60% median national equivalised income) in PPS, Euro and national currency for two illustrative household types:
- Single person household
- Household with 2 adults, two children
No No ECHP
2. Income quintile ratio (S80/S20)
Ratio of total income received by the 20% of the country's population with the highest income (top quintile) to that received by the 20% of the country's population with the lowest income (lowest quintile).
Income must be understood as equivalised disposable income.
Yes Yes
(applying to people aged 16 years and over).
ECHP
3. Persistent at-risk-of poverty rate
Share of persons with an equivalised disposable income below the at-risk-of-poverty threshold in the current year and in at least two of the preceding three years.
Yes Yes
(applying to people aged 16 years and over).
ECHP
4. Relative median poverty risk gap
Difference between the median equivalised income of persons below the at-risk-of poverty threshold and the threshold itself, expressed as a percentage of the at-risk-of poverty threshold.
Yes Yes
(applying to people aged 16 years and over).
ECHP
5. Regional cohesion
Coefficient of variation of employment rates at NUTS (Nomenclature of Territorial Units for Statistics) level 2.
No Yes EU-LFS
6. Long term unemployme nt rate
Total long-term unemployed population (≥12 months; ILO definition) as a
proportion of total active population aged 15 to 64 years.
Yes Yes EU-LFS
7a* Population living in jobless households: children
Proportion of children (aged 0-17 years) living in jobless households, expressed as a share of all children.
No No EU-LFS
7b* Population living in jobless households: working-age adults
Proportion of all people aged 18-59 years who live in a jobless household as a proportion of all people in the same age group. Students aged 18-24 years who live in households composed solely of students are not counted in either numerator nor denominator.
No Yes EU-LFS
8. Early school leavers not in education or training
Share of persons aged 18 to 24 who have only lower secondary education (their highest level of education or training attained is ISCED 97 0, 1 or 2) and have not received education or training in the four weeks preceding the survey. ISCED 97 is the 1997 International Standard Classification of Education.
Indicator Definition Age breakdown Gender breakdown Data source 9. Life
expectancy at birth
Number of years a person may be expected to live, starting at age 0.
No Yes Eurostat
Demogr aphy Statistic s1 10. Self-defined
health status by income level.
Proportion of the population aged 16 years and over in the bottom and top quintile of the equivalised income distribution who classify themselves as in a bad or very bad state of health.
Yes Yes ECHP
Definitions: the Secondary Indicators
Indicator Definition Age
breakdown
Gender breakdown
Data source 11. Dispersion
around the at-risk-of-poverty threshold
Share of persons with an equivalised disposable income below 40%, 50% and 70% of the national equivalised median income.
Yes Yes
(applying to people aged 16 years and over). ECHP
12. At-risk-of-poverty rate anchored at a moment in time
In year t, share of persons with an
equivalised disposable income below the at-risk-of-poverty threshold in year t-3, uprated by inflation over the three years.
Yes Yes ECHP
13. At-risk-of-poverty rate before social cash
transfers
Relative at-risk-of-poverty rate where equivalised income is calculated as follows: - excluding all social cash transfers
- including retirement and survivors pensions and excluding all other social cash transfers.
- including all social cash transfers (= indicator 1)
The same at-risk-of-poverty threshold is used for the three statistics, and is set at 60% of the national median equivalised disposable income (after social cash transfers).
Yes Yes ECHP
14. Gini coefficient
Summary measure of the cumulative share of equivalised income accounted for by the cumulative percentages of the number of individuals.
Its value ranges from 0% (complete equality) to 100% (complete inequality).
Yes Yes ECHP
Indicator Definition Age breakdown Gender breakdown Data source 15. Persistence
of at-risk-of-poverty (50% of median equivalised income)
Share of persons with an equivalised disposable income below 50% of the national median equivalised income in the current year and in at least two of the preceding three years.
Yes Yes ECHP
16.
new
Incidence of in-work poverty risk
Individuals who are classified as employed (either in wage and salary employment or self-employment) according to the definition of most frequent activity status (indicator 1b) and who are at risk of poverty.
This indicator needs to be analysed according to personal, job and household characteristics.
Yes Yes ECHP
17. Long-term unemployme nt share
Total long-term unemployed population (≥12 months; ILO definition) as a proportion of the total unemployed population.
Yes Yes EU-LFS
18. Very long term
unemployme nt rate
Total very long-term unemployed
population (≥24 months; ILO definition) as a proportion of total active population aged 15 to 64 years.
Yes Yes EU-LFS
19. Persons with low
educational attainment
Share of the adult population (aged 25 years and over) whose highest level of education or training is ISCED 0, 1 or 2.
Yes. Age groups: 25-34; 35-44; 45-54; 55-64; 65 years and over.
Yes EU-LFS
European income data: methodology and limitations
The income-based indicators that are presented in this report are calculated on the basis of data from the European Community Household Panel (ECHP). The use of the ECHP as the common source for such indicators was proposed by the Social Protection Committee and formally adopted at the Laeken European Council in 2001.
The ECHP is the only common source of comparable data on income and living conditions currently available for EU Member States. It was developed in association with Member States and publication of results incorporates a comprehensive validation process by both the National Statistical Institues and Eurostat. Given the sensitivity of the topics covered by this survey, some care is needed when interpreting results.
Characteristics of the survey
longitudinal structure of the ECHP makes it possible to follow up and interview the same households and individuals over eight consecutive years.
The first wave of the ECHP was conducted in 1994 in the then twelve EU Member States, on a total sample of some 60,500 households. Austria joined the project in 1995 and Finland in 1996. Even though Sweden is not taking part in the ECHP, comparable micro-data from the Swedish Survey on Living Conditions are included in the ECHP user's database from 1997 onwards. In the United Kingdom, Luxembourg and Germany, the ECHP survey was stopped in 1997 and data from an existing national panel survey (i.e. BHPS, PSELL and SOEP respectively) were harmonised to the ECHP format to provide data for all subsequent waves. Since the release of December 2002, ECHP UDBs differ from previous versions in some aspects: in addition to the updating of income data by some countries, two methodological aspects have been substantially revised:
– an improved weighting procedure is applied in order to avoid extreme weights; – a new method to adjust for 'within-household non-response' is used.
The impact of these two substantial modifications in the production of the ECHP UDB is twofold. Firstly, the micro-data contain now less extreme weights and better income information. Second, the current changes in methodology are accompanied by sometimes large changes in the estimates of some important indicators based on the ECHP. This newly adopted methodology can be regarded as a major revision and an improvement in the accuracy of ECHP estimates.
Income measurement
Data on income from the ECHP relate to the year immediately preceding the survey (e.g. 2000 for wave 8 conducted in 2001), whereas the household composition and the socio-demographic characteristics of household members are those registered at the moment of the survey.
Household's total disposable income is taken to be total net monetary income received by the household and its members, including all income from work (wages and salaries and self-employment earnings), private income from investment and property, plus all social cash transfers received including old-age pensions, net of any taxes and social contributions paid (with France and Finland representing a partial exception to this latter rule).
In order to reflect differences in household size and composition, the income figures are given per equivalent adult. This means that the total household income is divided by its equivalent size using the so-called modified OECD equivalence scale. This scale gives a weight of 1.0 to the first adult, 0.5 to any other household member aged 14 and over and 0.3 to each child below age 14. The resulting figure is attributed to each member of the household, whether adult or children. The equivalent size of a household that consists of 2 adults and 2 children below the age of 14 is therefore: 1.0+0.5+(2*0.3) = 2.1.
Limitations
sources, raises some concerns of data quality. This is particularly the case for those at the two extremes of the income distribution.
ECHP income data do not capture several major determinants of living standards, namely: receipts in kind, transfers paid to other households, loan interest payments and imputed rent for owner-occupied accommodation. The last component in particular can have a significant impact for certain countries or certain groups of the population within countries (i.e., the elderly).
THE COMMON INDICATORS OF POVERTY AND SOCIAL EXCLUSION: STATISTICAL TABLES
[image:10.595.72.536.163.589.2]NB: the full set of indicators and their breakdowns are available for download from the Eurostat New Cronos website, Theme 3, Domain ILC.
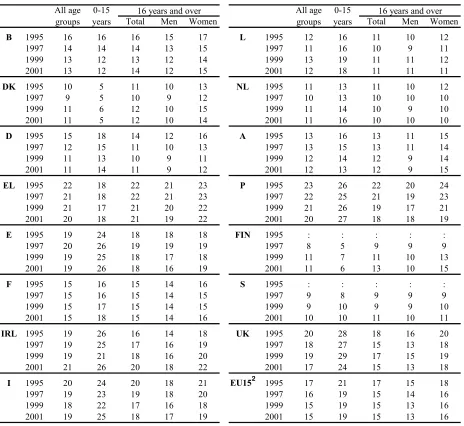
Table 1: At-risk-of-poverty rate by broad age group and gender1, selected years (%)
16 years and over 16 years and over
Total Men Women Total Men Women
B 1995 16 16 16 15 17 L 1995 12 16 11 10 12
1997 14 14 14 13 15 1997 11 16 10 9 11
1999 13 12 13 12 14 1999 13 19 11 11 12
2001 13 12 14 12 15 2001 12 18 11 11 11
DK 1995 10 5 11 10 13 NL 1995 11 13 11 10 12
1997 9 5 10 9 12 1997 10 13 10 10 10
1999 11 6 12 10 15 1999 11 14 10 9 10
2001 11 5 12 10 14 2001 11 16 10 10 10
D 1995 15 18 14 12 16 A 1995 13 16 13 11 15
1997 12 15 11 10 13 1997 13 15 13 11 14
1999 11 13 10 9 11 1999 12 14 12 9 14
2001 11 14 11 9 12 2001 12 13 12 9 15
EL 1995 22 18 22 21 23 P 1995 23 26 22 20 24
1997 21 18 22 21 23 1997 22 25 21 19 23
1999 21 17 21 20 22 1999 21 26 19 17 21
2001 20 18 21 19 22 2001 20 27 18 18 19
E 1995 19 24 18 18 18 FIN 1995 : : : : :
1997 20 26 19 19 19 1997 8 5 9 9 9
1999 19 25 18 17 18 1999 11 7 11 10 13
2001 19 26 18 16 19 2001 11 6 13 10 15
F 1995 15 16 15 14 16 S 1995 : : : : :
1997 15 16 15 14 15 1997 9 8 9 9 9
1999 15 17 15 14 15 1999 9 10 9 9 10
2001 15 18 15 14 16 2001 10 10 11 10 11
IRL 1995 19 26 16 14 18 UK 1995 20 28 18 16 20
1997 19 25 17 16 19 1997 18 27 15 13 18
1999 19 21 18 16 20 1999 19 29 17 15 19
2001 21 26 20 18 22 2001 17 24 15 13 18
I 1995 20 24 20 18 21 EU152 1995 17 21 17 15 18
1997 19 23 19 18 20 1997 16 19 15 14 16
1999 18 22 17 16 18 1999 15 19 15 13 16
2001 19 25 18 17 19 2001 15 19 15 13 16
All age groups
0-15 years
All age groups
0-15 years
Notes:
Table 2: At-risk-of-poverty rate for individuals aged 16 years and over by age group and gender1, 2001 (%)
Total 16-24 years 25-49 years 50-64 years 65 years and over
Total Men Women Total Men Women Total Men Women Total Men Women Total Men Women
B 14 12 15 12 11 12 10 8 11 12 10 13 26 24 26
DK 12 10 14 20 16 25 7 7 6 5 4 5 29 25 33
D 11 9 12 16 17 15 9 7 11 10 10 9 12 9 14
EL 21 19 22 19 18 21 14 14 15 21 19 22 33 30 35
E 18 16 19 20 19 21 15 14 16 17 15 18 22 20 24
F 15 14 16 21 21 21 12 11 13 13 12 13 19 17 21
IRL 20 18 22 12 10 15 17 17 18 16 18 14 44 35 51
I 18 17 19 25 25 25 18 17 19 16 15 16 17 16 19
L 11 11 11 20 22 17 11 10 11 9 9 10 7 7 8
NL 10 10 10 22 24 21 10 10 10 7 6 7 4 5 3
A 12 9 15 11 7 14 8 7 9 9 8 11 24 14 30
P 18 18 19 18 21 15 15 15 15 16 15 16 30 28 31
FIN 13 10 15 23 19 28 7 8 7 9 7 10 23 12 31
S 11 10 11 23 22 24 10 11 10 5 6 4 9 5 12
UK 15 13 18 20 18 21 12 10 14 11 10 12 24 19 28
EU152 15 13 16 19 19 20 12 11 14 12 12 13 19 16 21
Notes:
[image:11.595.72.523.382.458.2]1) Gender breakdown is based on assumption of equal sharing of resources within household. 2) The EU-15 average is calculated as a population-weighted average of the available national values. Source: Eurostat, ECHP UDB version November 2003.
Table 3: Persistent risk of poverty by broad age group and gender1, 2001 (%)
B DK D EL E F IRL I L NL A P FIN S UK EU152
Total 7 5 6 14 10 9 13 13 9 5 7 15 6 : 10 9
0-15 years 6 0 7 10 16 10 15 18 13 9 7 22 1 : 16 12
Total 8 6 6 15 9 9 13 12 8 4 7 13 7 : 9 9
Men 7 5 6 14 9 8 11 11 8 5 5 13 5 : 7 8
Women 9 8 7 16 10 9 15 12 8 4 9 13 9 : 10 9
16 years and over
Notes:
1) Gender breakdown is based on assumption of equal sharing of resources within household. 2) The EU-15 average is calculated as a population-weighted average of the available national values. Source: Eurostat, ECHP UDB version November 2003.
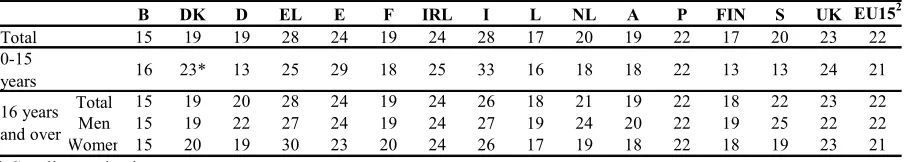
Table 4: Relative median at-risk-of-poverty gap by age group and gender1, 2001 (%)
B DK D EL E F IRL I L NL A P FIN S UK EU152
Total 15 19 19 28 24 19 24 28 17 20 19 22 17 20 23 22
0-15
years 16 23* 13 25 29 18 25 33 16 18 18 22 13 13 24 21
Total 15 19 20 28 24 19 24 26 18 21 19 22 18 22 23 22
Men 15 19 22 27 24 19 24 27 19 24 20 22 19 25 22 22
Women 15 20 19 30 23 20 24 26 17 19 18 22 18 19 23 21
16 years and over
* Small sample size. Notes:
[image:11.595.73.526.539.620.2]Table 5: At-risk-of-poverty threshold (illustrative values in PPS1), 2001
B DK D EL E F IRL I L NL A P FIN S UK EU152
Single person PPS1 9286 10197 9492 5443 6527 8765 7934 7044 14376 8309 9468 4967 7680 7679 8984 8253
Two adults with
two children PPS
1 19501 21413 19933 11431 13706 18407 16662 14793 30190 17449 19883 10431 16128 16126 18866 17332
Notes:
1) PPS: Purchasing Power Standards
[image:12.595.76.526.227.285.2]2) The EU-15 average is calculated as a population-weighted average of the available national values. Source: Eurostat, ECHP UDB version November 2003.
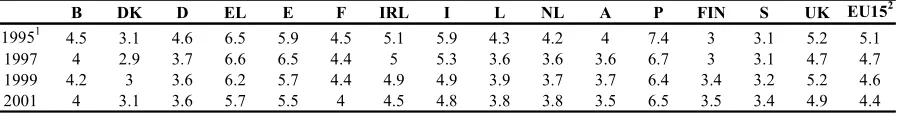
Table 6: Income quintile ratio (S80/S20), selected years (%)
B DK D EL E F IRL I L NL A P FIN S UK EU152
19951 4.5 3.1 4.6 6.5 5.9 4.5 5.1 5.9 4.3 4.2 4 7.4 3 3.1 5.2 5.1
1997 4 2.9 3.7 6.6 6.5 4.4 5 5.3 3.6 3.6 3.6 6.7 3 3.1 4.7 4.7
1999 4.2 3 3.6 6.2 5.7 4.4 4.9 4.9 3.9 3.7 3.7 6.4 3.4 3.2 5.2 4.6
2001 4 3.1 3.6 5.7 5.5 4 4.5 4.8 3.8 3.8 3.5 6.5 3.5 3.4 4.9 4.4
Notes:
1) Finland: 1996, Sweden: 1997; EU15 average excludes Finland, Sweden.
2) The EU-15 average is calculated as a population-weighted average of the available national values. Source: Eurostat, ECHP UDB version November 2003.
Table 7: Gini coefficient, selected years (%)
B DK D EL E F IRL I L NL A P FIN S UK EU152
19951 29 22 29 35 34 29 33 33 29 29 27 37 22 22 32 31
1997 27 20 25 35 35 29 33 31 25 26 25 36 22 22 30 29
1999 29 22 25 34 33 29 32 30 27 26 26 36 24 23 32 29
2001 28 22 25 33 33 27 29 29 27 26 24 37 24 24 31 28
Notes:
1) Finland: 1996, Sweden: 1997; EU15 average excludes Finland, Sweden.
2) The EU-15 average is calculated as a population-weighted average of the available national values. Source: Eurostat, ECHP UDB version November 2003.
Table 8: Dispersion around the at-risk-of-poverty threshold1, 2001 (%)
B DK D EL E F IRL I L NL A P FIN S UK EU152
40% 2 2 3 8 7 4 5 8 3 4 3 6 2 3 5 5
50% 6 7 6 14 13 9 15 13 6 6 6 13 6 6 11 9
60% 13 11 11 20 19 15 21 19 12 11 12 20 11 10 17 15
70% 21 19 19 28 27 23 29 27 21 19 19 28 20 18 26 23
Notes:
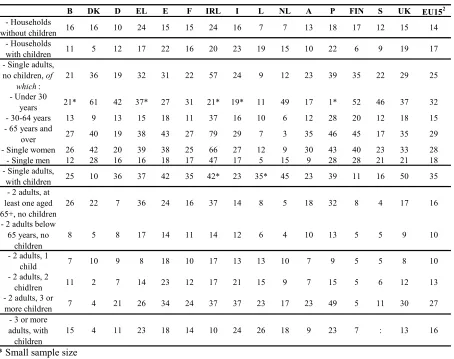
Table 9: At-risk-of-poverty rate by household type,1 2001 (%)
B DK D EL E F IRL I L NL A P FIN S UK EU152
- Households
without children 16 16 10 24 15 15 24 16 7 7 13 18 17 12 15 14
- Households
with children 11 5 12 17 22 16 20 23 19 15 10 22 6 9 19 17
- Single adults, no children, of
which:
21 36 19 32 31 22 57 24 9 12 23 39 35 22 29 25
- Under 30
years 21* 61 42 37* 27 31 21* 19* 11 49 17 1* 52 46 37 32
- 30-64 years 13 9 13 15 18 11 37 16 10 6 12 28 20 12 18 15
- 65 years and
over 27 40 19 38 43 27 79 29 7 3 35 46 45 17 35 29
- Single women 26 42 20 39 38 25 66 27 12 9 30 43 40 23 33 28
- Single men 12 28 16 16 18 17 47 17 5 15 9 28 28 21 21 18
- Single adults,
with children 25 10 36 37 42 35 42* 23 35* 45 23 39 11 16 50 35
- 2 adults, at least one aged 65+, no children
26 22 7 36 24 16 37 14 8 5 18 32 8 4 17 16
- 2 adults below 65 years, no
children
8 5 8 17 14 11 14 12 6 4 10 13 5 5 9 10
- 3 or more adults, with children
15 4 11 23 18 14 10 24 26 18 9 23 7 : 13 16
23 17 23 49
5 5
7 4 21 26 34 24 37 37
9 7 15 5 13
5 11 30 27
10
7 10 9 8 18 10 13 10 7 9
- 2 adults, 1 child
11
8 15
12 17 21 6 12
- 2 adults, 2 chidlren - 2 adults, 3 or
more children
17 13
2 7 14 23
* Small sample size Notes:
1) In this typology, children are defined as dependent children, that is, people aged 0 to 15 years or 16 to 24 years if inactive and living with at least one parent.
Table 10: At-risk-of-poverty rate by accommodation tenure status, 2001 (%)
B DK D EL E F IRL I L NL A P FIN S UK EU151
Owner-occupied and
rent-free
10 6 7 21 18 12 17 17 8 7 12 19 8 6 12 12
Rented 28 24 16 15 23 25 44 30 24 20 12 25 23 18 32 24
Notes:
[image:14.595.69.525.232.294.2]1) The EU-15 average is calculated as a population-weighted average of the available national values Source: Eurostat, ECHP UDB version November 2003.
Table 10bis: Distribution of the population at risk of poverty by accommodation tenure status, 2001 (%)
B DK D EL E F IRL I L NL A P FIN S UK EU151
Owner-occupied and
rent-free
60 45 37 93 90 53 66 73 50 37 72 72 56 41 55 58
Rented 40 55 63 7 10 47 34 27 50 63 28 28 44 59 45 42
Notes:
1) The EU-15 average is calculated as a population-weighted average of the available national values Source: Eurostat, ECHP UDB version November 2003.
Table 11: At-risk-of-poverty rate anchored at one moment in time (1998), 1998-2001
1998 1999 2000 2001
B 14 13 11 11
DK 12 10 11 10
D 11 10 9 9
EL 21 20 18 17
E 18 16 12 12
F 15 15 15 13
IRL 19 16 15 13
I 18 17 15 15
L 12 12 11 10
NL 10 9 9 10
A 13 12 10 10
P 21 19 17 16
FIN 9 10 9 9
S 10 9 10 8
UK 19 20 16 13
EU151 15 15 13 12
Notes:
[image:14.595.200.399.366.558.2]Table 12: At-risk-of-poverty rate after and before social cash transfers, by broad age group and gender1, 2001 (%)
After transfers Before transfers excluding pensions Before transfers including pensions
16 years and over 16 years and over 16 years and over
Total Men Women Total Men Women Total Men Women
B 13 12 14 12 15 23 26 22 20 25 38 26 41 36 45
DK 11 5 12 10 14 21 18 22 19 24 31 18 34 30 37
D 11 14 11 9 12 21 31 19 18 21 39 31 40 35 45
EL 20 18 21 19 22 23 21 23 21 24 39 24 42 38 44
E 19 26 18 16 19 23 30 22 21 24 37 33 38 35 40
F 15 18 15 14 16 24 32 22 21 23 40 32 42 40 45
IRL 21 26 20 18 22 30 36 28 26 31 36 36 36 34 38
I 19 25 18 17 19 22 27 21 20 22 42 30 44 41 46
L 12 18 11 11 11 23 36 20 21 20 40 38 41 38 44
NL 11 16 10 10 10 21 27 19 19 20 36 28 38 34 41
A 12 13 12 9 15 22 31 20 17 23 38 35 39 34 43
P 20 27 18 18 19 24 31 23 23 23 37 39 36 34 38
FIN 11 6 13 10 15 19 17 19 17 21 30 18 34 30 37
S 10 10 11 10 11 27 39 24 21 27 43 40 44 40 48
UK 17 24 15 13 18 29 39 26 22 30 40 40 41 36 45
EU152 15 19 15 13 16 24 31 22 20 24 39 32 41 37 44
All age groups 0-15 years All age groups 0-15 years All age groups 0-15 years Notes:
1) Gender breakdown is based on assumption of equal sharing of resources within household. 2) The EU-15 average is calculated as a population-weighted average of the available national values Source: Eurostat, ECHP UDB version November 2003.
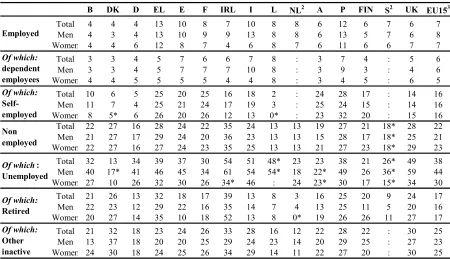
Table 13: At-risk-of-poverty rate by gender1 and most frequent activity status, 2001 (%)
B DK D EL E F IRL I L NL2 A P FIN S2 UK EU153
Total 4 4 4 13 10 8 7 10 8 8 6 12 6 7 6 7
Men 4 3 4 13 10 9 9 13 8 8 6 13 5 7 6 8
Women 4 4 6 12 8 7 4 6 8 7 6 11 6 6 7 7
Total 3 3 4 5 7 6 6 7 8 : 3 7 4 : 5 6
Men 3 3 4 5 7 7 7 10 8 : 3 9 3 : 4 6
Women 4 4 5 5 5 5 4 4 8 : 3 4 5 : 6 5
Total 10 6 5 25 20 25 16 18 2 : 24 28 17 : 14 16
Men 11 7 4 25 21 24 17 19 3 : 25 24 15 : 14 16
Women 8 5* 6 26 20 26 12 13 0* : 23 32 20 : 15 16
Total 22 27 16 28 24 22 35 24 13 13 19 27 21 18* 28 22
Men 21 27 17 29 24 20 36 23 13 13 15 28 17 18* 25 21
Women 22 27 16 27 24 23 35 25 13 13 21 27 23 18* 29 23
Total 32 13 34 39 37 30 54 51 48* 23 23 38 21 26* 49 38
Men 40 17* 41 46 45 34 61 54 54* 18 22* 49 26 36* 59 44
Women 27 10 26 32 30 26 34* 46 : 24 23* 30 17 15* 34 30
Total 21 26 13 32 18 17 39 13 8 3 16 25 20 9 24 17
Men 22 23 12 29 22 16 35 14 7 4 13 25 11 5 20 16
Women 20 27 14 35 10 18 52 13 8 0* 19 26 26 11 27 17
Total 21 32 18 23 24 26 33 28 16 12 22 28 22 : 30 25
Men 13 37 18 20 20 25 29 24 23 14 20 29 25 : 27 23
Women 24 30 18 24 25 26 34 29 14 11 22 27 20 : 30 25
Of which: Retired Of which: Other inactive Employed Of which: dependent employees Of which: Self-employed
Of which: Unemployed Non employed
Notes:
1) Gender breakdown is based on assumption of equal sharing of resources within household.
2) For the Netherlands and Sweden, the data are compiled on the basis of the current activity status, since there is no calendar of activities in the national questionnaire. The variable "number of months worked", therefore, cannot be filled in.
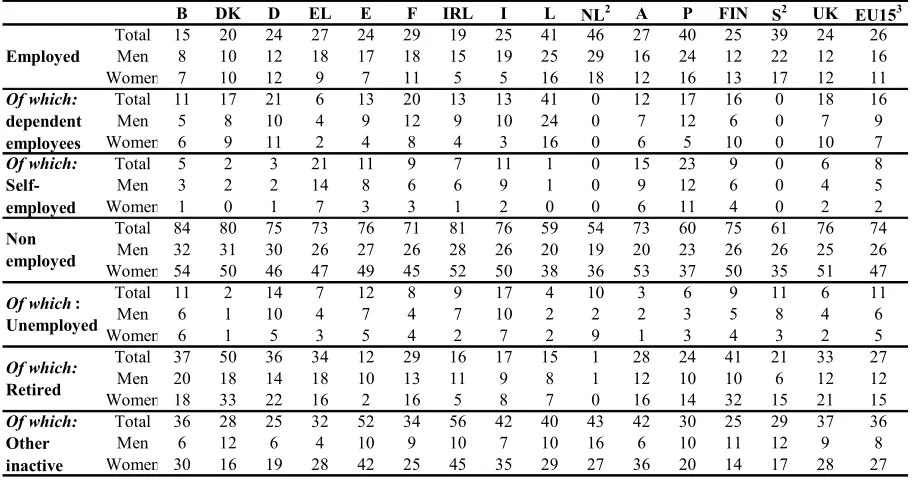
[image:15.595.71.521.386.645.2]Table 13bis: Distribution of the adult population (aged 16 years and over) at risk of poverty by gender1 and most frequent activity status, 2001 (%)
B DK D EL E F IRL I L NL2 A P FIN S2 UK EU153
Total 15 20 24 27 24 29 19 25 41 46 27 40 25 39 24 26
Men 8 10 12 18 17 18 15 19 25 29 16 24 12 22 12 16
Women 7 10 12 9 7 11 5 5 16 18 12 16 13 17 12 11
Total 11 17 21 6 13 20 13 13 41 0 12 17 16 0 18 16
Men 5 8 10 4 9 12 9 10 24 0 7 12 6 0 7 9
Women 6 9 11 2 4 8 4 3 16 0 6 5 10 0 10 7
Total 5 2 3 21 11 9 7 11 1 0 15 23 9 0 6 8
Men 3 2 2 14 8 6 6 9 1 0 9 12 6 0 4 5
Women 1 0 1 7 3 3 1 2 0 0 6 11 4 0 2 2
Total 84 80 75 73 76 71 81 76 59 54 73 60 75 61 76 74
Men 32 31 30 26 27 26 28 26 20 19 20 23 26 26 25 26
Women 54 50 46 47 49 45 52 50 38 36 53 37 50 35 51 47
Total 11 2 14 7 12 8 9 17 4 10 3 6 9 11 6 11
Men 6 1 10 4 7 4 7 10 2 2 2 3 5 8 4 6
Women 6 1 5 3 5 4 2 7 2 9 1 3 4 3 2 5
Total 37 50 36 34 12 29 16 17 15 1 28 24 41 21 33 27
Men 20 18 14 18 10 13 11 9 8 1 12 10 10 6 12 12
Women 18 33 22 16 2 16 5 8 7 0 16 14 32 15 21 15
Total 36 28 25 32 52 34 56 42 40 43 42 30 25 29 37 36
Men 6 12 6 4 10 9 10 7 10 16 6 10 11 12 9 8
Women 30 16 19 28 42 25 45 35 29 27 36 20 14 17 28 27
Of which: Unemployed
Of which:
Retired
Of which:
Other inactive Employed
Of which:
dependent employees
Of which:
Self-employed
Non employed
Notes:
1) Gender breakdown is based on assumption of equal sharing of resources within household.
2) For the Netherlands and Sweden, the data are compiled on the basis of the current activity status, since there is no calendar of activities in the national questionnaire. The variable "number of months worked", therefore, cannot be filled in.
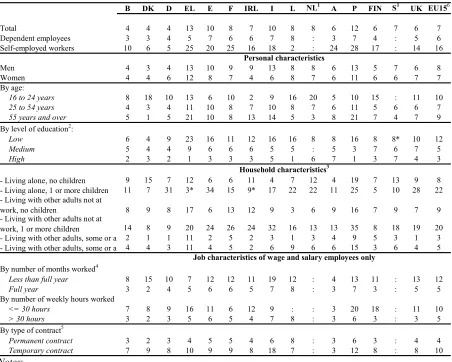
Table 14: In- work poverty risk by main characteristics of the employed population
B DK D EL E F IRL I L NL1 A P FIN S1 UK EU156
Total 4 4 4 13 10 8 7 10 8 8 6 12 6 7 6 7
Dependent employees 3 3 4 5 7 6 6 7 8 : 3 7 4 : 5 6
Self-employed workers 10 6 5 25 20 25 16 18 2 : 24 28 17 : 14 16
Personal characteristics
Men 4 3 4 13 10 9 9 13 8 8 6 13 5 7 6 8
Women 4 4 6 12 8 7 4 6 8 7 6 11 6 6 7 7
By age:
16 to 24 years 8 18 10 13 6 10 2 9 16 20 5 10 15 : 11 10
25 to 54 years 4 3 4 11 10 8 7 10 8 7 6 11 5 6 6 7
55 years and over 5 1 5 21 10 8 13 14 5 3 8 21 7 4 7 9
By level of education2:
Low 6 4 9 23 16 11 12 16 16 8 8 16 8 8* 10 12
Medium 5 4 4 9 6 6 6 5 5 : 5 3 7 6 7 5
High 2 3 2 1 3 3 3 5 1 6 7 1 3 7 4 3
Household characteristics3
- Living alone, no children 9 15 7 12 6 6 11 4 7 12 4 19 7 13 9 8
- Living alone, 1 or more children 11 7 31 3* 34 15 9* 17 22 22 11 25 5 10 28 22
8 9 8 17 6 13 12 9 3 6 9 16 7 9 7 9
14 8 9 20 24 26 24 32 16 13 13 35 8 18 19 20
- Living with other adults, some or all at work, no children2 1 1 11 2 5 2 3 1 3 4 9 5 3 1 3
- Living with other adults, some or all at work, 1 or more children4 4 3 11 4 5 2 6 9 6 6 15 3 6 4 5
Job characteristics of wage and salary employees only
By number of months worked4
Less than full year 8 15 10 7 12 12 11 19 12 : 4 13 11 : 13 12
Full year 3 2 4 5 6 6 5 7 8 : 3 7 3 : 5 5
By number of weekly hours worked
<= 30 hours 7 8 9 16 11 6 12 9 : : 3 20 18 : 11 10
> 30 hours 3 2 3 5 6 5 4 7 8 : 3 6 3 : 3 5
By type of contract5
Permanent contract 3 2 3 4 5 5 4 6 8 : 3 6 3 : 4 4
Temporary contract 7 9 8 10 9 9 8 18 7 : 3 12 8 : 8 10
- Living with other adults not at work, no children
- Living with other adults not at work, 1 or more children
Notes:
1) For the Netherlands and Sweden, the data are compiled on the basis of the current activity status, since there is no calendar of activities in the national questionnaire. The variable "number of months worked", therefore, cannot be filled in.
2) Low = ISCED 0-2; Medium=ISCED 3; High= ISCED 4 and more.
3) Work for the other members of the household is defined in the same way as for the observation unit: that is, are considered workers only those who declare to have worked for more than half the total number of months for which they have been able to proved infirmation on their activity status in the calendar year - i.e., normally, for at least 7 out of 12 months. Children are defined as dependent children, that is, individuals aged 0-15 and 16-24 if still inactive and living with at least one parent.
4) "Full year" corresponds to work over the total number of months for which information on the activity status has been provided. "Less than full year" corresponds to work for more than half, but less than all, the number of months for which information on activity status is provided.
5) "Temporary contract" includes "fixed-term or short-term contracts", "casual work with no contract" and "some other working arragement".
Table 15: Dispersion of regional employment rates1, selected years (%)
B DK2 D EL E F IRL2 I L2 NL A P FIN S UK EU153
1996 7.8 : 5.6 7.3 10.5 7 : 17.4 : 3.3 3.3 4.7 7.4 4.5 7.4 15.5
1998 7.6 : 5.4 5.6 11.7 7.2 : 16.6 : 3 2.7 4.3 7.4 4.4 7.5 15.7
1999 8.0 : 5.5 5.2 10.7 7.1 : 17.1 : 2.3 2.3 3.6 7.6 5.0 7.1 14.0
2000 7.9 : 5.7 5.1 10.5 6.9 : 17.5 : 2.2 2.5 4.2 8.0 4.9 7.0 13.4
2001 8 : 6.1 4.6 9.9 6.4 : 17.1 : 2.3 2.6 3.6 8.2 4.2 6.8 13.2
2002 8.0 : 5.9 4.2 9.2 6.2 : 16.6 : 2.2 2.4 3.9 7.8 4.6 6.6 12.6
Notes:
1) Coefficient of variation of employment rates across regions at NUTS2 level.
2) Not applicable for Denmark, Ireland and Luxembourg as NUTS2 corresponds to the national level.
3) EU average is calculated as the coefficient of variation across all NUTS2 regions in the EU, including Denmark, Ireland and Luxembourg.
Source: Eurostat, EU Labour Force Survey – annual averages. Spring data for 1996 and 1998.
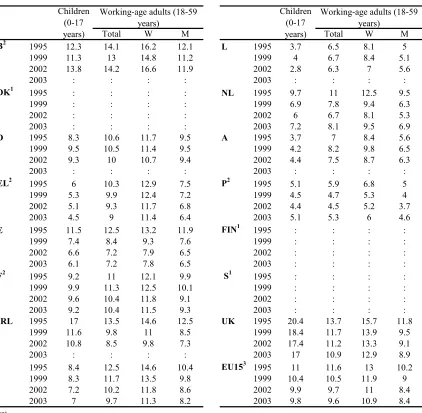
Table 16: People living in jobless households: children and working-age women and men, selected years (%)
Working-age adults (18-59 years)
Working-age adults (18-59 years)
Total W M Total W M
B2 1995 12.3 14.1 16.2 12.1 L 1995 3.7 6.5 8.1 5
1999 11.3 13 14.8 11.2 1999 4 6.7 8.4 5.1
2002 13.8 14.2 16.6 11.9 2002 2.8 6.3 7 5.6
2003 : : : : 2003 : : : :
DK1 1995 : : : : NL 1995 9.7 11 12.5 9.5
1999 : : : : 1999 6.9 7.8 9.4 6.3
2002 : : : : 2002 6 6.7 8.1 5.3
2003 : : : : 2003 7.2 8.1 9.5 6.9
D 1995 8.3 10.6 11.7 9.5 A 1995 3.7 7 8.4 5.6
1999 9.5 10.5 11.4 9.5 1999 4.2 8.2 9.8 6.5
2002 9.3 10 10.7 9.4 2002 4.4 7.5 8.7 6.3
2003 : : : : 2003 : : : :
EL2 1995 6 10.3 12.9 7.5 P2 1995 5.1 5.9 6.8 5
1999 5.3 9.9 12.4 7.2 1999 4.5 4.7 5.3 4
2002 5.1 9.3 11.7 6.8 2002 4.4 4.5 5.2 3.7
2003 4.5 9 11.4 6.4 2003 5.1 5.3 6 4.6
E 1995 11.5 12.5 13.2 11.9 FIN1 1995 : : : :
1999 7.4 8.4 9.3 7.6 1999 : : : :
2002 6.6 7.2 7.9 6.5 2002 : : : :
2003 6.1 7.2 7.8 6.5 2003 : : : :
F2 1995 9.2 11 12.1 9.9 S1 1995 : : : :
1999 9.9 11.3 12.5 10.1 1999 : : : :
2002 9.6 10.4 11.8 9.1 2002 : : : :
2003 9.2 10.4 11.5 9.3 2003 : : : :
IRL 1995 17 13.5 14.6 12.5 UK 1995 20.4 13.7 15.7 11.8
1999 11.6 9.8 11 8.5 1999 18.4 11.7 13.9 9.5
2002 10.8 8.5 9.8 7.3 2002 17.4 11.2 13.3 9.1
2003 : : : : 2003 17 10.9 12.9 8.9
I 1995 8.4 12.5 14.6 10.4 EU153 1995 11 11.6 13 10.2
1999 8.3 11.7 13.5 9.8 1999 10.4 10.5 11.9 9
2002 7.2 10.2 11.8 8.6 2002 9.9 9.7 11 8.4
2003 7 9.7 11.3 8.2 2003 9.8 9.6 10.9 8.4
Children (0-17 years)
Children (0-17 years)
Notes:
1) No household-based data are available from the Labour Force Surveys in Denmark, Finland and Sweden 2) Break in the series: changes in the sample design or definition: P(1999), B(1999), GR(2003), F(2003)
3) Excluding DK, FIN and S. For the other missing countries, the closest available year is used to estimate EU data.
[image:18.595.89.511.283.696.2]Table 17: Long-term unemployment rate by gender, selected years (%)
Total Women Men Total Women Men
B 1990 4.3 6.9 2.5 L 1990 0.6 0.7 0.5
1995 5.8 7.7 4.5 1995 0.7 1 0.6
1998 5.5 7 4.5 1998 0.9 1.1 0.7
2001 3.2 3.6 3 2001 0.6 0.7 0.5
2002 3.5 4.1 3.1 2002 0.8 1 0.6
DK 1990 2.2 2.6 1.8 NL 1990 2.7 3.4 2.2
1995 2 2.2 1.8 1995 3.1 3.3 2.9
1998 1.3 1.8 0.9 1998 1.5 1.8 1.3
2001 0.8 1 0.7 2001 0.6 0.8 0.5
2002 0.9 0.9 0.8 2002 0.7 0.8 0.6
D 1990 NA NA NA A 1990 NA NA NA
1995 3.9 4.8 3.2 1995 1 1.5 0.7
1998 4.7 5.3 4.2 1998 1.3 1.8 1
2001 3.8 4.1 3.7 2001 0.9 1.1 0.7
2002 4 4.1 3.9 2002 0.8 1.1 0.6
EL 1990 3 5.9 1.4 P 1990 2.3 2.7 2
1995 4.7 8.1 2.5 1995 3.3 3.4 3.3
1998 5.8 9.9 3.1 1998 2.2 2.7 1.9
2001 5.4 8.6 3.1 2001 1.5 1.9 1.2
2002 5.1 8.3 3 2002 1.8 2.2 1.4
E 1990 7.9 15.2 4 FIN 1990 NA NA NA
1995 10.5 16.8 6.6 1995 NA NA NA
1998 7.6 12.4 4.8 1998 4.1 4 4.3
2001 3.9 6.3 2.3 2001 2.5 2.3 2.7
2002 3.9 6.3 2.3 2002 2.3 2 2.5
F 1990 3.4 4.7 2.4 S 1990 0.1 0 0.2
1995 4.5 5.5 3.6 1995 2.3 1 3.6
1998 4.6 5.5 3.9 1998 2.6 1.8 3.2
2001 3 3.7 2.4 2001 1 0.8 1.2
2002 2.8 3.3 2.2 2002 1 0.8 1.2
IRL 1990 9.1 8.9 9.2 UK 1990 2.2 1.4 2.8
1995 8 7.3 8.5 1995 3.6 2 4.8
1998 3.9 2.8 4.6 1998 1.9 1.2 2.5
2001 1.2 0.8 1.6 2001 1.3 0.8 1.7
2002 1.3 0.7 1.7 2002 1.1 0.7 1.4
I 1990 NA NA NA EU15 1990 NA NA NA
1995 7.3 10.5 5.4 1995 4.9 5.9 4.2
1998 7 9.5 5.4 1998 4.4 5.4 3.7
2001 5.8 8 4.5 2001 3.1 3.7 2.7
2002 5.3 7.2 4.1 2002 3 3.6 2.6
Table 18: Long-term unemployment share by gender, selected years (%)
Total Men Women Total Men Women
B 1990 64.7 66 62.3 L 1990 33.1 27 39.4
1995 60.1 61 58.9 1995 24.6 22.1 27.6
1998 59.6 60.8 58.2 1998 31.6 27 37.8
2001 48.4 47.1 49.6 2001 27.8 24.1 31.5
2002 48.6 49.9 47.3 2002 27.4 26.7 28.3
DK 1990 30.1 33.6 26.7 NL 1990 45.8 40.3 52.5
1995 29.3 27.7 31.3 1995 47.1 41 53.6
1998 26.6 29.3 23.4 1998 40 36.6 44.4
2001 19.6 20.4 18.6 2001 25.8 26.5 25.2
2002 19 20.7 17.3 2002 25.7 26.8 24.6
D 1990 NA NA NA A 1990 NA NA NA
1995 48.2 51.1 45.3 1995 26.8 29.9 24
1998 51.3 54.2 48.8 1998 29.8 33.4 27
2001 49.1 51.7 47.1 2001 23.6 25.8 22
2002 46.7 49.3 44.8 2002 18.7 23.6 15.3
EL 1990 47.4 54.2 36.8 P 1990 47.7 39.9 59.6
1995 50.7 57.6 40.9 1995 45.2 41.1 50.6
1998 53.2 59.4 43.6 1998 43.8 42.6 45.2
2001 51.6 55.7 45.5 2001 37.7 37.9 37.3
2002 51.2 55 45.3 2002 34.4 35.4 33.2
E 1990 60.5 76.8 41.2 FIN 1990 NA NA NA
1995 55.9 66.4 44.5 1995 NA NA NA
1998 50.2 56.8 42.6 1998 36.4 33 39.6
2001 36.7 41 31 2001 27.2 23.6 30.8
2002 34.2 38.2 28.8 2002 24.7 21.6 27.7
F 1990 39.3 41.6 36.4 S 1990 5.2 1.1 9.3
1995 39.4 40.6 38 1995 25.9 12.7 36.6
1998 40.6 41.1 40 1998 31.4 22.3 38.4
2001 35.3 35.9 34.5 2001 20.9 18.4 22.8
2002 31.3 33.4 29.1 2002 19.9 16.9 22.2
IRL 1990 67.6 60.6 71.6 UK 1990 32.4 22.1 39.4
1995 65.3 58.7 69.4 1995 41.9 30.2 48.1
1998 52.1 38.8 60.4 1998 30.3 21.7 35.7
2001 32 19.9 40.1 2001 25.3 17.3 30.3
2002 29.8 18.5 36.9 2002 21.9 16.1 25.6
I 1990 NA NA NA EU15 1990 NA NA NA
1995 63.4 65 61.7 1995 49 50.8 47
1998 59.4 59.3 59.6 1998 47 48.4 45.6
2001 61.6 62 61.2 2001 42.5 43.6 41.4
2002 59.1 59.4 58.8 2002 39.3 41.1 37.7
Table 19: Very long-term unemployment rate by gender, selected years (%)
Total Men Women Total Men Women
B 1995 3.8 2.8 5.1 L 1995 0.3 0.2 0.4
1998 4 3.3 4.9 1998 0.3 0.3 0.4
2001 2.2 2 2.5 2001 0.2 0.2 0.2
2002 2.4 2.1 2.8 2002 0.3 0.2 0.4
DK 1995 0.8 0.7 1 NL 1995 2.1 2 2.1
1998 0.6 0.4 0.8 1998 1 1 1.1
2001 0.3 0.3 0.3 2001 0.3 0.3 0.4
2002 0.3 0.3 0.4 2002 0.4 0.3 0.4
D 1995 2.2 1.7 2.9 A 1995 0.6 0.5 0.7
1998 2.9 2.5 3.3 1998 0.7 0.6 0.9
2001 2.5 2.3 2.7 2001 0.4 0.4 0.5
2002 2.5 2.4 2.7 2002 0.3 0.3 0.3
EL 1995 2.6 1.3 4.7 P 1995 1.6 1.4 1.8
1998 3.7 1.8 6.5 1998 1.3 1.1 1.6
2001 3.1 1.7 5.1 2001 0.8 0.5 1.1
2002 3 1.7 5 2002 0.9 0.7 1.1
E 1995 7 4.3 11.5 FIN 1995 : : :
1998 5.1 3 8.6 1998 2.2 2.3 2.1
2001 2.3 1.3 3.9 2001 1.4 1.6 1.1
2002 2.2 1.2 3.7 2002 1.2 1.4 0.9
F 1995 2.3 1.9 2.9 S 1995 0 0 0
1998 2.6 2.1 3.1 1998 0 0 0
2001 1.7 1.4 2.1 2001 0 0 0
2002 1.4 1.1 1.8 2002 0 0 0
IRL 1995 5.2 6 3.8 UK 1995 2.3 3.2 1.1
1998 2.9 3.6 1.7 1998 1.2 1.7 0.6
2001 0.7 1 0.4 2001 0.7 1 0.4
2002 0.7 1 0.3 2002 0.6 0.8 0.4
I 1995 4.9 3.7 7 EU15 1995 3 2.6 3.7
1998 4.9 3.8 6.5 1998 2.8 2.3 3.4
2001 4.3 3.3 5.9 2001 2 1.7 2.4
2002 3.8 3 5.2 2002 1.8 1.6 2.2
Table 20: Early school leavers not in education or training, by gender, selected years (%)
Total Women Men Total Women Men
B1 1995 15.1 13.5 16.6 L1 1995 33.4 33.9 32.9
1999 15.2 12.7 17.7 1999 19.1 19.4 18.9
2002 12.4 9.9 14.9 2002 17.0 19.6 14.4
2003 : : : 2003 : : :
DK1 1995 6.1 6.9 5.2 NL 1995 0.0 0.0 0.0
1999 11.5 9.1 14.2 1999 16.2 14.9 17.5
2002 15.4 17.0 13.8 2002 15.0 14.3 15.7
2003 10.0 9.6 10.3 2003 : : :
D 1995 : : : A 1995 13.6 17.3 9.9
1999 14.9 15.6 14.2 1999 10.7 11.9 9.6
2002 12.6 12.6 12.6 2002 9.5 10.3 8.8
2003 : : : 2003 : : :
EL1 1995 22.4 18.8 26.6 P1 1995 41.4 35.5 47.1
1999 17.8 14.8 21.2 1999 44.8 38.8 50.7
2002 16.1 12.3 20.1 2002 45.5 38.1 52.9
2003 15.3 11.0 19.6 2003 41.1 33.8 48.3
E 1995 33.8 29.2 38.4 FIN 1995 : : :
1999 29.5 23.6 35.4 1999 9.9 7.9 12.0
2002 29.0 22.3 35.4 2002 9.9 7.3 12.6
2003 29.8 23.4 36.1 2003 : : :
F1 1995 15.4 14.2 16.7 S1 1995 : : :
1999 14.7 13.4 16.0 1999 6.9 6.1 7.7
2002 13.4 11.9 14.9 2002 10.4 9.3 11.4
2003 13.8 12.1 15.5 2003 : : :
IRL1 1995 21.4 17.1 25.7 UK2 1995 : : :
1999 14.7 10.8 18.5 1999 : : :
2002 14.7 10.8 18.5 2002 : : :
2003 12.1 9.2 14.9 2003 : : :
I 1995 32.4 29.1 35.8 EU153 1995 : : :
1999 27.2 24.2 30.3 1999 20.6 18.3 23.0
2002 24.3 20.7 27.9 2002 18.8 16.2 21.4
2003 24.6 21.3 27.9 2003 18.5 16.0 21.0
Notes:
1) Break in the series: changes in the sample design or definition: B(1999), IRL(1999), L (1999), P(1999, 2002), S(2002), DK(2003), GR(2003), F(2003)
2) Agreement has not yet been reached with the UK on the definition of upper secondary attainment. Comparable data are therefore not currently available for this country.
Table 21: Persons with low educational attainment by age and gender, 2003 (%)
Age B DK D EL E F IRL I L NL A P FIN S UK EU151
M 26.7 14.3 13.5 27.5 43.8 21.5 24.2 41.1 32.3 24.3 11.7 68.4 15.7 8.9 : 28.4 W 20.9 12.6 16.7 21.3 36.3 19.5 18.1 35.6 30.8 21.0 18.7 58.3 8.9 8.0 : 25.6 T 23.9 13.5 15.1 24.5 40.1 20.5 21.2 38.4 31.6 22.7 15.2 63.4 12.4 8.5 : 27.0 M 35.4 18.0 12.0 36.2 53.0 30.1 36.5 50.3 31.7 26.8 12.5 81.4 17.9 15.1 : 32.3 W 34.0 15.6 17.0 37.7 51.4 33.1 29.4 47.1 39.6 29.4 22.7 75.8 13.2 10.6 : 33.6 T 34.7 16.8 14.4 37.0 52.2 31.6 32.9 48.7 35.6 28.1 17.5 78.5 15.6 12.9 : 33.0 M 44.7 14.9 11.6 49.6 63.7 37.3 50.6 54.8 35.8 31.1 18.3 83.9 30.5 24.5 : 37.6 W 47.4 18.1 20.5 56.0 70.7 45.6 46.1 59.8 47.9 43.3 33.4 84.1 25.9 17.6 : 44.5 T 46.1 16.5 16.1 52.9 67.2 41.5 48.3 57.3 41.7 37.2 25.8 84.0 28.2 21.1 : 41.1 M 55.5 21.1 14.5 64.3 76.4 48.0 63.4 68.9 37.8 35.5 24.3 89.0 46.7 34.8 : 45.6 W 63.1 31.4 32.0 75.1 85.7 58.5 61.1 77.9 60.8 56.5 42.5 92.0 47.6 31.6 : 58.0 T 59.4 26.2 23.2 69.8 81.2 53.3 62.2 73.6 49.2 45.9 33.6 90.6 47.2 33.2 : 51.9 M 69.5 48.2 18.8 79.3 87.3 70.1 77.8 83.5 51.9 48.8 35.9 94.2 67.5 48.1 : 61.3 W 79.0 66.1 53.7 89.1 94.7 80.4 77.7 90.2 81.0 71.2 62.2 96.2 75.2 47.6 : 76.8 T 75.1 58.5 39.4 84.7 91.6 76.2 77.7 87.5 68.8 61.7 51.9 95.4 72.2 47.8 : 70.4 65 years
and over 25-34
years 35-44
years 45-54
years 55-64
years
Notes:
[image:23.595.71.525.341.424.2]1) Excluding UK. 2002 data for B, D, L, NL, A, S and FIN. EU15 data based on 2002 data for these countries Source: Eurostat, LFS, Spring data. Provisional data
Table 22: Life expectancy at birth by gender, 1990 and 2000 (%)
B DK D EL E F IRL I L NL A P FIN S UK EU151
1990 Total1 76 74.8 75.1 77 76.7 76.8 74.8 76.8 75.3 77.3 75.6 73.8 74.8 77.5 75.6 76 M 72.7 72 72 74.6 73.3 72.8 72.1 73.6 72.3 73.8 72.4 70.4 70.9 74.8 72.9 72.8 W 79.4 77.7 78.4 79.5 80.3 80.9 77.6 80.1 78.5 80.9 78.9 77.4 78.9 80.4 78.5 79.4 2000 Total1 77.6 76.8 78.1 78 79.2 78.9 76.8 79.3 78 77.9 78.2 76.7 77.5 79.6 77.9 78.4 M 74.6 74.5 75 75.5 75.7 75.2 74.3 76.3 74.8 75.5 75.4 73.2 74.2 77.4 75.5 75.3 W 80.8 79.3 81 80.6 82.5 82.7 79.2 82.4 81.1 80.5 81.2 80 81 82 80.2 81.4
Notes:
1) Estimations by Eurostat.
Source: Eurostat, Demography statistics.
Table 23: Self defined health status by income quintile1, 2000 (%)
B DK D EL E F IRL I L NL A P FIN S UK EU152
Q1 (low) 9 11 24 15 16 12 5 14 : 9 13 31 12 9 15 16
Q5 (high) 2 2 14 3 4 4 1 7 : 3 3 8 5 3 5 7
Notes:
1) Proportion of the population aged 16 years and over in the bottom (Q1) and top (Q5) quintile of the income distribution who classify themselves as in a bad or very bad state of health.
[image:23.595.73.528.489.531.2]Context information: population
EU-15 B DK D EL E F IRL I L NL A P FIN S UK
Total population (1000)
1.1.1960 314 826 9 129 4 565 72 543 8 300 30 327 45 465 2 836 50 026 313 11 417 7 030 8 826 4 413 7 471 52 164 1.1.1980 354 572 9 855 5 122 78 180 9 588 37 242 53 731 3 393 56 388 363 14 091 7 546 9 714 4 771 8 303 56 285 1.1.2000 375 974 10 239 5 330 82 163 10 543 39 442 58 744 3 777 57 680 436 15 864 8 103 9 998 5 171 8 861 59 623 1.1.2001, revised estimate 377 988 10 263 5 349 82 260 10 565 40 122 59 040 3 826 57 844 441 15 987 8 121 10 243 5 181 8 883 59 863 1.1.2002, first esimate 379 449 10 292 5 367 82 360 10 596 40 428 59 344 3 874 58 018 447 16 101 8 140 10 303 5 195 8 910 60 075 2010, baseline scenario,
revision 1999 383 397 10 352 5 476 83 435 10 768 39 857 61 369 4 141 57 277 471 16 690 8 149 10 309 5 267 8 951 60 885 2015, baseline scenario,
revision 1999 385 186 10 419 5 514 83 477 10 817 39 824 62 192 4 295 56 761 485 16 993 8 163 10 437 5 295 9 017 61 495 2020, baseline scenario,
revision 1999 385 984 10 483 5 554 83 295 10 806 39 528 62 840 4 427 55 985 500 17 270 8 170 10 526 5 314 9 115 62 173 2050, baseline scenario,
revision 1999 364 485 10 104 5 555 76 006 10 231 35 145 62 153 4 757 48 072 559 17 679 7 612 10 669 4 951 9 197 61 793
Population growth rates (per 1000 population), 2000
Total increase 2.8 2.3 3.6 0.4 2.1 1.2 5.0 11.4 2.8 12.8 7.5 2.3 2.5 1.9 2.4 3.5 Natural increase 1.0 1.1 1.7 -0.9 -0.2 0.7 4.1 6.1 -0.3 4.5 4.1 0.2 1.4 1.4 -0.3 1.2 Net migration 1.8 1.2 1.9 1.3 2.3 0.5 0.9 5.3 3.1 8.3 3.3 2.1 1.1 0.5 2.7 2.3
Population structure (percentage of total), 2000
Total 100 100 100 100 100 100 100 100 100 100 100 100 100 100 100 100
0-19 23.0 23.6 23.7 21.3 21.8 21.7 25.6 30.8 19.8 24.4 24.4 22.8 23.5 24.7 24.2 25.3 20-59 55.4 54.5 56.6 55.7 55.1 56.7 53.9 54.1 56.3 56.5 57.5 56.8 55.9 55.5 53.6 54.3 60-79 18.0 18.4 15.8 19.4 19.6 17.9 16.9 12.6 20.0 16.0 15.0 16.9 17.8 16.5 17.2 16.5 80 and over 3.7 3.5 3.9 3.6 3.5 3.7 3.6 2.5 3.9 3.1 3.2 3.5 2.8 3.3 4.9 4.0
155 842 4 294 2 457 37 853 3 993 13 184 24 477 1 291 21 968 172 6 850 3 298 3 410 2 382 4 394 25 820
1981/82 2.8 2.7 2.4 2.5 3.1 3.6 2.7 3.6 3.0 2.8 2.8 2.7 3.3 2.6 2.3 2.7
1991 2.6 2.6 2.2 2.3 2.8 3.3 2.5 3.3 2.8 2.7 2.4 2.6 3.1 2.3 2.1 2.5
2001 2.4 2.4 2.2 2.1 2.6 3.0 2.4 3.0 2.6 2.5 2.3 2.4 2.9 2.1 2.0 2.3
Population living in private households by household type, 2000
Total population 100 100 100 100 100 100 100 100 100 100 100 100 100 100 100 100
1 adult without dependent
children 12 12 17 16 8 5 13 7 9 10 14 12 5 17 20 13
... aged under 30 2 1 4 3 1 0 2 1 0 2 3 2 0 4 5 2
... aged 30-64 5 5 7 7 3 2 5 3 3 5 6 6 1 8 9 6
... aged 65 or more 5 6 6 6 4 3 5 3 5 4 5 5 3 6 6 6
... Male 5 5 8 7 3 2 5 4 3 4 6 5 1 7 10 6
... Female 7 8 9 9 5 3 8 4 6 5 8 8 3 10 10 7
2 adults without dependent
children 24 25 28 29 22 17 25 14 18 19 29 23 16 26 25 27
... both younger 65 14 14 19 18 9 7 15 8 8 12 20 14 8 16 15 17
... at least one aged 65 or 10 11 9 11 13 10 10 6 10 7 9 9 9 9 10 10
3 or more adults without
dependent children 14 11 8 10 21 23 8 13 21 12 10 15 18 5 1 11
1 adult with dependent 4 5 3 4 2 2 5 3 2 3 3 3 3 5 7 8
2 adults with dependent
children 35 40 35 33 34 34 42 39 36 44 35 33 38 41 45 32
… 1 child 11 12 11 12 10 11 12 8 13 14 9 11 16 13 12 9
… 2 children 17 17 15 15 18 18 18 15 18 19 17 16 17 17 20 15
… 3 or more children 8 11 9 6 5 5 12 17 5 11 8 6 5 11 13 9
3 or more adults with
dependent children 11 7 10 7 13 20 8 24 13 12 9 14 20 6 1 8
Total fertility rate
1960 2.59 2.56 2.57 2.37 2.28 2.86 2.73 3.76 2.41 2.28 3.12 2.69 3.1 2.72 2.2 2.72 1980 1.82 1.68 1.55 1.56 2.21 2.20 1.95 3.23 1.64 1.49 1.60 1.65 2.18 1.63 1.68 1.90 1990 1.57 1.62 1.67 1.45 1.39 1.36 1.78 2.11 1.33 1.61 1.62 1.45 1.57 1.78 2.13 1.83 2000 1.53 1.65 1.76 1.34 1.30 1.22 1.89 1.89 1.25 1.78 1.72 1.32 1.54 1.73 1.54 1.64
The total fertility rate is the average number of children that would be born alive to a woman during her lifetime if current fertility rates were to continue. Note: Dependent children include all children younger than 15 years plus all those persons aged 15-24 who are economically inactive (mainly in education) and who are living with at least one of their parents.
Source: Eurostat - European Labour Force Survey 2000. DK, IRL, FIN, S: European Community Household Panel, UDB September 2001.
DK: 2000, S: 1990 and 2000. DK, IRL (2001), FIN, S: data from national sources. Source: Eurostat - Censuses of Population (1981/82). European Union Labour Force The new estimates for 1.1.2001 and 1.1.2002 could not be incorporated into the portrait "2. Demography, households and families" in Section 3.
Source: Eurostat - Demographic statistics.
The increase in total population is made up of the natural increase (live births less deaths) and net migration. Net migration is estimated on the basis of the difference between population change and natural increase (corrected net migration).
Context information: social protection expenditure
EU-15 B DK D EL E F IRL I L NL A P FIN S UK
Expenditure on social protection as a percentage of GDP
1991 26.4 27.1 29.7 26.1 21.6 21.2 28.4 19.6 25.2 22.5 32.6 27.0 17.2 29.8 34.3 25.7 1996 28.4 28.6 31.4 29.9 22.9 21.9 31.0 17.8 24.8 24.0 30.1 29.5 21.2 31.6 34.7 28.1 1999 27.5 27.4 29.8 29.6 25.5 20.2 30.2 14.8 25.3 21.8 28.0 28.8 22.6 26.7 32.9 26.5 2000 27.3 26.7 28.8 29.5 26.4 20.1 29.7 14.1 25.2 21.0 27.4 28.7 22.7 25.2 32.3 26.8
Expenditure on social protection in PPS per head of population, 2000
Total 6 155 6 458 7 754 7 025 4 032 3 713 6 748 4 748 5 943 9 235 7 004 7 396 3 675 5 925 7 367 6 048
Expenditure on social protection per head of population at constant prices (Index 1995 = 100)
1995 100 100 100 100 100 100 100 100 100 100 100 100 100 100 100 100
1996 102 102 100 104 105 102 101 101 102 104 100 101 99 102 99 103
1997 103 103 99 103 111 102 102 107 108 107 101 102 105 101 99 105
1998 104 105 100 105 120 104 104 110 108 109 101 104 115 100 101 106
1999 107 107 102 108 132 107 106 117 111 116 102 109 123 100 104 108
2000 109 107 102 108 143 110 107 121 113 118 105 111 127 100 105 114
Social benefits by group of functions (as a percentage of total social benefits) Old age and survivors benefits
1991 44.6 41.8 35.8 42.9 52.9 41.4 42.8 29.6 58.7 47.5 37.3 49.9 40.8 32.8 : 43.7 2000 46.6 44.3 38.1 42.2 49.7 46.2 43.9 25.4 63.2 39.9 42.4 49.1 44.7 35.8 39.6 48.8 Sickness, health care
1991 28.1 26.5 20.0 31.5 24.3 29.1 28.3 33.9 27.9 24.9 28.5 25.9 33.5 26.7 : 25.2 2000 27.3 24.2 20.2 28.4 26.5 29.7 28.9 41.2 25.1 25.4 29.3 24.7 32.0 23.8 27.9 25.5 Disability
1991 7.9 7.4 9.9 6.1 6.2 7.7 6.2 4.5 6.9 13.1 16.5 7.0 15.1 15.3 : 9.3
2000 8.1 9.3 12.0 7.8 4.8 7.8 5.9 5.3 6.0 13.4 11.8 8.4 12.7 13.9 12.2 9.4 Unemployment
1991 8.6 13.4 16.0 8.7 4.8 19.4 8.9 15.7 2.8 2.6 8.3 5.1 3.4 8.8 : 7.4
2000 6.3 11.7 10.5 8.4 6.2 12.1 7.1 9.7 1.7 3.2 5.1 5.0 3.7 10.5 6.5 3.0
Family and children
1991 7.8 8.9 11.7 8.4 8.2 1.5 10.0 11.3 3.6 10.7 5.4 10.3 6.7 13.3 : 8.6
2000 8.1 9.0 13.1 10.5 7.4 2.5 9.7 13.0 3.8 16.6 4.6 10.8 5.4 12.5 9.3 6.9 Housing and social exclusion n.e.c.
1991 3.0 2.0 6.5 2.4 3.5 0.9 3.8 5.0 0.1 1.2 3.9 1.7 0.5 3.1 : 5.9