C E
P S
CENTRE FOR EUROPEAN POLICY STUDIES
Place du Congrès 1 ▪ B-1000 Brussels
Tel: (32.2) 229.39.11 ▪ Fax: (32.2) 219.41.51 www.ceps.be ▪ [email protected]
Thinking ahead fo
r Europe
Why is there a Productivity Problem
in the EU?
Francesco Daveri
Foreword by
Jørgen Mortensen
Abstract
Magazines and newspapers often refer to or even take for granted the economic decline of the EU, particularly when contrasting the EU data with US data. The first part of this paper poses the question of whether IT – as often alleged – is really the only cause for the EU’s productivity slowdown. The conclusion is that it is not. The non-IT part of the economy has not only contributed to the slowdown but appears to have crucially contributed to the EU-US growth gap as well. There is thus little reason for the EU to target IT-diffusion as an intermediate goal, as implied by the Lisbon strategy. The second part of the paper, after showing that the growth slowdown comes from the reduction of non-IT capital deepening and the lack of acceleration in total factor productivity growth, argues that the slowdown of capital deepening will continue. The scarce resources available for enhancing growth should concentrate on providing incentives to R&D and innovationat large, rather than financing traditional infrastructures. This is at odds with the goals pursued by the EU within the framework of the European Growth Initiative.
Francesco Daveri is at the Università di Parma and IGIER ([email protected]). This paper draws on previous work for a CEPS report on the causes of the productivity slowdown in Europe, conducted on behalf of the European Parliament. Previous drafts of this paper have been presented at the LBS Conference “Digital Transformations” and at Carlos III in Madrid (Departamento de Empresa). The author is thankful to Daniel Gros and Juan Jimeno for discussion and very useful comments on previous drafts, and to Federico De Francesco for his dedicated research assistance.
European
Policy Studies
CEPS Working Document
Foreword by Jørgen Mortensen... i
The Lisbon strategy: Main features... i
Towards the Lisbon and Barcelona goals?... ii
Nature and causes of the productivity slowdown in the EU ...iii
Delayed diffusion of IT?... iv
Underdevelopment of IT-producing industries?... iv
Other factors without a direct connection to IT?... iv
Some policy conclusions ... vi
1. Introduction ... 1
2. The productivity slowdown in Europe and the IT revolution ... 3
2.1 The productivity slowdown in Europe ... 3
2.2 The IT revolution ... 5
3. Interpreting the facts on IT and productivity ... 6
3.1 The IT-usage hypothesis ... 7
3.2 The IT-production hypothesis ... 8
3.3 The IT-irrelevance hypothesis... 8
4. A numerical rendition of the proposed explanations ... 9
4.1 The thought experiment ... 9
4.2 The explanatory power of the IT-production view ... 11
4.2.1 Numerical evaluation ... 11
4.2.2 Discussion ... 12
4.2.3 Summing up ... 13
4.3 IT usage versus IT irrelevance ... 13
4.3.1 Recovering the Stiroh and van Ark et al. results... 14
4.3.2 Discussion ... 14
4.3.3 IT irrelevance ... 16
4.3.4 Summing up on IT usage versus IT irrelevance ... 17
4.4 Summing up on the explanations of the productivity slowdown ... 17
5. The nitty-gritty of the EU productivity slowdown... 17
5.1 Manufacturing versus services ... 18
5.2 The EU productivity slowdown: Capital or TFP?... 24
5.2.1 Data ... 24
6. The future prospects of productivity growth in the EU ... 27
6.1 Diminished capital deepening: Temporary or permanent? ... 27
6.2 R&D and productivity growth... 31
6.2.1 A few facts about R&D and patents: The US versus the EU... 31
6.2.2 Why is there a relationship between R&D and productivity growth? ... 32
6.2.3 The evidence on R&D and productivity growth... 33
6.2.4 Summing up on the promise of R&D as a vehicle of higher productivity growth... 34
7. Conclusions: The Sapir Report, the European Growth Initiative and the future of growth in the EU ... 35
| i
The Lisbon strategy: Main features
In March 2000 in Lisbon, EU heads of state and government set the strategic goal of becoming the most competitive and dynamic knowledge-based economy in the world, capable of sustainable economic growth with more and better jobs and greater social cohesion.
In the pursuit of excellence the EU should, according to the Lisbon conclusions, envisage a number of measures facilitating the shift towards an information society, such as stimulating R&D and the creation of small- and medium-sized enterprises (SMEs), taking further measures to complete the internal market and ensuring sustainability of public finance. Further, the EU should modernise the European Social Model by strengthening education and training, develop an active employment policy and modernise social protection.
More precisely, the European Council considered that the overall aim of the strategy should be to raise the employment rate from an average of 61% in 2000 to as close as possible to 70% by 2010, and to increase the number of women in employment from an average of 51% in 2000 to more than 60% in 2010.
As stated in the Lisbon conclusions, if “the measures set out […] are implemented against a sound macro-economic background, an average economic growth rate of around 3% should be a realistic prospect for the coming years” (European Council, 2000).
Since then the European Council has held spring summits specifically focused on evaluating the progress of the EU towards the achievement of the Lisbon goals. Thus, heads of state and government reviewed the progress towards the Lisbon goal at the Barcelona European Council in March 2002. At that Council meeting they agreed that investment in European research and development (R&D) must be increased to 3% of GDP by 2010, with at least two-thirds of the total investment coming from the private sector. This goal should focus the attention of the Commission and member states on the reforms necessary to deliver not only higher but also more productive business investment. To achieve this objective, in its recommendation for the 2002 Broad Economic Policy Guidelines (BEPGs) for the economic policies of the member states and the Community, the Commission called for better incentives for firms to invest in R&D while preserving sound fiscal policies.
In September 2002, the Commission adopted a Communication More research for Europe: Towards 3% of GDP, with recommendations for member states, industry and other stakeholders for achieving the 3% objective. The Brussels European Council in March 2003 reinforced the member states’ commitment to the Barcelona objective, and called for concrete action to attain the 3% target and for strengthening of the European Research and Innovation Area to the benefit of all in the enlarged EU.
In response to a request from the October 2003 European Council, the Commission adopted a Communication on A European Initiative for Growth.1 The Communication provided a ‘roadmap’ for boosting investment in networks and knowledge already outlined in an interim report to the October European Council by:
• moving ahead with the priority Trans-European transport projects requiring an investment of €220 billion by 2020;
1
• accelerating the roll-out of high-speed, broadband communications in all parts of the European Union to meet the target of widespread access and use by 2005; and
• strengthening the EU’s capacity to generate and use knowledge through specific action to boost investment in leading-edge technologies, from the use of hydrogen as a fuel to space technologies and their applications.
Specifically the Communication presented a ‘quick-start programme’ by mobilising around €60 billion to invest in networks, broadband communication and new technology between 2003 and 2010. On the whole, the growth initiative thus seemed to favour the boosting of
fixed investment as the most appropriate way to ‘prime the economic pump’ following, in this approach, the guidelines of conjunctural policies of the 1960s and 1970s.
At the Brussels European Council in March 2004, the Presidency Conclusions stated that in March 2000 the EU had set itself ambitious goals and that four years later, the picture was a mixed one. It argued that considerable progress had been made and reaffirmed that the process and goals remained valid. It also stressed, however, that the pace of reform needed to be significantly stepped up if the 2010 targets were to be achieved. The European Council confirmed its commitment to demonstrating the political will to make this happen.
Towards the Lisbon and Barcelona goals?
The move forward towards the Lisbon and Barcelona goals was rather slow during the first three years of the Lisbon strategy. In fact, after a GDP growth of 2.7% per annum from 1995 to 2000 on average in the EU-15, economic growth slowed down to only 1.7% in 2001 and further to 1.1% and 0.8% in 2002 and 2003 respectively. Total employment, after an increase of 1.4% on average from 1995 to 2000, rose by 1.3% in 2001, but then stagnated in 2002 and rose by only 0.3% in 2003.2 Labour productivity, which had risen by 1.3% on average from 1995 to 2000, rose by only 0.4% in 2001, 05% in 2002 and 0.6% in 2003.
An upturn in activity was manifested during the course of 2004 and both output and employment was expected to show faster expansion in 2004 and 2005. Nevertheless, even taking account of the more optimistic outlook, real GDP for the EU-15 is now estimated to show a rise of only 1.6% per annum between the years 2000 and 2005 on average, with employment up by 0.6% and labour productivity by 0.9% on average over this period.
The dismal growth and productivity performance of EU-15 over the first five years of the span of the Lisbon strategy represents a clear deterioration compared with the preceding five-year period, and also contrasts sharply with that of the United States.
As seen in Table 1, for the EU-15 the rate of growth of GDP on average from 2000 to 2005 is estimated to be more than 1 percentage point below that of the preceding five-year period. This slowdown was attributable partly to a 0.8 percentage-point slowdown of employment growth and partly to a 0.4 percentage-point slowdown of labour productivity growth. Between the two five-year periods, economic growth also slowed down in the US, from 4.1% on average from 1995 to 2000 to only 2.6% on average from 2000 to 2005. Yet, in the US productivity growth actually accelerated from 2.1% per year on average from 1995 to 2000 to 2.3% on average from 2000 to 2005. Growth of employment in the US, on the other hand, is estimated to show a sharp slowdown between the two five-year periods, from 2% to 0.4%. This deterioration of the employment content of economic growth in the US has given rise to
2
some concerns. The shake-out of labour mainly took place, however, in 2001 and 2002 and was followed by a return to faster growth in jobs, albeit with maintained high-productivity advancement.
Table F.1. Growth, employment and productivity in EU, US and Japan, % change over previous average from 1960 to 1990 and for five-year periods
1961-90 1990-95 1995-2000 2000-05
A: GDP in real terms
EU-15 3.4 1.5 2.7 1.6
AC-10 – – 4.1 3.3
EU-25 – – 2.7 1.7
US 3.5 2.5 4.1 2.6
Japan 6.1 1.5 1.4 1.7
B: Labour productivity
EU-15 2.9 1.9 1.3 0.9
AC-10 – – 3.8 3.4
EU-25 – – 1.5 1.2
US 1.5 1.3 2.1 2.3
Japan 5.1 0.8 1.4 2.0
C: Employment (persons occupied)
EU-15 0.4 -0.4 1.4 0.6
AC-10 – – 0.3 0.0
EU-25 – – 1.2 0.5
US 2 1.1 2 0.4
Japan 1 0.8 0 -0.3
Note: AC-10 represents the 10 acceding states to the EU.
Source: European Commission, DG Economic and Financial Affairs, spring 2004 forecasts.
Nevertheless, given the EU’s dismal growth and productivity performance during the first half of the period envisaged by the Lisbon strategy, it is already apparent that only an unlikely GDP growth of around 4.5% per annum during the second five-year period would allow the EU to reach the declared target of 3% growth for the whole ten-year period on average. It is thus already evident in 2004 that the Union is in no position to reach the growth targets adopted in 2000 in Lisbon.
Nature and causes of the productivity slowdown in the EU
In sharp contrast to trends during the period from 1960 to 1990, the EU-15 indeed appears to have entered a period with productivity growth distinctly below that of the US. Evidence presented in this paper suggests that a large part of this slowdown is attributable to a certain increase in the employment content of economic growth and, thus, to a slowdown of the process of capital deepening that characterised economic growth in the major EU countries during the years from 1960 to 1990.
In his paper Daveri examines several possible explanations for the productivity slowdown:
• delayed diffusion and use of information technology (IT) throughout the economy;
• underdevelopment of the IT producing industries; and
Delayed diffusion of IT?
After a detailed examination of productivity growth (here measured as output per hour worked) in different branches of the economy grouped according to the intensity of their use of IT, Daveri concludes that delayed diffusion of IT may account for some 38% of the total growth-gap between the US and the EU in both the first and second halves of the 1990s. Daveri’s estimate is considerably lower than those obtained by Stiroh (2002) and van Ark et al. (2003), essentially as the result of the application of a more narrow definition of IT-using industries. In fact, Daveri excludes a number of traditional industries from this group that feature a below-average IT-capital services share of value added in both the US and the EU. Using this more narrow definition of IT-using industries, Daveri explains 0.65 percentage points of the total difference of 1.8 points between the acceleration of productivity growth of 1.1 points in the US and the slowdown of 0.7 points in the EU. With a broader definition Stiroh and van Ark et al. attributed 1.06 percentage points to this effect.
Underdevelopment of IT-producing industries?
Daveri then examines the alternative hypothesis, defended in a number of earlier studies, that the acceleration of productivity growth in the US was essentially attributable to the boosting of IT-producing industries in general or within the manufacturing industries. Nevertheless, the contribution of IT-producing industries to the productivity acceleration in the US amounts, according to various more recent estimates, to only about one-fifth of the overall acceleration of 1.1 percentage points.
In fact, as underlined by Daveri, in the EU the IT-producing branches during the five-year period from 1995 to 2000 accounted for 0.49 percentage points of a total growth of labour productivity of 1.71% as against a contribution of 0.24 percentage points of a total of 2.28% during the preceding five-year period. Yet in the US, IT producers accounted for 0.68 percentage points of a total rise of 2.25% in the second five-year period or comparatively less than the contribution of 0.43 percentage points to the growth of 1.1% in the first half of the 1990s. As underlined by a number of studies, a statistical bias may be introduced owing to the fact that the US and a few other countries adjust national accounting deflators for estimated quality changes for high-tech products. As stressed by Daveri, however, this effect can explain only a small fraction of the productivity gap between the US and the EU.
Daveri thus firmly refuses the hypothesis that underdevelopment of IT production can explain the productivity slowdown in the EU both in the absolute and as compared with the US.
Other factors without a direct connection to IT?
Digging further into the data, Daveri then examines the more precise nature of the productivity slowdown in the EU. By exploiting data for the four largest EU countries (Germany, France, the UK and the Netherlands – the EU-4) generated by the Groningen Growth and Development Center in the Netherlands and the National Institute for Economic and Social research in the UK, he finds that a slowdown of capital deepening (that is, a slowdown in the increase in fixed capital per person employed or hour worked) explained a large part of the productivity slowdown.
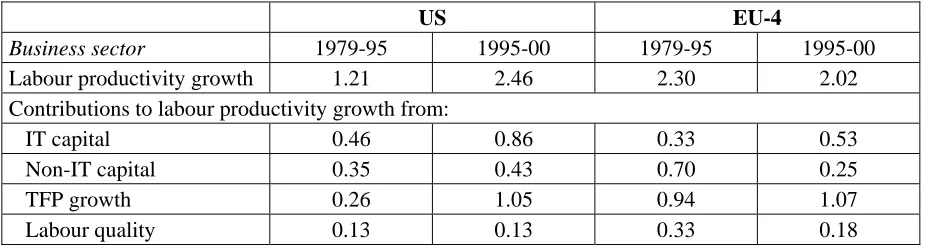
In fact, for these four countries on average, labour productivity growth for the five-year period 1995 to 2000 amounted to just above 2% or about 0.3 percentage points less than on average for the period from 1979 to 1995. During the latter period the increase in the IT capital stock per unit of employment accounted for 0.53 percentage points or more than a quarter of the productivity increase. Non-IT capital in contrast accounted for only 0.25 percentage points or much less than the 0.70 percentage points on average during the preceding 26 years. The contribution of labour quality (an increase in the level of education) also accounted for a small part (and falling) of the total productivity increase.
[image:8.595.70.534.490.614.2]Thus, more than half of the overall productivity increase in the four EU countries during the five years from 1995 to 2000 was attributable to the increase in the ‘residual factor’, generally termed ‘total factor productivity’ (or TFP), that is the part of the rise in labour productivity that is not due to either an increase in capital per unit employed nor the rise in the level of skills of the labour force. The contribution of TFP for these five years in fact amounted to 1.07 percentage points or marginally higher than the 0.94 percentage points on average for the years 1979 to 1995. The productivity increase in the EU moreover compares favourably with the 1.05 points contribution from TFP in the US over the same period. In fact, the remarkable feature about this comparison is not the poor EU productivity performance but rather the pronounced improvement in the US, from only 0.26 percentage points on average during the years 1979 to 1995 to 1.05 percentage points on average from 1995 to 2000 (Table 2).
Table F.2. Decomposing aggregate labour productivity growth, business sector
US EU-4
Business sector 1979-95 1995-00 1979-95 1995-00
Labour productivity growth 1.21 2.46 2.30 2.02
Contributions to labour productivity growth from:
IT capital 0.46 0.86 0.33 0.53
Non-IT capital 0.35 0.43 0.70 0.25
TFP growth 0.26 1.05 0.94 1.07
Labour quality 0.13 0.13 0.33 0.18
Source: Table 11 of the report.
As shown, employment and productivity in 1995-2002 grew at lower rates in the EU-15 than in the US. Nevertheless, in countries often taken as success stories in the European labour markets, such as Spain and the Netherlands, employment grew at more than 2% per year, but labour productivity stagnated. In a country such as Greece, with buoyant productivity growth, employment stagnated instead. The only exceptions on the positive side are Ireland and Finland, with Italy and Germany being the exceptions on the negative side.
There was thus a sharp turnaround in the pace of job creation in Europe after 1995. The growth rate of hours worked went from persistently negative growth rates of hours worked of about half a percentage point per year in the 1980s and almost 1.5 percentage points per year in the early 1990s to positive figures leading to an increase in the number of hours worked by 1% per year in the last few years. This is still slightly lower than in the US (where the growth rate of hours worked remained around 1.5% per year even in the productivity revival years before the current recession), but clearly indicates that the 1980s’ chronic inability of the European economies to create jobs has been partly overcome.
In addition, the new entrants in the labour market, given their low human capital endowment, likely found themselves more easily employed in traditional industries. Hours increased by 2.3% per year in the market services industries in Europe (about the same as in the US). In the manufacturing industries, Europe’s employment performance was less striking, for negative figures were still recorded in 1995-2001, at least for the growth of hours worked in non-durable goods manufacturing. Yet this compares with a negative rate of 2.6% per year in 1990-95 and a negative rate of 1.6% in the 1980s, and should thus be regarded, if anything, as a marked improvement. The same applies to durable manufacturing where the roughly zero-growth in the number of hours worked definitely improves upon the negative rates of zero-growth of 3% or so in the first half of the 1990s and a negative rate of about 1.5% per year throughout the 1980s. Europe’s employment outlook indeed dramatically changed in the last bit of the 1990s.
Some policy conclusions
Altogether, thus, productivity growth in the EU has been somehow hampered by the entry of unskilled workers in the labour market. This has possibly driven down the equilibrium capital-labour ratio. As long as this was simply the other side of the coin of the increased employment rate of the last five years (and possibly of the mismatch induced by the introduction of IT capital goods), the diminished capital deepening may just be transitional. If this is the case, governments should perhaps not be overly pessimistic about Europe’s prospects of reviving labour productivity growth.
This is not the only possible view of the facts, though. A simpler but pessimistic view would instead stress that the declining productivity growth in non-durable (and mature) manufacturing industries signals insufficient reallocation of workers away from that declining sector into newer, more dynamic, industries. This latter view suggests that governments have to do something, namely continue along the undertaken path of market reform in the goods and labour markets, perhaps broadening their scope and enlarging their extent, in order to ease reallocation and raise efficiency.
recommendations formulated in the report of the ‘Sapir Group’ published in the middle of 2003 (Sapir et al., 2003). The Sapir Report has advocated measures in three areas:
• creating an independent European agency for science and research;
• encouraging private sector R&D via tax credits; and
• re-focusing the structure of the – slim – EU budget away from agriculture into separate growth and restructuring funds. The growth fund would be the appropriate pool from which to fund supranational R&D, training and educational projects.
Indeed, as stressed by Daveri, taking advantage and adopting the US technology was best for Europe after the end of WWII. At that time, Europe was distant enough from the technological frontier and thus large enough gains from learning-by-doing, imitating and buying technological advances generated elsewhere – notably in the US – could be achieved.
Yet, as Daveri concludes, 25 or 30 years of convergence have made such mechanisms no longer apt to further feed growth in the now-advanced EU. This makes producing innovations in the EU today all the more necessary. In particular, the goal of producing more innovation would probably be best served by allocating more funds for R&D and improving their efficiency of allocation but, first of all, by stimulating business R&D. Consequently, raising R&D spending towards the goal of 3% adopted in Barcelona would appear to be the most promising route to raising the EU’s innovation potential and productivity growth.
| 1
IN THE
EU?
CEPS
W
ORKING
D
OCUMENT
N
O
.
205/J
ULY
2004
F
RANCESCOD
AVERI1. Introduction
Magazines and newspapers often refer to or even take for granted the economic decline of the EU, in particular when contrasting EU data with US data. It has not always been like this. Until the first part of the 1990s, the EU, while struggling against unemployment, did not really have a productivity problem – quite the opposite. The debate about the productivity slowdown was an American and not a European business issue. Since then, something happened during the 1990s and things changed, quite radically. This paper is a contribution to understanding such important issues by summarising the evidence on the EU productivity problem and contrasting its alternative explanations, with an eye to discussing the ways out of it.
The very first point to address is whether an EU productivity problem really exists at all. From a worldwide perspective, this is not an obvious point to make. As documented in Maddison (2001), Europe1 is an outstandingly productive area with productivity levels not too far from those of the US. Yet, today’s productivity achievements are the outcomes of fast productivity growth in the past. As reported in Table 1, in the EU value added per hour worked has increased at a rate of 3.6% per year in the 1970s, before going down to the – still high – 2.5% per year in the 1980s through the early 1990s. Since then, European productivity growth has declined further to less than 1.5% per year, bottoming down to growth rates not far from zero in 2001-03.
This is enough to claim that today’s productivity data, although not pointing to an absolute decline yet, are really a question mark about the sustainability of current productivity levels (and living standards) in the medium-term future of Europe.
The productivity slowdown in the EU may be seen from another angle, though. The European slowdown has been further enhanced by the parallel productivity acceleration experienced by the US economy since the second half of the 1990s. The real issue here is therefore that Europe has also seemingly lost an opportunity that has been caught by the US instead. The big question is why.
The prevailing common wisdom on the causes of the EU productivity problems comes in three steps. First, the EU growth gap with the US is attributed to a few business sector services, such as wholesale trade, retail trade and financial intermediation. Second, these industries are classified among those intensively using information and communication technologies (IT). Third – implied by the first two – the EU’s productivity problem is said to essentially stem from delayed IT usage. Such a view (labelled the ‘IT-usage hypothesis’) is well exemplified by the following quote from van Ark et al. (2003b):
1
With aggregate evidence showing that countries in Europe invest less in ICT and this new evidence that intensive ICT users have shown slower productivity growth in Europe, it appears that the slower diffusion of ICT is the principal factor in explaining the lower European productivity growth (van Ark et al., 2003b, p. 297)
The view expressed here is also shared by other studies and notably by the detailed cross-country study undertaken by McKinsey Global Institute (1997, 2002). Blanchard (2004), in his recollection of the main facts of European growth, may also be seen as sympathetic with such a view.
As any other one-sided view, this may have gone too far. In the first part of this paper, the total productivity growth gap between the US and the EU is decomposed at the industry level into three components, each representative of a different view of the slowdown. In addition to the IT-usage hypothesis, Gordon’s ‘IT-production’ view and a residual view that might be labelled ‘IT-irrelevance’ hypothesis are scrutinised. The IT-production view points to the importance of high-tech industries as the ultimate engines of the EU-US growth gap. The IT-irrelevance hypothesis posits instead that neither IT usage nor IT production was the eventual cause of the growth gap.
The accounting evaluation of the three alternative views is carried out employing the latest version of the data set constructed at the Groningen Growth and Development Center (GGDC). These data have already served as a background for many papers, the most recent of which are those collected in the O’Mahony and van Ark (2003) Report for the DG Enterprise of the European Commission and the paper by Inklaar, O’Mahony and Timmer (2003). Slightly modified releases of these data have also been used by Jorgenson (2003) and the European Commission (2003).
The industry-growth accounting experiments presented here provide a numerical rendition of the various views. The key result here is that the common wisdom indeed explains a large fraction of the EU-US growth gap, but not as much as assumed by its proponents. The explanatory power of the IT-usage hypothesis in fact crucially hinges on the researcher’s decision on how to classify individual industries in one industry group or another, the alternatives being IT producers, IT users, or non-IT related industries. Previous studies have granted an ‘using’ status to the top 50% industries in an industry ranking based on IT-investment shares in the US economy. It is shown that this classification procedure has
exaggerated the explanatory power of the IT-usage hypothesis. Fast-growing industries, such as retail trade and transportation equipment, have been controversially assigned to the group of the ‘IT-using’ industries. This has in practice occurred at the expense of the explanatory power of the IT-irrelevance view. An alternative classification of industries (which identifies only those industries with above-average IT capital services as IT users) indeed provides a more balanced picture and unveils that the IT-usage hypothesis may explain as much as 55% of the growth gap, with another 45% explained by the IT-irrelevance view. No explanatory power is instead left for growth gaps among IT-producing industries.
The second part of the paper goes one step further in discussing these issues. By using another part of the GGDC dataset (the one developed with the British NIESR), the labour productivity slowdown is decomposed into its capital deepening and total factor productivity (TFP) components. This decomposition is so far available for four EU countries only (Germany, France, the UK and the Netherlands). The bulk of the EU growth slowdown in these four countries is explained by the reduced growth capital-deepening contribution from non-IT goods and a substantial lack of acceleration of TFP growth, with its sheer decline in the non-durable goods industries. This reinforces the idea that IT as such has not been the only cause behind the EU productivity slowdown of the 1990s.
In its final part, this paper asks whether something can be done to reverse the trends of the 1990s (slowdown of non-IT capital deepening and lack of take-off of TFP growth). It is concluded that the capital deepening slowdown may be temporary. This has in fact occurred in parallel with the labour market reforms of the 1990s, which are unlikely to be either further advanced or outright repealed. On the good side, as time goes by, EU economies will have more time to adapt to the diffusion of IT capital, which will cause less disruption to existing non-IT capital. Some room for optimism is there on the capital-deepening side of the EU’s productivity problem. Yet a simple numerical exercise also shows that, if the Lisbon employment goal of raising the EU employment rate to 70% is taken seriously, the expected growth contribution from capital deepening will likely be small.
Optimism is not warranted either for the other policy goal, i.e. improving the EU’s capacity to create and implement innovation. If one judges by actions rather than by the rhetoric of official declarations, it appears that the European Growth Initiative – on the way to being implemented in the future, with its focus on traditional infrastructures – may not conform to the EU’s most urgent needs. Such an initiative does not seemingly take up the thrust of the approach implied by the Sapir Report, where more attention on innovation, research and higher education was advocated as crucial for growth. Unless some change is achieved in these still neglected areas, productivity growth may go back up somewhat, but really higher growth will not be resumed soon in Europe.
The paper’s structure is as follows. In section 2, a brief recap of the main facts on the post-1995 European productivity slowdown and IT diffusion is presented. In section 3, the three main explanations of such slowdown are set out. In section 4, such explanations are quantitatively evaluated within a standard industry-growth accounting framework. In section 5, the nitty-gritty of the European productivity slowdown across manufacturing and services industries is analysed, and the standard decomposition in TFP and capital deepening is computed. In section 6, a discussion of the likely trends of capital deepening and TFP growth, with special emphasis on the promise of R&D spending is presented. In section 7, conclusions and policy implications are drawn within the broader perspective of the Sapir Report and the European Growth Initiative.
2. The productivity slowdown in Europe and the IT revolution2
2.1 The productivity slowdown in Europe
Around 1995,3 something happened in the US economy, which triggered a marked rise in the growth rate of labour productivity (from some 1.1% to 2.2% per year) with respect to the
2
former 25-year average. In parallel, the growth rate of value-added per man hour declined to some 1.5% per year in the European Union. This is about 1 percentage point lower than in 1980-95, one-third as much as the growth rate in the 1970s and a bare one-fourth of the stellar 6% averaged in the same countries in the 1960s.
Table 1. Growth of GDP per hour worked in the EU and the US, 1979-2001
Total economy
OECD 1970-80 1980-90 1990-95 1995-02 (1995-02) minus (1990-95)
European Union 11 3.6 2.3 2.6 1.4 -1.2
US 1.6 1.4 1.2 2.0 +0.8
EU-11 minus US +2.0 +0.9 +1.4 -0.6 -2.0
O’Mahony-van Ark data set 1979-90 1990-95 1995-01 (1995-01) minus (1990-95)
European Union 15 2.3 2.3 1.6 -0.7
US 1.3 1.1 2.2 +1.1
EU-15 minus US +1.0 +1.2 -0.6 -1.8
Big countries
Germany 2.1 2.5 2.0 -0.5
France 3.0 1.6 1.5 -0.1
United Kingdom 1.9 2.9 1.8 -1.1
Italy 2.0 2.4 0.8 -1.6
Spain 2.9 1.7 0.7 -1.0
Small countries
Austria 2.8 4.0 2.4 -1.6
Belgium 3.0 2.5 1.7 -0.8
Denmark 1.9 1.9 1.5 -0.4
Finland 3.3 3.3 2.2 -1.1
Greece 1.0 0.8 3.0 +2.2
Ireland 4.5 4.1 7.3 +3.2
Netherlands 2.3 1.3 1.1 -0.2
Portugal 3.4 2.2 2.5 +0.3
Sweden 1.6 2.1 1.8 -0.3
Source: O’Mahony and van Ark (2003) and the OECD Productivity Database, March 2004.
Table 1 reports the growth rates of value-added per hour worked for the European Union and the United States, as well as the individual EU countries, distinguished in two groups (‘big’ countries and ‘small’ countries), in the 1980s and the first and the second half of the 1990s through 2002. Although hardly a good indicator of labour productivity,4 the behaviour of value-added per hour is a good starting point anyway to concisely describe the extent of today’s productivity problem in the EU, with respect to the US as well as with respect to the EU itself in the past.
3
Why 1995 is so often taken as a watershed in the recent debate about productivity developments in OECD countries remains unclear. Even for the US, the evidence indicating that 1995 was a turning point is not terribly solid. Stiroh (2002) adopted Hansen’s testing methodology of search of unknown breakpoints. This methodology helps single out candidate breakpoints. All of the identified candidate breakpoints turned out to be not statistically significant, except for one: September 1993, significant for the manufacturing sector but not for the economy. No such experiments have been conducted for Europe, except for Daveri and Silva (2004), where conclusions reminiscent of Stiroh’s were reached as to Finland’s productivity time series.
4
The first two lines in Table 1 are from the OECD Productivity Database and show the US productivity acceleration of about 0.8 percentage points and the parallel EU slowdown of about 1.2 percentage points in the last few years. Similar trends can be observed using the O'Mahony-van Ark data set. The discrepancies in the figures reported from the two data sources are because of two main factors: the OECD provides hours worked for 11 EU countries only, while the GGDC has full coverage of the EU-15. Moreover, the OECD data span through 2002, while the GGDC data in the O’Mahony-van Ark CD ROM stop in 2001.
To see what the recent productivity slowdown means in practice, a simple algebraic example may help. Suppose a country, starting from a productivity level of 100, keeps growing at 2.5% per year for ten years. As a result, productivity at t=10 is equal to 128. If the same country grows at 1.5% per year instead, its productivity level at t=10 would be 116. In other words, a growth slowdown of 1 percentage point cumulates into a loss of productivity potential of about 12 percentage points in ten years.
In parallel, Table 1 also provides evidence on two other facts: productivity growth rates have been higher in Europe in the past and are high in some parts of the EU today as well.
The ‘US first, then EU’ ranking is the reverse of the ranking prevailing in 1970-95. In the 1980s, labour productivity in Europe (literally: in any country in Europe, with the exception of Greece) used to grow faster than in the US, then trapped in the infamous productivity slowdown period.
The individual country picture also indicates that the slowdown is mainly but not exclusively a ‘big’ country problem. Germany, the UK, Italy and Spain all exhibit declining growth rates through the 1990s, with sharply declining rates for Italy and Spain. France’s productivity slowdown is instead very mild.
Last but not least, Table 1 also substantiates a few of the European success stories, namely Ireland, Greece and Finland. Through a careful mix of tax-cutting and incentive-providing policies, Ireland took advantage of the outsourcing of manufacturing activities originating abroad in other OECD countries. Finland and Greece respectively based their success on the presence of a world-class technological leader in high-tech manufacturing such as Nokia and the rapid development of business sector services. Although the small size of these countries makes their good or excellent productivity performance not enough to counteract the continental tendency towards the productivity slowdown, their success is very instructive anyway.
Altogether, the historical growth precedents in the EU and the variety of paths towards successful growth signal a simple but very important message: it (i.e. achieving fast productivity growth) can be done. The problem is how.
2.2 The IT revolution
The United States has been experiencing very fast IT diffusion for a long time now. After all, Robert Solow’s famous statement on how ubiquitous computers were in the US economy (except in the productivity statistics) dates back to a 1987 issue of the New York Review of Books – a long time ago indeed.
services reportedly caught up with the US levels in most EU countries by the end of the last decade, this does not seemingly apply for the spending item most directly linked to growth: investment.
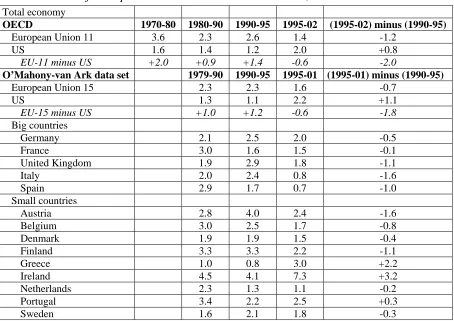
[image:16.595.76.523.359.427.2]As shown in Table 2, investment in IT capital goods kept lagging behind the US during the whole decade. This was initially documented through private data sources by Schreyer (2000) for the G-7 and Daveri (2000) for the EU-15. The private data picture was then, by and large, confirmed by Colecchia and Schreyer (2002) using national accounting data for nine OECD countries. Timmer et al. (2003) – based on the most complete data set available today – gives an updated and rather complete picture of what happened to IT investment in the US and the EU countries. The GDP share of IT investment has been steadily growing over time in the US economy, from 3.3% in 1990 to 4.2% in 2001. Instead, the GDP share of IT investment stagnated in Europe between 1990 and 1995, before the recent rise in the late 1990s. As a result, the EU-US gap, after reaching 2 percentage points of GDP in 1990-95, has stayed constant at 1.6 percentage points of GDP between 1995 and 2001. The evidence in Daveri (2002) and van Ark et al. (2002) is also suggestive that the growth contributions from IT capital goods have been roughly in line with accumulation rates, thus definitely higher in the US than in Europe.5
Table 2. IT investment over GDP in the EU and the US, 1990s
% points
1990 1995 2001 (1995-01)-(1990-95)
US 3.3 3.7 4.2 +0.5
European Union 15 2.2 2.1 2.6 +0.3
US minus EU-15 1.1 1.6 1.6 -
Source: Own calculations from Timmer et al. (2003).
The parallel evidence on IT investment and growth contribution from IT capital concisely exemplifies what is meant by a ‘lag in IT capital accumulation’ of the EU with respect to the US. To sum up, Europe appears to have enjoyed a sort of gentle type of IT revolution, not as pronounced as in the United States, but certainly present and visible in the European aggregate data as well. This was seemingly not enough, though, to counteract the overall tendency for productivity growth in the EU to decline about at the same time when productivity growth accelerated in the US. The issue taken up in sections 3 and 4 is why this was the case.
3. Interpreting the facts on IT and productivity
The EU’s productivity slowdown has attracted the attention of several scholars and magazine commentators. At least three explanations of such productivity slowdown can be put forward and their implications contrasted. Two of them put IT, respectively its usage and production, at the centre stage. There is also a third view pointing to the irrelevance, or the second order importance, of IT as the ultimate engine of productivity growth. In what follows, these are referred to as the IT-usage, IT-production and IT-irrelevance views of the EU productivity slowdown and briefly described in turn.
5
3.1 The IT-usage hypothesis
If there is a common wisdom on the causes of the EU productivity slowdown, it is the IT-usage hypothesis, proposed by Kevin Stiroh and others to explain the US productivity revival and then adapted by van Ark et al. (2003) to account for the US-EU growth gap in labour productivity.
According to this view, the fast pace of IT adoption was at the root of accelerating productivity growth in the United States. This is hard to deny, even at first sight: the spectacular productivity performance of the US economy in the last decade or so has occurred in parallel with the widespread diffusion of IT throughout the economy. The growth accounting studies by Oliner and Sichel (2000) and Jorgenson and Stiroh (2000) – and their updates in Oliner and Sichel (2002), and Jorgenson et al. (2003) – led most experts6 to conclude that the productivity revival in the US was indeed an IT story triggered by both capital deepening and enhanced TFP growth enabled by information technologies for about 80% of its extent.
The evidence based on aggregate data was importantly complemented at the industry level by both labour productivity evidence (Stiroh, 2002, Nordhaus, 2002a, 2002b) and TFP evidence (Triplett and Bosworth, 2002). Stiroh first found evidence that IT-using manufacturing and services industries had prominently contributed to the US productivity revival, showing that, absent their contribution, there would have been no productivity acceleration at all in the US economy. This provided the basis for the IT-usage view that the productivity revival has been mostly driven by the successful adoption of IT, at least in the US economy.
Such ideas have been taken up by Colecchia and Schreyer (2002) and van Ark et al. (2003a, 2003b) to explain the divergent productivity growth paths experienced by the US and the EU as a whole in the 1990s and tested against cross-country data for Europe. As part of a long-standing commitment to produce comparable data for the EU, data for individual EU countries and for the aggregate EU have been cleverly reconstructed on behalf of the European Commission and are now available in a CD ROM format (see O’Mahony and van Ark, 2003). This involved the integration of the sketchy industry data available from the OECD STAN data set with national sources and substantial imputation of sometimes non-existent industry data into a unified accounting framework to be contrasted with the available US data.
The main conclusion in van Ark et al. (2003a), based on an earlier release of such data, is that stagnating productivity in some IT-using business sector services (finance, wholesale and retail trade) is the source of the bulk of the EU-US productivity growth gap in the 1990s. Altogether, in the van Ark et al. paper, the EU-US gap in the post-1995 changes of labour productivity growth is fully accounted for by the (missing) growth contributions of wholesale and retail trade, and, less importantly, the brokers and other financial intermediation industries.
As these industries are identified as intensive IT users – a point to be further discussed below – these findings have been taken to imply that the slower diffusion of IT is the principal (or even the only!) cause of the lowering of productivity growth in Europe. This is clearly reminiscent of the ideas circulated by Stiroh and others with reference to the sources of productivity acceleration in the US economy.
6
3.2 The IT-production hypothesis
In spite of its popularity and wide acceptance nowadays, the IT-usage hypothesis is not the only game in town. Another possible explanation, eventually attributable to Gordon’s (2000, 2003a) papers, is that productivity growth in the information age is driven not so much by the pervasive diffusion of PCs, semiconductors, cellular phones and the Internet among firms, industries and households. Rather, it might be that growth gaps are essentially driven by the presence/absence of a few manufacturing industries or companies with a definite technological lead, such as the high-tech industries producing IT goods. This would attribute overwhelming importance to the fast development or continued fast growth of high-tech industries or firms as the main engine of growth, thereby shifting the emphasis away from the importance of technological diffusion.
Such ideas have not been much explored with OECD data, with the exceptions of the work in van Ark (2001) and Pilat and Lee (2001), where the scattered and often incoherent data available from STAN for a few OECD countries have been used. Altogether, such previous studies have pinpointed that the EU-US growth gap may be partly explained by the lower growth contribution of IT-producing industries. Even with their newly improved data set, van Ark et al. (2003b) provided some evidence not inconsistent with this view for the EU. Yet this finding has been clearly deemed of second-order importance by van Ark et al., when compared to their preferred IT-usage hypothesis described above.
The IT usage versus IT production controversy has also been tested by Daveri and Silva (2004), using a variety of techniques and industry data for the Finnish economy (including information from input-output tables and the price deflators of investment goods). Their findings provide empirical support against the IT-usage hypothesis: IT diffusion has not been seemingly behind the productivity success in Finland. Rather, productivity boomed in the industry where Nokia, the world leader in the production of cellular phones, is and in a few IT-related industries that mostly benefited from the (imported) reduction of the price of machinery and equipment.
3.3 The IT-irrelevance hypothesis
The former subsections have each emphasised a different idea about the way in which IT may have been the driving force underlying the EU-US productivity growth gap. A third option exists: it might simply be the case that something else and not IT has been the driving force underlying the productivity slowdown in the EU in the late 1990s.
Even though, as discussed above, the lower accumulation rates of IT capital in Europe has had a counterpart in terms of lower capital deepening and productivity growth, both in the US and the EU, all sorts of inefficiencies remain hidden in the non-IT manufacturing and services industries. This may have further dragged productivity growth in Europe.
This provides first-hand evidence that only a fraction of the growth gap between the EU and the US is attributable to IT.7 This is apparent and strongly confirmed in the results reported in European Commission (2003).
Such accounting results have been attributed to a more precise content within the OECD Growth Project, undertaken in the second half of the 1990s, which has recently given rise, among other publications, to OECD (2003a). In this study, the role of product and labour market institutions has been explored using the vast array of aggregate, industry and firm-level data that OECD scholars such as Nicoletti and Scarpetta have bravely put together. Extensive evidence that labour and product market regulation are systematically associated with lower aggregate and industry TFP growth in the OECD countries has been presented in Nicoletti and Scarpetta (2003), while OECD (2003a) had firm-level evidence that the scope for more frequent market experimentation, enabled by the market-friendly US institutions, may be associated to higher productivity growth.
The pieces of evidence provided by the OECD may be taken as lending some support to the IT-irrelevance view for one reason. The OECD studies do not describe delayed IT diffusion as the ultimate cause of the EU productivity slowdown, but rather as one of the manifestations of the inappropriateness of EU institutions. Such institutions, by granting excessive protection to the incumbents, may have ended up stifling incentives to both accumulating IT capital as well as to innovation.
A complementary explanation, consistent with the growth accounting evidence for the US and the UK, is proposed by Basu et al. (2003). Starting from an adjustment costs model, they point out that declining TFP growth outside the IT-producing industry is precisely to be expected during times of fast technical change. This is because innovation involves costly restructuring and restructuring takes time. Hence, higher IT investment only causes higher costs with no benefits upfront, and thus may result in lower TFP growth in the non-IT part of the economy.
4. A numerical rendition of the proposed explanations
4.1 The thought experiment
In what follows, the empirical relevance of each of the three hypotheses briefly described above is numerically evaluated against the yardstick of the best available cross-country productivity data, those employed in O’Mahony and van Ark (2003).8 This is not explicitly done in their book, which instead spends considerable effort in providing an unusually rich picture of the disaggregated trends of productivity and its components in Europe.
In their data set, real GDP is computed by double-deflating nominal output and intermediate input data. The prices employed to deflate nominal variables in the high-tech industries (ISIC Code 30-33) are adjusted for quality for the US. Price deflators for European countries are harmonised as in Schreyer (2000), i.e. derived from US deflators corrected for inflation
7
These studies do not really provide clean measures of TFP growth, however. Labour quality is not accounted for. Long enough series of the industry capital stock are not available and therefore industry TFP must be computed under some heroic assumption, such as that of equal TFP growth in Europe as in the US. Work by Inklaar, O’Mahony and Timmer (2003) is under way to construct meaningful measures of industry TFP for the EU-15. For the time being, however, disaggregated TFP measures are only available for 26 industries and four EU countries (Germany, France, the UK and the Netherlands) and the US.
8
differentials. Given the low inflation differentials between the US and most EU countries over the 1990s, this effectively amounts to superimposing a close similarity in the price dynamics of high-tech goods between Europe and the US. To avoid such quality correction translating into an exaggeration of the computed growth rate of overall real value added, real GDP is recalculated through chained weights, i.e. using average weights at time t and t-1 (Törnqvist indices).
Altogether, these features represent definite improvements over any other data set previously employed in this stream of literature, including those made available by the Groningen Growth and Development Centre itself in the past.
The quantitative evaluation exercise in this section runs as follows. First, labour productivity growth (value added per hour worked) for the total economy is calculated for the two areas: the US and the EU-15 aggregate. The concept of the “business sector” employed here is the one borrowed from the OECD, and covers the industries featuring the ISIC Rev. 3 Codes from 1 to 74, except for “real estate activities” (ISIC Rev. 3 Code: 70) in the STAN database. Thus the business sector differs from the total economy for real estate; “non-market services” and “social and personal services” are left out. The reasons to leave such services industries out are diverse. Productivity cannot be meaningfully calculated for non-market services and the bulk of the social and personal services item, as the value added is in most cases computed super-imposing a mark-up on wages and salaries of the employees for these industries. As far as the real estate activities industry is concerned, its exclusion is motivated by the fact that “imputed rent of owner-occupied dwellings” – an item outright unrelated to the business sector – is included with the properly stated business activities in the real estate sector under SNA93 for many countries.9
As a second step, labour productivity growth is decomposed by industry and, in turn, by industry group, on the output side. As a result, Table 3 can be compiled, where labour productivity growth data for the EU-15 and the US are reported over three distinct periods: 1979-90 (the productivity slowdown period), 1990-95 (the period before the US boom) and 1995-2001 (the period of the US productivity revival). The list of IT-producing industries is based on the OECD classification. In the manufacturing sector, it includes “office machinery” (ISIC 30), “insulated wire” (ISIC 313), “electronic valves and tubes” (ISIC 321), “TLC equipment” (ISIC 322), “radio and TV receivers” (ISIC 323) and “scientific instruments” (ISIC 331). In the services sector, it includes “communications” (ISIC 64) and “computer and related activities” (ISIC 72).
Drafting a list of IT-using industries is more controversial, as discussed below. In van Ark et al. (2003a, 2003b), this includes “clothing” (ISIC 18), “printing and publishing” (ISIC 22), “mechanical engineering” (ISIC 29), “other electrical machinery and apparatus not elsewhere classified” (ISIC 31-313), “other instruments” (ISIC 33-331), “building and repairing of ships and boats” (ISIC 351), “aircraft and spacecraft” (ISIC 352), “railroad equipment and transport equipment not elsewhere classified” (ISIC 352+359) and “furniture and manufacturing not classified elsewhere” (ISIC 36-37) in the manufacturing sector. In the same papers, the IT-using services industries are “wholesale trade” (ISIC 51), “retail trade” (ISIC 52), “financial intermediation” (ISIC 65-67), “renting of machinery and equipment” (ISIC 71), “research and development” (ISIC 73) and “legal, technical and advertising business services” (ISIC 741-3).
Bearing the data in Table 3 in mind, one can decompose the growth rates of labour productivity of the business sector in its industry group components, draw numerical
9
implications of the three explanations and evaluate the role of IT usage and IT production in determining productivity developments in the US and Europe. This is done in the next subsections through the end of this section.
Table 3. Labour productivity in the EU and the US: Growth rates and contributions (% points)
EU-15 US
1979-90 1990-95 1995-01 1979-90 1990-95 1995-01
Labour productivity growth, total economy
2.25 2.28 1.71 1.26 1.10 2.25
Contributions to labour productivity growth from:
IT producers 0.34 0.24 0.49 0.26 0.43 0.68
IT producers, manufacturing 0.14 0.03 0.09 0.15 0.26 0.43 IT users (broad definition) 0.71 0.63 0.58 0.44 0.22 1.23 Non-IT industries (broad
definition of IT users)
1.20 1.41 0.64 0.56 0.55 0.34
IT users (narrow definition) 0.58 0.52 0.51 0.23 0.20 0.84 Non-IT industries (narrow
definition of IT users)
1.33 1.53 0.71 0.77 0.47 0.73
Notes: Labour productivity is measured as value added per hour worked. The reported growth rate of labour productivity for the business sector is the sum of the various industry groups’ growth contributions. In turn, each of the industry contributions is the product of the growth rate of labour productivity of each industry times its value added share at the initial time in each sub-period. Hence, the reported growth contributions only include the so-called ‘pure productivity growth’ effect (see Nordhaus, 2002a, 2002b). The list of the IT-using industries is as in van Ark et al. (2003a, 2003b).
Source: Own calculations from O’Mahony and van Ark (2003, pp. 111-113).
4.2 The explanatory power of the IT-production view
4.2.1 Numerical evaluation
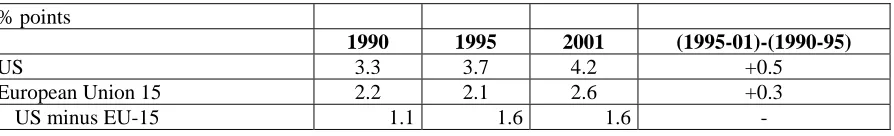
The IT-production view is conveniently numerically evaluated first in its ‘US over time’ and ‘EU versus US’ variants. Using the data in Table 3, one can raise the Gordon question: How much of the total labour productivity gain in the US is accounted for by the change in the growth contribution of IT-producing manufacturing? And, more relevant here, how much of the EU-US growth gap is explained by gaps in the contributions from overall IT production? The figures in Table 4 provide the elements to answer both questions.
Table 4. Evaluating the IT-production hypothesis
Total economy, percentage points
US US-EU
(1995-01) – (1990-95) (1995-01) – (1990-95)
∆(Labour productivity) +1.15 (=2.25-1.10)
+1.72
[=(2.25-1.10)-(1.71-2.28)] ∆(Labour productivity), IT
producers
+.25 (=.68-.43)
+.00
[=(.68-.43)-(.49-.24)] ∆(Labour productivity), IT
producers, manufacturing
+.17 (=.43-.26)
+.11
[=(.43-.26)-(.09-.03)]
[image:21.595.68.533.584.714.2]The US-over-time variant of the IT-production view is verified by computing what fraction of the period change in the growth rate of labour productivity between 1990-95 and 1995-2001 is attributable to IT production. The contribution of the IT-producing industries to the productivity acceleration in the US economy stemming from the pure productivity effect (see Nordhaus, 2002a, 2002b) is about one-fifth of the total labour productivity acceleration in the US economy. The growth contribution of IT production to labour productivity growth rose from 0.43 percentage points in 1990-95 to 0.68 in 1995-2001, hence by about 0.25 points. This is some 21% of the total increase in labour productivity growth of 1.15 percentage points experienced in the US economy in 1995-2001 with respect to 1990-95. Consistent with the Gordon hypothesis, most of this (two-thirds of it) is due to the productivity acceleration in the
manufacturing industries producing IT durable goods.
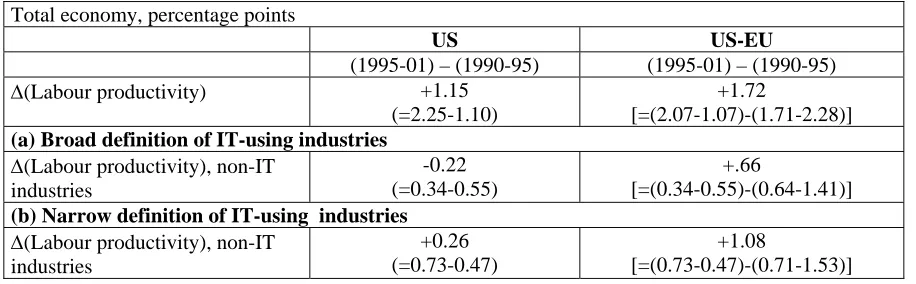
The overall growth contribution from IT producers is instead essentially zero when one comes to explain the EU-US gap. The variables to look at here are the double-differenced ones between the period change in the US variable of interest and the same period variation for the EU-15 variable of interest. This is equal to 1.72 percentage points for the growth rate of labour productivity of the business sector, i.e. the difference between the US acceleration (+1.15 percentage points) and the same period change in the EU (-0.57 percentage points, as a result of the growth slowdown from 2.28% per year in 1990-95 to 1.71% in 1995-2001). In the face of the total of 1.72 percentage points to be explained, IT production accounts for nothing. This is because the growth contributions from IT production went up by the same amount in the US and in the EU (+0.25 percentage points). Interestingly, most of the increased productivity contribution of IT production in European countries was from the industries producing IT services (such as TLC services) and not to the manufacturing ones, as was the case in the US.
Where do such different results come from? The bulk of the result is driven by the marked changes in growth rates over time. The acceleration to double-digit growth rates of labour productivity in high-tech industries, according to the data set employed here, was a worldwide phenomenon and occurred in both the US and the EU-15. Hence this acceleration effect, although more pronounced in the United States, does not account for a sizable share of the
cross-country US-EU growth gap, but only for a tiny part of it. At the same time, however, it was a non-negligible part of the US productivity acceleration over time. This closely replicates previous findings, in particular in van Ark et al. (2003a).10
4.2.2 Discussion
A qualifier to these conclusions is warranted here, though. As recalled above in section 4.1, the national accounting price deflators for high-tech goods are not adjusted for quality changes outside the US and a handful of other OECD countries, including France, but not Germany, the UK, Italy and Spain. Therefore, the currently available national accounting data, such as those currently embodied in the OECD STAN database, do not systematically reflect such quality matters. This has driven the GGDC researchers to construct alternative price deflators for high-tech goods from Schreyer’s (2000) ‘harmonisation assumption’ (see section 4.1). In turn, this amounted to assuming that the dynamics of the prices of high-tech goods in Europe is essentially driven by the dynamics of US prices, except for an overall inflation correction. This correction is usually of a smaller order of magnitude compared to the quality improvement component.
10
In their papers, the GGDC scholars repeatedly reported that such a correction does not make a big difference for the behaviour of aggregate productivity. Indeed, the aggregate price deflator, when recomputed using the quality-adjusted prices of high-tech goods, is only marginally different from the published figures. Yet this does not necessarily apply to the subset of high-tech industries, whose estimated productivity growth may be raised substantially by this correction. To learn about the order of magnitude of this possible bias, it is instructive to take a look at Table 5 where the productivity growth rates of the computer industry (ISIC Rev. 3 Code: 30 in STAN) in Germany and France are reported. Such growth rates are calculated using two data sets (the OECD STAN and the O’Mahony-van Ark data set). Not only are the computed growth rates sharply different in the two cases, but also the direction of the acceleration may not be the same across data sets (see data for France). Given a value added share of about 0.35 in both countries, the high-tech contribution to accelerating growth estimated through STAN data amounts to 0.01 percentage points for Germany and negative 0.02 percentage points for France. These are very small figures indeed. It instead adds up to much bigger figures (0.15 for Germany and about 0.07 for France) when the GGDC data are employed.
Table 5. Comparing labour productivity growth in the computer industries from different data sets
Value added per employed person, percentage points
O’Mahony-van Ark STAN
Office machinery et al. (ISIC Rev. 3 Code: 30) Germany
1991-95 31.7 11.1
1995-00 75.2 15.2
1995-00 minus 1991-95 +43.5 +4.1
France
1991-95 29.0 28.7
1995-00 48.6 21.4
1995-00 minus 1991-95 +19.4 -7.3
Source: Own calculations from O’Mahony and van Ark (2003) and STAN.
In conclusion, it may be that at last a fraction of the worldwide common trend in high-tech industries, as documented in section 4.1, is in fact an artefact of the harmonisation assumption employed to compute price deflators for the high-tech industries. Being less conjectural is hard for the time being. The O'Mahony-van Ark (2003) data set is in fact the result of an impressive effort of data collection, also inclusive of substantial data filling, in particular for smaller sub-industries. In most cases, this prevents pair-wise data comparisons from different data sources.
4.2.3 Summing up
The IT-production view does not strike one as a promising explanation of the EU-US growth gap. This result is clearly affected by the treatment of IT goods prices, though, in a direction still hard to assess with the currently available information.
4.3 IT usage versus IT irrelevance
4.3.1 Recovering the Stiroh and van Ark et al. results
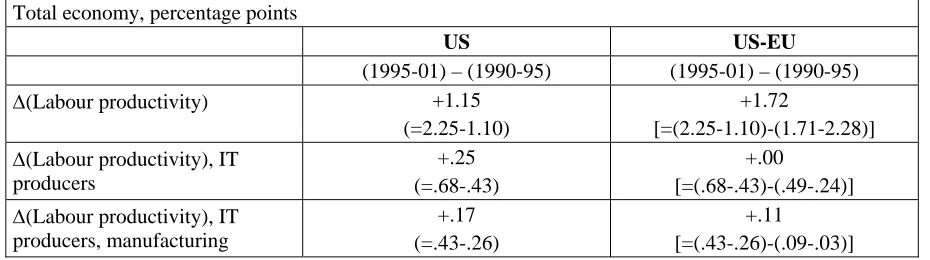
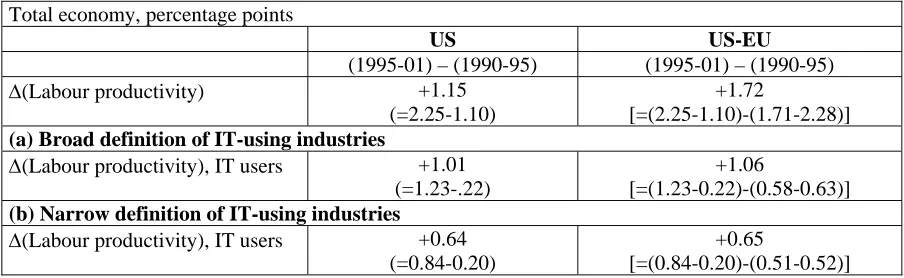
[image:24.595.69.526.235.376.2]The quantitative importance of the IT usage view can be recovered from the data reported in Table 6. Its US-over-time variant (how much of the total productivity gain in the US over time is explained by IT usage?) is verified by computing what fraction of the period change in the growth rate of labour productivity between 1990-95 and 1995-2001 is attributable to IT usage. On the output side, the increased growth contribution from IT users is 1.01 percentage points (from 0.22% in 1990-95 to 1.23% in 1995-01), over 87% of the total productivity increase. This is clearly reminiscent of Stiroh’s (2002) result.
Table 6. Evaluating the IT-usage hypothesis
Total economy, percentage points
US US-EU
(1995-01) – (1990-95) (1995-01) – (1990-95)
∆(Labour productivity) +1.15 (=2.25-1.10)
+1.72
[=(2.25-1.10)-(1.71-2.28)]
(a) Broad definition of IT-using industries
∆(Labour productivity), IT users +1.01 (=1.23-.22)
+1.06
[=(1.23-0.22)-(0.58-0.63)]
(b) Narrow definition of IT-using industries
∆(Labour productivity), IT users +0.64 (=0.84-0.20)
+0.65
[=(0.84-0.20)-(0.51-0.52)]
Source: Own calculations from data in Table 3.
How about the EU-versus-US variant of the IT-usage view, according to van Ark et al. (2003a)? This is like asking: How much of the double-differenced productivity gap between the EU and the US11 is explained by IT usage? The answer is: a lot, as reported in the rightmost part of Table 6 – the growth contribution from IT-using industries is about 1.05 percentage points, some 60% of the total.
Hence, irrespective of whether one looks at the US over time or at the EU-US change-in-growth gap, there is a strong sense that the IT-usage hypothesis first-hand accurately explains most of what it is meant to explain, respectively the US productivity revival or the relative productivity slowdown of the EU-15.
4.3.2 Discussion
As mentioned in section 3.1, the IT-usage view crucially rests on the identification of a subset of industries as IT users. Classifying industries according to their IT intensity is a contentious issue, though, for three main reasons:
1) A criterion must be chosen, which may be based on one or more variables. A problem manifests itself here if the industry ranking changes, depending on which variable is chosen as a criterion.
2) For any given criterion, a threshold must be chosen so as to separate the group of the IT users from the group of the non-IT users. The problem here is the unavoidable arbitrariness of the chosen threshold.
11
[image:24.595.70.522.236.375.2]3) For any given criterion and threshold, an industry may turn out to be IT-intensive in one country and non-IT-intensive in another country, depending on such things as factor prices and endowments.
In his 2002 paper, Stiroh identified as IT users those industries whose share of IT investment over total investment was in the top 50% ranking. Potentially alternative criteria may be the share of IT capital services in value added and the share of IT capital stock over value added or total capital stock. A potentially alternative threshold might be to label IT users as those industries showing values of the criterion above the average. Van Ark et al. (2003a) nicely raised question 3) above, appropriately reporting national accounting data for the shares of IT investment over total investment for the US, France, Germany, the Netherlands and the UK in one of their Appendix Tables (Table A.2), coming to the conclusion that cross-country differences are not too serious.
The extent to which the IT content classification of industries is an issue is perhaps better appreciated by looking at the implications of adopting an alternative criterion threshold, within the data set currently used here to evaluate the IT-usage hypothesis.
As recognised by Stiroh (2002), the share of IT capital services in value added is possibly a better indicator than the IT investment share, for it identifies as IT-intensive those industries tangibly spending money on IT and being successful in reallocating inputs towards high-tech assets. Inklaar, O’Mahony and Timmer (2003) took up Stiroh’s suggestion and reported the values of IT capital services shares in value added, averaged over 1979-95 and 1995-2000, for 26 industries for the US, an EU-4 aggregate (inclusive of the UK, France, Germany and the Netherlands) and the four individual EU countries (see Tables B.15 and B.16 in their paper). The need to choose an indicator relatively exogenous to the productivity revival suggests that 1995-2000 data should perhaps be left aside. A classification method employed to draw inference about the features of the productivity revival after 1995 should in fact be based on data before the productivity revival has actually started. Hence one is left with the value added shares of IT capital services over 1979-95 as the relevant classification criterion.
Based on such 1979-95 rankings, retail ranks 9th and 10th, respectively in the US and the EU-4, hence well within the 50% threshold chosen by Stiroh (2002). Yet, thinking it through, one may wonder whether such a threshold is a really sensible yardstick. In fact, it turns out that, while the Stiroh criterion classifies retail among the IT-using industries, retail is actually using less IT capital (and therefore generating less IT capital services) than the average
industry in the whole US economy (2.79 compared to 3.37 percentage points). The same applies to the EU-4 (2.10 versus 2.49) and to three (Germany, France, the Netherlands) of the individual EU countries for which data are available. The UK is the only exception where retail trade exhibits above-average IT intensity. This is again contradicted, however, by the IT-intensity data in the careful study of Basu et al. (2003, Table 10), where the 1990 value-added shares of IT goods in the retail trade are reportedly lower than the average of the UK economy for all the IT goods, as well as for computers and software, although not so for communication equipment.
Hence, depending on the specific threshold chosen, a crucial industry such as retail – accounting for the bulk of the productivity gains for Stiroh (2002) and one of the three explaining the bulk of the EU-US productivity growth gap – may no longer be classified among the IT users and be assigned instead to the group of the non-IT industries.