Int. J. Electrochem. Sci., 10 (2015) 1065 - 1080
International Journal of
ELECTROCHEMICAL
SCIENCE
www.electrochemsci.org
Quick and Simple Formation of Charge Transfer Complexes of
Brain and Nerves Phenytoin Drug with Different π–acceptors:
Chemical and Biological Studies
Omar B. Ibrahim1,*, M.M. AL-Majthoub1, Mahmoud A. Mohamed1,2, Abdel Majid A. Adam1, Moamen S. Refat1,3
1
Department of Chemistry, Faculty of Science, Taif University, 888 Taif, Kingdom Saudi Arabia 2
Department of Biochemistry, Faculty of Agriculture, Cairo University, Giza, Egypt 3
Department of Chemistry, Faculty of Science, Port Said, Port Said University, Egypt *
E-mail: omarstar1958@yahoo.com
Received: 2 October 2014 / Accepted: 20 November 2014 / Published: 16 December 2014
Charge transfer complexes formed from the chemical reactions between phenytoin drug (phen) as a n-electron donor and π-acceptors like 2,6-dichloroquinone-4-chloroimide (DCQ), 2,6-dibromoquinone-4-chloroimide (DBQ) and N-bromosuccinimide (NBS) were spectrophotometrically discussed and synthesized in solid form. Spectroscopic and physical data such as formation constant (KCT), molar extinction coefficient (εCT), standard free energy (∆Go), oscillator strength (ƒ), transition dipole moment (μ), resonance energy (RN) and ionization potential (Ip) were estimated in methanol at 25 oC. Upon the elemental analysis and photometric titrations the CT-complexes were formed indicated the formation of 1:2 charge-transfer complexes. The charge-transfer interactions were interpretative according to the formation of dative ion pairs [phen · +, A· –], where A is acceptor. All of the resulting charge transfer complexes were isolated in solid colored form and the complexes were discussed using infrared andproton NMR spectra. The surface morphology of the three phen complexes was scanned by scanning electron microscopy (SEM). In addition, the forned synthesized complexes was tested for antibacterial and antifungal activities against different strains of microorganism by disc diffusion method. The different antimicrobial activities depend on sanitized chemical structure and microorganism strains were recorded.
Keywords: Phenytoin; charge transfer complexes; DCQ; DBQ; NBS. 1. INTRODUCTION
Additionally, phenytoin is a class 1b antiarrhythmic that can be used to treat cardiac arrhythmias when conventional options have failed or after cardiac glycoside intoxication [2].Charge-transfer complexes are known to take part in many chemical reactions like addition, substitution and condensation [3, 4]. These complexes have great attention for non-linear optical materials and electrical conductivities [5-8]. Electron donor-acceptor CT- interaction is also important in the field of drug-receptor binding mechanism [9], in solar energy storage [10] and in surface chemistry [11] as well as in many biological fields [12].
O NH
HN O
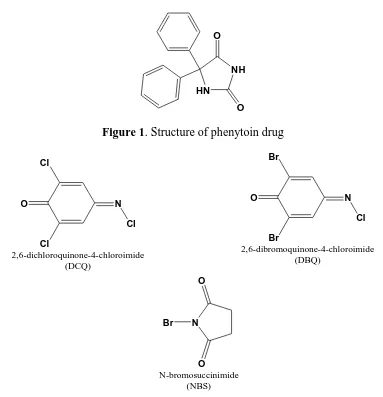
[image:2.596.105.488.205.602.2]Figure 1. Structure of phenytoin drug
O N
Cl
Cl Cl
2,6-dichloroquinone-4-chloroimide (DCQ)
O N
Cl
Br Br
2,6-dibromoquinone-4-chloroimide (DBQ)
O
O N Br
N-bromosuccinimide (NBS)
Figure 2. Structures of 2,6-dichloroquinone-4-chloroimide (DCQ), 2,6-dibromoquinone-4-chloroimide (DBQ) and N-bromosuccinimide (NBS) as π-acceptors
applications as analytical reagents that, they have been used for the spectrophotometric determination of many drugs in pharmaceutical formulations [20-26]. In view of our knowledge, no wide spectroscopic studies have been performed for the interactions between phenytoin drug and different classes of π–acceptors. Uponuiriasd the advantage of electronic spectroscopy technique in terms of simple, low cost, popular and fast properties, this paper describes, the spectrophotometric determination of phenytoin based on the charge transfer interaction between π–acceptors (Fig. 2) and the sp3 nitrogen atom of secondary amine group of phen as a good n-electron donor to form charge-transfer complexes. Also, no biological studies have been focused on synthesized compounds im present study as antibacterial or antifungal. Inhibition growth zone diameter (mm) against gram positive; gram negative bacteria and different fungal strains were recorded by agar well diffusion method.
2. EXPERIMENTAL
2.1. Materials
Phenytoin was received from Egyptian International Pharmaceutical Industries Company EIPICO. The 2,6-dichloroquinone-4-chloroimide (DCQ), 2,6-dibromoquinone-4-chloroimide (DBQ) and N-bromosuccinimide (NBS) were obtained from Aldrich and Fluka Chemical Companies. All chemicals are analytical grade and used without further purification.
2.2. Synthesis of solid phenytoin sodium charge transfer complexes
Three solid phenytoin charge transfer complexes were synthesized as a dark brown, brown, pale yellow colors for the DBQ, DCQ and NBS complexes, respectively, by mixing a (1 mmol, 0.253 gm) of phenytoin drug in 30 mL methanol to 1 mmol of each acceptors in 20 mL methanol solvent. All mixtures were stirred for 45 min at room temperature and the solid products were filtered off, washed with minimum amounts of chloroform and dried under vacuum over anhydrous CaCl2.
i.[(phen)(DCQ)2]
Mol. Wt. = 673.16; Calcd: %C, 48.17; %H, 2.40; %N, 8.32, Found: %C, 48.11; %H, 2.31; %N, 8.21.
ii.[(phen)(DBQ)2]
Mol. Wt. = 850.96; Calcd: %C, 38.11; %H, 1.90; %N, 6.58, Found: %C, 38.03; %H, 1.85; %N, 6.50.
iii.[(phen·+)(NBS·−)2]
2.3. Physical and analytical measurements
The elemental analyses of carbon, hydrogen and nitrogen contents were performed using a Perkin Elmer CHN 2400. The molar conductivities of freshly prepared 1.0×10⁻³ mol/cm3 dimethylsulfoxide (DMSO) solutions were measured for the dissolved phenytoin charge transfer complexes using Jenway 4010 conductivity meter. The electronic absorption spectra of the resulted charge transfer complexes were recorded in methanolwithin 900-200 nm range using a Perkin-Elmer Precisely Lambda 25 UV/Vis double beam Spectrometer fitted with a quartz cell of 1.0 cm path length. Infrared spectra within the range of 4000-400 cm-1 for the free reactants and the resulted charge transfer complexes were recorded from KBr discs using a Shimadzu FT-IR Spectrometer with 30 scans and 2cm-1 resolution. 1H-NMR was recorded as DMSO solutions on a Bruker 600 MHz spectrometer using TMS as the internal standard. Scanning electron microscopy (SEM) images were taken in Joel JSM-6390 equipment with an accelerating voltage of 20 KV.
3. RESULTS AND DISCUSSIONS
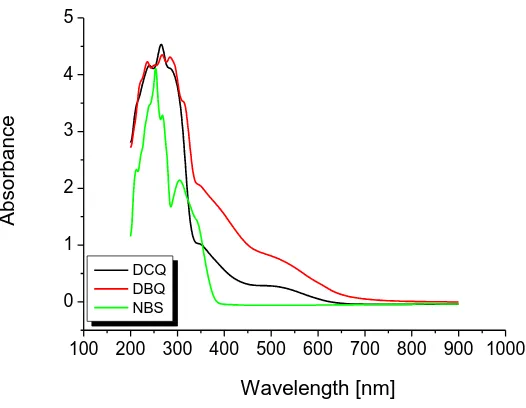
Solid samples of the 1:2 charge transfer complexes of phen were prepared by mixing 50 mL methanol solutions of phen (1.0 mM) and either (DCQ, DBQ and NBS) acceptor (2.0 mM). The percentage of each essential element of carbon, hydrogen, and nitrogen for the resulted phenytoin charge transfer complexes are agreement with the photometric titration ratios. The electronic spectra of charge transfer systems of phenytoin donor with the different π-acceptors (DCQ, DBQ and NBS) were scanned and introduced in Fig. 3.
100 200 300 400 500 600 700 800 900 1000 0
1 2 3 4 5
Ab
so
rb
a
n
ce
Wavelength [nm]
[image:4.596.168.431.472.676.2]DCQ DBQ NBS
Figure 3. Electronic spectra of phenytoin donor with DCQ, DBQ and NBS charge transfer systems.
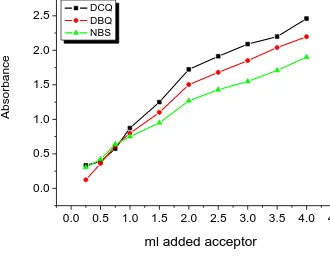
Spectrophotometric titrations at 522, 545 and 306 nm were performed for the reactions of phen with DCQ, DBQ and NBS, respectively, using the Jenway 6405 spectrophotometer as follows: A 0.25, 0.50, 0.75, 1.00, 1.50, 2.00, 2.50, 3.00, 3.50 and 4.00 mL aliquot of a standard solution (5.010-4
the appropriate acceptors (DCQ, DBQ and NBS) in methanol was added to 1.00 mL of 5.010-4 M phenytoin also in methanol. The total volume of the mixture was 5 mL. The concentration of phen (Cod) in the reaction mixture was thus fixed at 1.010-4 M while the concentration of π-acceptors (Coa) varied from 0.2510-4 M to 4.0010-4
M. These concentrations produce [donor]: [acceptor] ratios from 4:1 to 1:4. The absorbance of each charge transfer complexes was measured and plotted (Fig. 4) as a function with the ratio of (Cod): (Cod) according to a known method [27]. It was of interest to observe that the solvent has a pronounced effect on the spectral intensities of the formed charge transfer complexes. To study this solvent effect in a quantitative manner, it was necessary to calculate the values of the equilibrium constant, K, the molar absorptivity ε, and the oscillator strength, f, of the phen complexes in the respective solvent. The molar ratio of 1:2 has been represented in equation (1) [28].
o
A o D o A o
D o
A
C
C
C
K
A
C
C
1
1
.
4
2... (1) Where
2
o A
C
andC
Do are the initial concentration of the π-acceptor (DCQ, DBQ and NBS) and donor (phen), respectively, and A is the absorbance of the detected charge transfer bands. The data obtainedC
Do ,2
o A
C
,C
Ao
4
C
Do
C
oA
and (C
oA2.
C
Do )/A in methanol were calculated. By plotting (C
Ao2.
C
Do)/A values vsC
Ao
4
C
Do
C
Ao
, straight lines (Fig. 5) were obtained with a slope of 1/ε and an intercept of 1/Kε.0.0 0.5 1.0 1.5 2.0 2.5 3.0 3.5 4.0 4.5
0.0 0.5 1.0 1.5 2.0 2.5
Abs
orbanc
e
ml added acceptor
[image:5.596.127.457.447.703.2]DCQ DBQ NBS
0 5 10 15 20 25 30 35
0 1 2 3 4 5 6 7 8 9
(
Ca
o2
.C
d
o )/A
*10
-1
2
Cdo (4Cdo+Cao) *10-8
DCQ DBQ NBS
Figure 5. Plot of (
C
oA2.
C
Do)/A values vsC
oA
4
C
Do
C
Ao
for the phenytoin with DCQ, DBQ and NBS charge transfer systems.The physical spectroscopic data like formation constant (KCT), molar extinction coefficient (εCT), standard free energy (∆Go), oscillator strength (ƒ), transition dipole moment (μ), resonance energy (RN) and ionization potential (Ip) were calculated in methanol solvent at 25 oC, and the different acceptors were found to have a pronounced effect towards the interaction with phenytoin drug donor. These calculations can be summarized as follows;
3.1. Oscillator strength
The oscillator strength f was obtained from the approximate formula [29]. f = (4.319 10-9)
max . 1/2 …. (2)
[image:6.596.123.466.86.358.2]
3.2. Transition dipole moment
The transition dipole moment (μ) of the phenytoin drug charge transfer complexes, Table 1, have been calculated from the equ. 3 [32];
μ (Debye) = 0.0958[max 1/2 / max] ½ .….. (3)
where 1/2is the half bandwidth of absorbance, maxand max the extinction coefficient and
wavenumber at maximum absorption peak of the CT complex, respectively. The transition dipole moment is useful for determining if transitions are allowed, that the transition from a bonding π orbital to an antibonding π* orbital is allowed because the integral defining the transition dipole moment is nonzero.
3.3. Ionization potential
The ionization potential (Ip) of the phenytoin charge transfer complexes were calculated using empirical equation derived by Aloisi and Piganatro equ. (4) [33, 34];
Ip (ev) = 5.76 + 1.53×10⁻⁴ νCT ... (4)
Where, νCT is the wavenumber in cm-1 corresponding to the charge transfer band formed from the interaction between donor and acceptor. The electron donating power of a donor molecule is measured by its ionization potential which is the energy required to remove an electron from the highest occupied molecular orbital.
3.4. Energy of the charge-transfer complexes
The energy of the charge-transfer complexes ECT of the phenytoin charge transfer complexes is calculated using the equ. 5[35];
ECT = (hνCT)= 1243.667 / λCT (nm) ……(5)
Where, λCT is the wavelength of the complexation band. The values of ECT are listed in Table 1, which show that the lower the ionization potential of the electron donor, the smaller is the transition energy of the charge transfer band.
3.5. Resonance energy
Determination of resonance energy (RN) [36] theoretically derived from (equ. 6);
εmax = 7.7 × 10⁻⁴ / [hνCT/ [RN] - 3.5 ] …... (6)
3.6. Free energy
The standard free energy changes of complexation (∆Go
) were calculated from the formation constants by the following equ. (7) [37];
∆Go
= - 2.303 RT log KCT …. (7) Where ∆Go
[image:8.596.30.564.256.327.2]is the free energy change of the phenytoin charge transfer complexes (KJ mol-1), R is the gas constant (8.314 J mol-1 K), T is the temperature in Kelvin degrees (273 + oC) and KCT is the formation constant of the complexes (lmol-1) in different solvents at room temperature.
Table 1. Physical spectroscopic data of phenytoin with DCQ, DBQ and NBS charge transfer systems.
Complex max
(nm) ECT
(eV) K (l.mol-1)
max
(l.mol-1.cm-1)
f μ Ip RN ΔG
o
(25oC) Jmol-1
[(phen)(DCQ)2] 522 2.38 19600 497*106 0.21*106 0.21 8.69 0.681 -24490
[(phen)(DBQ)2] 545 2.28 13400 451*106 0.19*106 0.47 8.57 0.652 -23549
[(phen)(NBS)2] 306 4.06 33370 371*106 0.160*106 0.32 10.76 1.16 -31515
The equilibrium constants are strongly dependent on the nature of the used acceptor including the type of electron withdrawing substituents to it such as halo groups. For example, Table 1, the value of equilibrium constant for [(phen)(NBS)2] is highest value than both [(phen)(DCQ)2] and [(phen)(DBQ)2] complexes in methanol solvent. This value is about twice higher than the values of equilibrium constant for the complexes [(phen)(DCQ)2] and [(phen)(DBQ)2], respectively, reflecting the relatively higher electron acceptance ability for NBS. The number of donating atoms available is another important factor that affects the stability of phenytoin complexes. Since in the process of molecular complexation, it is reasonably assumed that the charge density is donated from the donor to acceptor, the increased number of donating atoms in the ring is expected to increase the donor-acceptor interaction in solution. The effective overlapping of donor-acceptor orbitals involves the proper spatial positions of donor and acceptor molecules. This also needs specific conformation of donor. If the conformation of donor in the complexes form differs significantly from, it's most stable conformation in the Free State. During complexation, some energy will consume for the conversion of most stable conformation of free donor to a conformation which is suitable for complex formation. This will act as a destabiliser factor in the whole process. Among the donor studied, phen has the most rigid structure. So, the variation of its conformation involves energy consumption. Based on this property, the observation of least stability for [(phen)(DBQ)2] (Table 1) is not unexpected. The conductance as a function of [Acceptor]/[phen] mole ratios was measured and the results are shown that there is slightly increase of conductance upon acceptor (DCQ, DBQ and NBS) addition thus, it can be concluded that the complexes are completely nonionic structures except for [(phen·+)(NBS·−)2 complex has an ion radical form [17-19].
generally show some shifted upon complexation concerning to the stretching vibrations and intensities of the carbonyl group (acceptor), and N-H (donor) (where X= Cl or Br).
[image:9.596.154.443.122.336.2]4000 3500 3000 2500 2000 1500 1000 500 0 20 40 60 80 100 Tr ansm it tance [% ] Wavenumbers [nm] DCQ DBQ NBS
Figure 6. Infrared spectra of DCQ, DBQ and NBS charge transfer complexes
Table 2. Characteristic infrared frequencies (cm–1) and tentative assignments of DCQ, DBQ, NBS and their phenytoin charge transfer complexes
DCQ DBQ NBS phen [(phen)(acceptor)2] Assignments
(b)
DCQ DBQ NBS
3079 3052 2954 2925 2869 2854
3074 2973
2950 2939 2927 3277 3208 3069 3270 3210 3073 2974 3270 3209 3073 2920 3278 3209 3080 (C-H) (N-H)
1673 1678 1716 1774
1742 1722 1773 1720 1773 1720
1735 (C=O)
1618 1573
1640 1605
-- 1699 1576 1590 1553 (C=C)
1510 1464 1566 1547 1509 1426 1414 1496 1449 1591 1446 1408 1491 1453
1491 (CH) deformation
1376 1342 1311 1403 1317 1401 1408 (C-N)
1366 1305 1285 1274 1162 1044 917 898 1301 1270 1143 1013 1002 902 869 1238 1197 1167 1157 1007 965 1287 1242 1198 1118 1106 1032 976 788 1210 1157 1103 1020 906 785 739 1241 1195 1111 1074 1020 906 777 1248 1195 1126 1081 1020 914 777 (C-O) (C-C) (C-X)
[image:9.596.91.507.429.769.2]
A
B
C
[image:10.596.157.426.65.725.2]
The proton NMR spectra of the phenytoin free donor drug phen and their charge transfer complexes of DCQ and NBS (Fig. 7) were recorded in DMSO-d6 and chloroform mixed solvent using tetramethylsilane (TMS) as internal standard. The chemical shifts (δ) of the different types of protons of the ligand phen and their charge transfer complexes are discussed and refereed the essential peaks of phen donor in Fig. 7a.
O HN
NH O
O
O
Cl Cl
N Cl
Cl Cl
N
Cl
O HN
NH O
O
O
Br Br
N Cl
Br Br
N
O HN
NH O
O O
N
Br
O
O N Br
Formula I: Suggested structures of [(phen)(DCQ)2], [(phen)(DBQ)2] and [(phen·+)(NBS·−)2] charge transfer complexes.
In details the chemical shifts of different kinds of protons in phen drug can be justified in Fig. 7a. Both the –NH signals of imidazolidine-2,4-dione moiety for proton in position <A> and <B> (Fig. 7a) found at 11.00 and 9.35 ppm, respectively in the spectrum of the free phenytoin donor is completely downfield in the spectra of both DCQ and NBS complexes, this support the sharing of the two –NH groups of (phen) in charge transfer chelation with aromatic rings and carbonyl groups for DCQ and NBS for acceptors via three types of transitions as n—π*, π—π* and radical anions. In both [(phen)(DCQ)2] and [(phen·+)(NBS·−)2] complexes, the proton NMR spectrum showed signals at (10.80, 9.03, 7.20-7.60) ppm and (10.90, 9.10, 7.20-7.90, 2.4-2.7) ppm are actually shifted lower field due to the intermolecular charge transfer complexes with different transitions via lone pair of electrons on both nitrogen atoms of imidazolidine-2,4-dione ring and the center of accepted groups in the DCQ and NBS acceptors.
Accordingly, the n—π*, π—π* and radical anions between the phen donor and the (DCQ, DBQ and NBS) acceptors can be designed as Formula I.
Microstructure and morphology of the synthesized charge transfer complexes were scanned by electronic microscopy (SEM) and the recorded images are shown in the Fig. 8. The electron micrograph shows that morphology of the different phenytoin charge transfer complexes depend on the acceptor present, due to the different chemical structure of the adducts produced. The uniformity and similarity between the particles forms of synthesized phenytoin charge transfer complexes indicate that the existence of morphological phases of DCQ, DBQ and NBS complexes have a homogeneous matrix. A coral reefs shape (Fig. 8a) is observed in case of the [(phen)(DCQ)2] with the particle size 50 µm. The [(phen)(DBQ)2] charge transfer complex has a different particle sizes like stones (Fig. 8b). A homogeneous phase formation of [(phen)(NBS)2] complex has the rectangular wooden panels morphologies in the form of a dispersed with particle size 20 µm is exhibited in Fig. 8c.
A
B
C
[image:13.596.174.422.66.676.2]
3.7. Biological experiments
Antimicrobial activity of the tested samples was determined using a Kir Bauer disc diffusion method [38]. Briefly, 100 µl of the best bacteria/fungi were grown in 10 mL of fresh media until they reached a count of approximately108 cells/ml for bacteria and 105 cells/ml for fungi. 100 µl of microbial suspension was spread onto agar plates corresponding to the broth in which they were maintained. Isolated colonies of each organism that might be playing a pathogenic role should be selected from primary agar plates and tested for susceptibility by disc diffusion method [39, 40]. National Committee for Clinical Laboratory Standards (NCCLS) recommends Mueller–Hinton agar was used as growing microorganism media. Plates inoculated with filamentous fungi as Aspergillus niger ; Penicillium sp and Candida albicans at 25 ºC for 48hours; Gram (+) bacteria as Bacillus subtilis; Streptococcus pneumoniae and Staphylococcus ureas ; Gram (_) bacteria as E. coli, and Pseudomonas sp they were 35–37 ºC for 24–48 hr. and, then the diameters of the inhibition zones were measured in millimetres [38]. Streptomycin (10 mg) and ketoconazole (10 mg) were used as standard antibacterial and antifungal drug respectively.
Antimicrobial activity of charge transfer complexes formed from the chemical reactions between phenytoin drug (phen) as a n-electron donor and π-acceptors like 2,6-dichloroquinone-4-chloroimide (DCQ), 2,6-dibromoquinone-4-2,6-dichloroquinone-4-chloroimide (DBQ) and N-bromosuccinimide (NBS) and streptomycin (10 mg) and ketoconazole (10 mg) as standard antibacterial and antifungal drugs for comparison were evaluated against different strains of bacteria and fungi. The inhibition zone diameter (mm) was recorded in table 3 and illustrated in figure 9. The formed charge transfer complexes showed effective results towards both gram positive; gram negative bacterial and fungal cultures. The complex [(phen)(DCQ)2] was found to be more effective towards all microorganism strains followed by complex [(phen)(DBQ)2], while the complex [(phen)(NBS)2] found to be less effective against all tested strains The antimicrobial activity is probably derived, through the electrostatic attraction between negative charged cell membrane of microorganism and positive charge in formed complexes. The inhibitory effect on microorganisms tested is effected via two possible mechanisms First, is the electrostatic attraction between the negatively charged cell membrane of the microorganisms and the positively charge and second, is the formation of ‘pits’ in the cell wall of bacteria [41, 42]. Also the
[image:14.596.17.580.617.758.2]results indicated that no zone of inhibition was observed for phenytoin drug (uncharged). Table 3. Inhibition zones in mm of the phen charge transfer complexes at 1mg/mL.
Compound (mg/ml)
Gram Positive Bacteria Gram Negative
Bacteria
antifungal
Bacillus subtilis
Streptococcus pneumoniae
Staphylococcus aureas
E.coli Pseudomonas sp.
Aspergillus niger
Penicillium sp.
Candida albicans
Phen 4 3 3 5 3 3 4 -
[(phen)(DCQ)2] 22 20 24 21 28 20 20 23
[(phen)(DBQ)2] 20 16 20 20 23 17 15 22
[(phen)(NBS)2] 6 7 12 14 14 11 9 11
Streptomycin 18 16 19 22 27 - - -
Figure 9. The effect of different microorganism strains on inhibition zone diameter (mm).
The differences observed in the diameter of zone of inhibition may be due to the difference in the susceptibility of different bacteria to the prepared compounds. The differential sensitivity of different microorganism towards formed complexes possibly depends upon their cell structure, physiology, metabolism and their DNA molecules interaction with the charged compounds [43].
ACKNOWLEDGEMENT
This work was supported by grants from Vice President for Graduate Study and Research, Taif University, Saudi Arabia under project Grants No. 3070-435-1.
References
1. M.A. Rogawski, W. Löscher, Nat. Rev. Neurosci. 5(7) (2004) 553.
2. G.K. McEvoy, "AHFS drug information 2004". American Society of Health-System Pharmacists: 2117–2120.
3. E.M. Kosower, Prog. Phys. Org. Chem. 3 (1965) 81.
4. F.P. Fla, J. Palou, R. Valero, C.D. Hall, P. Speers, JCS Perkin Trans. 2 (1991) 1925. 5. F. Yakuphanoglu, M. Arslan, Opt. Mater. 27 (2004) 29.
6. F. Yakuphanoglu, M. Arslan, Solid State Commun. 132 (2004) 229.
7. F. Yakuphanoglu, M. Arslan, M. Kucukislamoglu, M. Zengin, Sol. Energy 79 (2005) 96. 8. B. Chakraborty, A.S. Mukherjee, B.K. Seal, Spectrochim. Acta A 57 (2001) 223.
11. S.M. Andrade, S.M.B. Costa, R. Pansu, J. Colloid. Interf. Sci. 226 (2000) 260.
12. A.M. Slifkin, Charge-Transfer Interaction of Biomolecules, Academic Press, New York, 1971. 13. F.M. Abou Attia, Farmaco 55 (2000) 659.
14. K. Basavaiah, Farmaco 59 (2004) 315.
15. S.K. Das, G. Krishnamoorthy, S.K. Dofra, Can. J. Chem. 78 (2000) 191. 16. G. Jones, J.A.C. Jimenez, Tetrahedron Lett. 40 (1999) 8551.
17. G. Smith, R.C. Bott, A.D. Rae, A.C. Willis, Aust. J. Chem. 53 (2000) 531. 18. G. Smith, D.E. Lynch, R.C. Bott, Aust. J. Chem. 51(1998) 159.
19. G. Smith, D.E. Lynch, K.A. Byriel, C.H.L. Kennard, J. Chem. Crystallogr. 27 (1997) 307. 20. M.S. Refat, O.B. Ibrahim, H.A. Saad, A.M.A. Adam, J. Mol. Struct., 1064 (2014) 58. 21. H.H. Eldaroti, S.A. Gadir, M.S. Refat, A.M.A. Adam, J. Pharma. Anal., 4(2) (2014) 81. 22. A.A. El-Habeeb, F.A. Al-Saif, M.S. Refat, Spectrochim. Acta Part A, 123 (2014) 455. 23. H.M. Elqudaby, G.G. Mohamed, G.M.G. El-Din, Spectrochim. Acta Part A., 129 (2014) 84. 24. H.H. Eldaroti, S.A. Gadir, M.S. Refat, A.M.A. Adam, Spectrochim. Acta Part A, 115 (2013) 309. 25. A.A. El-Habeeb, F.A. Al-Saif, M.S. Refat, J. Mol. Struct., 1036 (2013) 464.
26. A.A. El-Habeeb, F.A. Al-Saif, M.S. Refat, J. Mol. Struct., 1034 (2013) 1.
27. D.A. Skoog, Principle of Instrumental Analysis, 3rd edn., Saunders College Publishing, New York, USA, 1985, Ch. 7.
28. A. El-Kourashy, Spectrochim. Acta 37A (1981) 399.
29. H. Tsubomura, R. P. Lang, J. Am. Chem. Soc. 86 (1964) 3930.
30. S.M. Teleb, M.S. Refat, Spectrochimica Acta Part A 60(7) (2004) 1579.
31. E.M. Nour, S.M. Teleb, M.A.F. El-Mosallamy, M.S. Refat, South Afr. J. Chem. 56 (2003) 10. 32. R. Rathone, S. V. Lindeman, J. K. Kochi, J. Am. Chem. Soc. 119 (1997) 9393.
33. G. Aloisi, S. Pignataro, J. Chem. Soc. Faraday Trans. 69 (1972) 534.
34. G. Briegleb, Z. Angew. Chem. 72 (1960) 401; G. Briegleb, Z. Angew. Chem. 76 (1964) 326. 35. R. Rathone, S. V. Lindeman, J. K. Kochi, J. Am. Chem. Soc. 119 (1997) 9393.
36. G. Briegleb, J. Czekalla, Z. Physikchem. (Frankfurt) 24 (1960) 237.
37. A.N. Martin, J. Swarbrick, A. Cammarata, Physical Pharmacy, 3rd ed., Lee and Febiger, (Philadelphia, PA 1969) p.344.
38. A.W. Bauer, W.M. Kirby, C. Sherris, M. Turck, Am. J. Clin. Pathol. 45 (1966) 493. 39. National Committee for Clinical Laboratory Standards, Performance, vol. Antimicrobial
Susceptibility of Flavobacteria, 1997.
40. National Committee for Clinical Laboratory Standards, Methods for Dilution Antimicrobial Susceptibility Tests for Bacteria that Grow Aerobically, Approved Standard M7-A3, National Committee for Clinical LaboratoryStandards, Villanova, PA, 1993.
41. B. Salopek-sondi, J. Colloid Interface Sci. 275 (2004) 177–182. 42. S. Shrivastava, D. Dash, J. Nanotechnol. 12 (2009) 240–243.
43. M.R. Bindhu, M. Umadevi. Spectrochimica Acta Part A: Molecular and Biomolecular Spectroscopy 135 (2015) 373–378


![Figure 7 . 1H-NMR spectra of a: standard phenytoin donor, b: [(phen)(DCQ)2] and c: [(phen·+)(NBS·−)2] charge transfer complexes](https://thumb-us.123doks.com/thumbv2/123dok_us/1880546.145360/10.596.157.426.65.725/figure-spectra-standard-phenytoin-donor-charge-transfer-complexes.webp)
![Figure 8 . SEM images of a: [(phen)(DCQ)2], b: [(phen)(DBQ)2] and c: [(phen·+)(NBS·−)2] charge transfer complexes](https://thumb-us.123doks.com/thumbv2/123dok_us/1880546.145360/13.596.174.422.66.676/figure-sem-images-phen-dcq-charge-transfer-complexes.webp)


