Magdalena Dudek
AGH-University of Science and Technology, Faculty of Fuels and Energy, 30-059 Kraków, al. Mickiewicza 30, Poland
*
E-mail: [email protected]
Received: 8 February 2012 / Accepted: 17 March 2012 / Published: 1 April 2012
Both Pechini method (A) and hydrothermal treatment of co-precipitated gels (B) solutions were used to synthesize nanopowders of Ce0.8-xGd0.2SrxO2- for 0<x<0.1 solid solutions. All resulting powders
and sinters were found to be cubic ceria-based solid solutions. The results of hardness, fracture toughness and bending strength measurements are reported for the sintered samples of the CeO2
-SrO-Gd2O3 system. The electrical properties a of ceria-based solid solutions were studied by a.c impedance
spectroscopy in the temperature range 200-700oC. It was found that incorporation of a small amount of cation Sr2+ into solid solution Ce0.8-xGd0.2SrxO2-0<x<0.03 allowed an increase, in the ionic
conductivity of a Ce0.8Gd0.2O2oxide electrolyte. Selected materials from the CeO2-Gd2O3-SrO
system were tested as oxide membranes in solid oxide fuel cells operating in the temperature range 500-800oC. The higher current and power density received from IT-SOFCs with a new electrolyte Ce0.78Gd0.2Sr0.02O2- were recorded and compared to the same IT-SOFC involving Ce0.8Gd0.2O2 as an
electrolyte.
Keywords: solid oxide electrolytes, ceria-based solid solutions, co-doping, solid oxide fuel cell
1. INTRODUCTION
Ceria – based solid solutions with the formula Ce1-xMxO2, M = Gd, Sm, Y and 0.1<x<0.3 are
SOFC or other devices due to high electrical resistance [6,7]. Structural modification of ceria-based solutions by co-doping is one possible way to increase, the ionic oxide conductivity of ceria–based electrolytes in the intermediate temperature range (500-700oC). Materials co-stabilized with Gd2O3 or
Sm2O3 and other trivalent cations such as La3+, Nd3+, Y3+, Bi3+, Nd3+ or divalent cations Ca2+, Mg2+,
Sr2+, depending on chemical composition, have generally improved ionic conductivities, although in some cases a deterioration in ionic conductivity or increased electronic conductivity have been observed [8-12]. The incorportation of co-doped ceria electrolytes into IT-SOFC induced higher power and current densities from this cell compared with the same SOFC utilized as an oxide membrane single doped ceria Ce1-xMxO2, M = Gd, Sm, Y and 0.1<x<0.3 [13-15].
There is growing interest in direct carbon fuel cell technology, which has allowed us to directly convert the chemical energy of carbon fuel into electricity, without burning and the emission of toxic and greenhouse gases. All the work on DCFC fuel cells is aimed at a practical and economically feasible conversion of carbonaceous solids (coal, biomass, municipal solid waste, char, etc.) directly into electric power [16-19].
The present work examines how the preparation conditions of co-doped ceria solid solutions in the CeO2-Gd2O3-SrO system influences the structure and microstructure of the samples and then
electrolytic properties. The practical aim of such results is obtained ceramic oxide electrolyte, which colud be applied in solid oxide fuel cells fed with different types of fuel.
2. EXPERIMENTAL
The starting materials were: Ce(NO3)3⋅6H2O, Gd(NO3)2⋅6H2O (99.9 %), Sr(NO3)2⋅4H2O citric
acid and ethylene glycol (99.9% Aldrich). The reagents were mixed in distilled water in order to prepare pure CeO2, ceria–based solid solutions with the formula Ce0.8-xGd0.2SrxO2-, 0<x<0.1. To
examine how the applied method of powder preparation influences the electrolytic properties of the samples, solutions containing the relevant cations were divided into two parts. The Pechini process was applied as method (A). Citric acid and ethylene glycol were added to the nitrate solutions. The solutions were then evaporated at 70oC to obtain hard gels. They were finally calcined at 900oC for 1h and then rotary-vibratory milled by zirconia grinding media in dry ethanol.
Method (B) involved hydrothermal treatment of co-precipitated ceria–gels under autogeneous water pressure at 240oC for 6h to synthesize of the CeO2-based nanopowders. The same nitrate
solutions as in method A were used as starting materials. A concentrated (4 M) sodium hydroxide solution free of carbonates was applied as the precipitating agent. Common solutions involving Gd3+, Ce4+ or (Gd3+ and Sr2+)cations respectively were introduced in drops into a vigorously stirred NaOH solution to co-precipitate the ceria-based powders. The final pH was carefully adjusted to a value of 9.6-9.7 and the slurry was hydrothermally treated for 4 h at 240°C in the mother NaOH environment under autogeneous water vapour pressure. The powders were washed with a water solution of ammonium nitrate and ammonia at the appropriate pH to completely remove sodium and chloride ions. The powders were also washed with isoprophyl alcohol three times and dried at room temperature.
system with monochromatic Cu Ka radiation. The lattice parameters of the identified phases were
determined using the Rietveld refinement method. The mean crysalline size (dhkl) of the CeO2-based
powders was calculated according to the Scherrer formula. Specific surface areas were measured by mulitpoint nitrogen adsorption at –196oC (Quantachrome Nova 1200). The BET adsorption model was used to calculate particle sizes. Green samples were characterized by pore size distribution measurements (Quantachrome, PoreMaster). Transmission electron microscopy (AEM CM20 Philips) combined with EDS was used to characterize the morphology and chemical composition of the Ce 1-xGd0.2SrxO2-0<x<0.1 solid solution powders.
Scanning electron microscopy (SEM) equipped with an Energy-Disspersive X-ray analyzing system (EDX) was used for the observation of fractures in etched sinters, which were recorded with a FEI NOVA NanoSEM 200 equipped with a BSE detector. The numerical analysis of SEM microphotographs (VisiLog4 program Noesis), taken of the polished and thermally etched surfaces, was applied to measure the microstructural paramters quantitatively. The apparent density of the sintered bodies was measured by the Archimedes method.
Fracture toughness and hardness were masured by Vickers indentiation using Future Tech (Japan) equipment. In the former case, a loading force of 4.90 N and in the latter of 9.81N imposed every 10s was applied. No cracks occurred when the lower load was used. The Palmqvist crack model [20] was used to calculate fracture toughness KIc. The bending strength (Bs) of samples of 4mm x 4mm
x 45mm in size was measured by a three – point method using a distance between support rollers of 40 mm and a loading rate 2 of mmmin-1
. A Zwick/Roell Z150 machine was used. The samples used to determine strength, fracture toughness and hardness were polished with the proper diamond suspension and finally, with colloidal alumina [21, 22].
temperature. For a set of test frequencies, the impedance was measured before and after the acqusting of each spectrum. When the summed relative differences in measured impedance exceeded an assumed tolerance of 1 %, the measurements were repeated. Impedance spectra were analysed by means of the nonlinear least-squares fitting of an equivalent circuit using the computer program Firdravn [24].
The ceria-based samples were tested as solid electrolytes in two kinds of solid oxide fuel cells (SOFC). In the first case, the sintered ceria-based samples (20 mm in diameter, with a thickness of about 1.5 mm) were tested as solid oxide electrolytes in two-chamber solid oxide fuel cells. An anode (50% wt. NiO-20GDC) powder (supplied by Fuel Cell Materials, USA) was mixed with terpineol and ethyl cellulose to form a slurry, subsequently screen-printed on the side of CeO2-based electrolytes as
the anode, which was thermally heated at 1200°C for an hour.
The La0.6Sr0.4Co0.2Fe0.8O2 (LSCF)was selected as a cathode material. The commercial pastes
LSFC, LSCF-10GDC (Fuel Cell Materials, USA) were used as starting components to obtain cathode materials.
The cathode pastes were screen-printed on to the polished surface of CeO2-based electrolytes
and were first heated at 400°C for 2 h to remove organic binders, and then finally heated at 1000°C for 4 h. In this way the complete solid oxide bottom fuel cells for tests were prepared. The following single solid oxide fuel cells were investigated
a) H2|Ni-GDC|20GDC|LSCF-GDC| LSCF|O2
b) H2|Ni-GDC|2Sr20GDC |LSCF-GDC| LSCF|O2
where: (20GDC), Ce0.78Sr0.02Gd0.2O2 (2Sr20GDC) was a 1.5 mm-thick electrolyte,
LSCF-GDC was a composite cathode material composed of LSCF +5mol % Gd2O3 in CeO2.
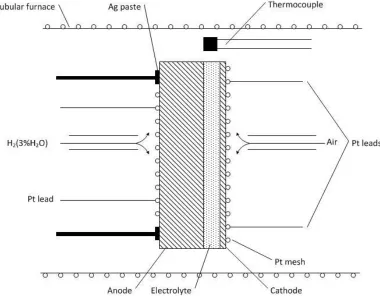
Fig. 1 illustrates the apparatus of a single SOFC cell. Humidified hydrogen (3 % H2O) was
used as a fuel and air as oxidant. The flow rate of hydrogen was about 30 ml·min-1.
In the second case the 20GDC or 2Sr20GDC sintered samples were also tested as electrolytes in a solid oxide fuel cell supplied with a pure carbon fuel.
The direct electrochemical oxidation of carbon was studied using two types of electrochemical cells:
c) C|Ni-GDC|20GDC|LSCF-GDC|LSCF|O2
d) C|Ni-GDC|2Sr20GDC |LSCF-GDC|LSCF|O2
Figure 1. The apparatus for a single test of the SOFC cell
3. RESULTS AND DISCUSSION
Only the cubic CeO2 phase was evaluated by XRD diffraction analysis of all powders and
samples of Ce0.8-xGd0.2SrxO2-, solid soutions.
Table 1. Average crystalline sizes of CeO2-powders determined by XRD method and BET specific
surface area.
Parameter Ce0.8Gd0.2O2
(20GDC)
Ce0.78Gd0.2Sr0.02O2
(2Sr20GDC)
Ce0.75Gd0.2Sr0.05O2
(5Sr20GDC)
Ce0.7Gd0.2Sr0.1O2
(10Sr20GDC) crystalline
size d(hkl), nm
19.8 (A) 6.3 (B)
23.4 (A) 11.2 (B)
26.2 (A) 13.4 (B)
28.4 (A) 14.2 (B) particle size
d(BET), nm
32.6 (A) 9.4 (B)
40.4 (A) 13.6 (B)
50.2 (A) 15.8 (B)
54.2 (A) 18.6 (B)
The properties of CeO2-based powders synthesized by both methods are collected in table 1.
An increase in crystalline sizes was detected in all ceria-solid solutions compared to pure CeO2. In the
case of Ce0.8-xGd0.2SrxO2, where 0<x<0.1 obtained by method A, the differences in particle size
determined by the XRD method d(hkl) or d(BET), which are calculated from surface area measurements.
[image:5.596.49.545.560.649.2]
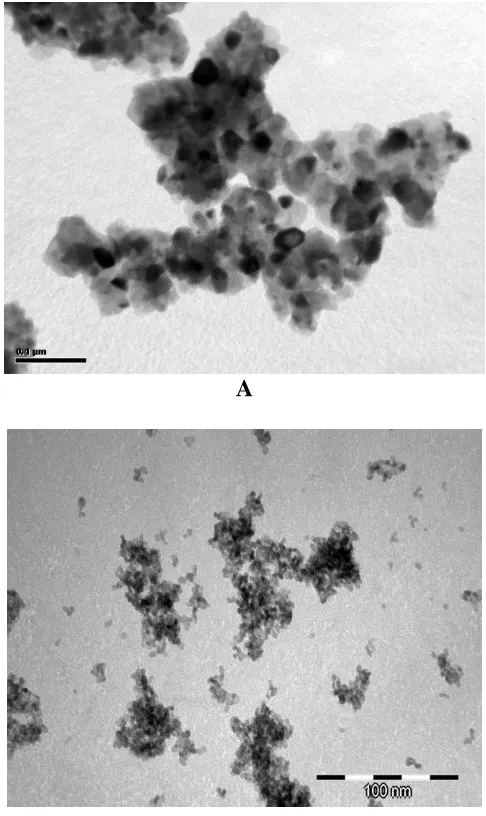
mentioned during TEM observations (Fig. 2 a –b). Similar observations have been recorded for powders in CeO2-M2O3-CaO, M = Gd, Sm solid solutions [26].
A
B
Figure 2. a). TEM microphotograph of the Ce0.78Gd0.2Sr0.02O2grounded powder (method A); b)
TEM microphotograph of the Ce0.78Gd0.2Sr0.02O2 hydrothermally synthesized powder
(method B)
On the other hand CeO2-based powders obtained by hydrothermal methods seem to be mostly
composed of nanoparticles, which are isometric in shape. Among them a few elongated crystallites can also be observed, but there were none of the large needle-shaped particles typical of powders hydrothermally prepared in basic solutions [27]. After further observations of all the powders, no distinct differences in morphology were visible.
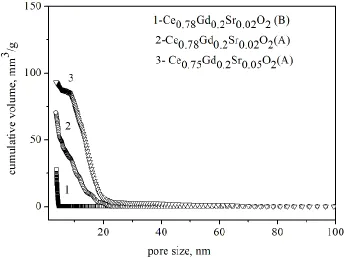
The application of mercury porosimetry allowed a determination of pore sizes (Fig. 3) in green bodies derived from Ce0.78Gd0.2Sr0.02O2- obtained by hydrothermal method (B) or synthesized by the
[image:6.596.176.419.131.539.2]Figure 3. The pore size distribution in the isostatically pressed CeO2-based samples.
In the case of method (B) powders compacted under an isostatic pressure of 200 MPa show an extremely narrow pore size distribution shifted to nanopores of about 6 - 7 nm in size. On the other hand, there were some differencies in samples obtained from powder with the same chemical compositions obtained by powder synthesised by the Pechini process (A). The investigated samples are characterized by pores of below 100 nm. The distribution of pore dimensions seems to be narrow for both samples. However, in the case of the Ce0.75Gd0.2Sr0.05O2- sample there is a certain quantity of
relatively larger pores in the range of 20 -70 nm. Such pores may be formed between agglomerates of powder, while smaller ones occur between powder crystallites. The differences in pore size distributions reflect the microstructure of the samples. All the samples reached more than 96 % of theoretical density.
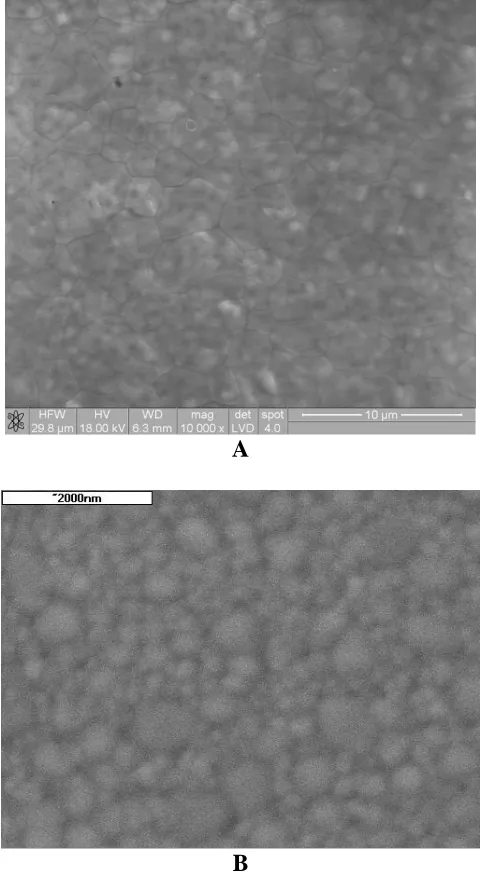
The typical microstructure of samples sintered at 1500oC or 1250oC for 2 h is presented in Fig. 4 a – b. This microstructural analysis allowed us to determine the average grain size distribution for pure CeO2 and Ce0.8-xGd0.2SrxO2 sintered solid solution samples respectively at 1500oC or 1250oC for
2h in air. Fig. 5 presents the variations in average grain size vs. chemical composition of Ce0.8Gd0.2SrxO2 sintered samples.
The microstructural analysis showed that the partial substitution of Ce4+ by Sr2+ into Ce0.8-xGd0.2SrxO2-solid solutions led to a small increase in average grain size compared to the initial
chemical composition of the Ce0.8Gd0.2O2 sample. B.Li, et all [28] also analyzed the microstructral
evolution of the grain sizes of co-doped ceria solid soutions in the MgO-CeO2-Gd2O3 system. They
found that the addition of a small amount of MgO to Ce1-xGdxO2 solid solutions also led to an
A
B
Figure 4. a) The microstructure of a Ce0.78Gd0.2Sr0.02O2 two-hour sintered sample at 1500°C from
powder (method A); b) The microstructure of a Ce0.78Gd0.2Sr0.02O2 two-hour sintered sample
at 1250°C from powder (method B).
The application of hydrothermal synthesis allowed us to obtain Ce0.8-xGd0.2SrxO2
nanopowders in ternary system CeO2-Gd2O3-SrO by lowering the sintering temperature of ceria-based
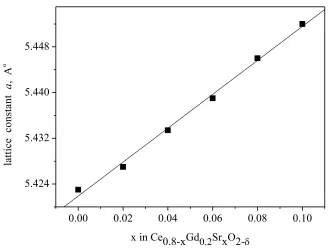
electrolytes from 1500oC to 1250oC. This is a valuable result, which may be preferable to the application of the co-firing process of a single SOFC cell. The changes in lattice parameter a calculated for Ce0.8-xGd0.2SrxO2- solid solution samples are presented in Fig. 6.
The lattice paramter a of Ce1-xGd0.2SrxO2 solid solutions increases linearly with the increase
in x content. This is due to the different ionic radii of Ce4+ (0.96Å) and Sr2+ (1.26Å) and agrees well with literature data [29].
[image:8.596.178.418.71.511.2]0.00 0.02 0.04 0.06 0.08 0.10 0.0
0.5 1.0
method B
av
er
ag
e
x in Ce1-xGd0.2SrxO2
Figure 5. The dependence of an average grain size vs. the chemical composition of ceria –based samples
0.00 0.02 0.04 0.06 0.08 0.10
5.424 5.432 5.440 5.448
la
tt
ic
e
c
on
st
an
t
a
, A
o
x in Ce0.8-xGd0.2SrxO2-
Figure 6. The changes of lattice cell parameter a calculated for Ce0.8-xGd0.2SrxO2-sintered samples
[image:9.596.136.451.122.371.2] [image:9.596.127.457.450.700.2]
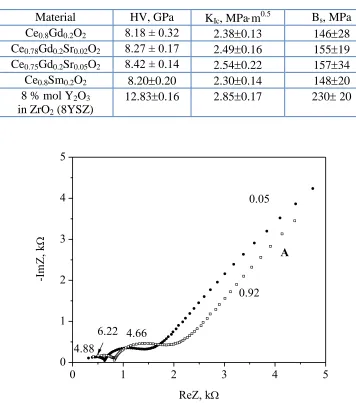
Table 2. Hardness HV, fracture toughness KIc and bending strenght (Bs) of selected CeO2-based
samples
Material HV, GPa KIc, MPam0.5 Bs, MPa
Ce0.8Gd0.2O2 8.18 ± 0.32 2.380.13 14628
Ce0.78Gd0.2Sr0.02O2 8.27 ± 0.17 2.490.16 15519
Ce0.75Gd0.2Sr0.05O2 8.42 ± 0.14 2.540.22 15734
Ce0.8Sm0.2O2 8.200.20 2.300.14 14820
8 % mol Y2O3
in ZrO2 (8YSZ)
12.830.16 2.850.17 230 20
0 1 2 3 4 5
0 1 2 3 4 5
-I
m
Z
, k
ReZ, k
A
4.88
0.05
0.92
4.66 6.22
Figure 7. The impedance spectra recorded at 400°C for a Ce0.78Sr0.02Gd0.2O2 sample (method A and
B).
The determined values of hardness HV or fracture toughness KIc indicate that all these
ceria-based materials exhibited slightly lower values for hardness and toughness compared to 8YSZ. The crack propagation observations for ceria – based samples and 8YSZ electrolyte indicated that cracks developed both along the grain boundaries and across ceria grains in the materials.
The a.c impedance spectroscopy method was applied to determine the electrical properties of singly or co-doped ceria-based samples obtained by the Pechini method (A) as well as hydrothermal treatment (B). The grain and grain boundary resistance arcs for both series of samples are well resolved up to 400oC (Fig.7).
In this case the equivalent circuit (R-CPE)b-(R-CPE)gb-(R-CE)el is used to fit the impedance
data to calculate bulk (Rb) and grain boundary resistance (Rgb). After 400oC the bulk arc is not well
[image:10.596.110.466.103.506.2]1.0 1.2 1.4 1.6 1.8 2.0 2.2 2.4 2.6
-4
-3 5Sr20GDC
1000/T, 1/K
Figure 8. The log (bT) vs. 1000/T determined for Ce0.8Gd0.2O2 (20GDC), Ce0.78Sr0.02Gd0.2O2-
(2Sr20GDC) and Ce0.75Sr0.05Gd0.2O2-Sr20GDC) samples (method A).
The Arrhenius plot of bulk for Ce0.78Gd0.2Sr0.02O2Sr20GDC),
Ce0.75Sr0.05Gd0.2O2Sr20GDC) and Ce0.8Gd0.2O2-GDC) samples is shown (Fig. 8) in log(T)
v.s 1/T coordinated. These results indicate that co-doped ceria Ce0.78Gd0.2Sr0.02O2- exhibit slightly
higher values of bulk conductivity compared to the Ce0.8Gd0.2O2 sample.
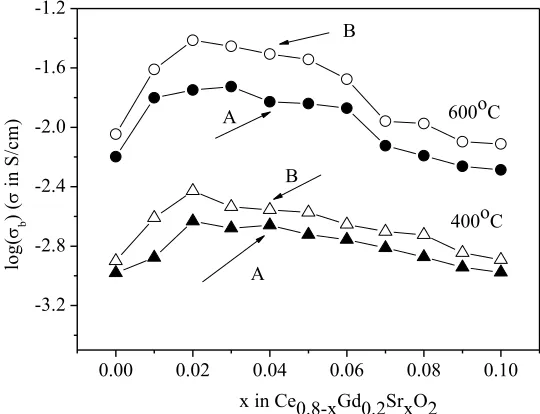
Fig. 9 a – b. show the dependence of the bulk or grain boundary conductivity of Ce0.8-xGd0.2SrxO2- solid solutions vs. strontium concentration. The data was recorded at 400 and
600°C.
0.00 0.02 0.04 0.06 0.08 0.10
-3.2 -2.8 -2.4 -2.0 -1.6 -1.2
B
A 600oC
lo
g(
b
)
(
in
S
/c
m
)
x in Ce0.8-xGd0.2SrxO2 400oC B
[image:11.596.160.427.134.342.2] [image:11.596.156.426.555.762.2]
0.00 0.02 0.04 0.06 0.08 0.10
-3.2 -2.8 -2.4 -2.0 -1.6
600oC
lo
g
(
gb
)
(
gb
in
S
/c
m
)
x in Ce0.8-xGd0.2SrxO2
400oC B
A
B
A
Figure 9. a) Bulk conductivity as a function of composition in Ce0.8-xGd0.2SrxO2 samples
at 400oC and 600°C; b) Grain boundary conductivity as a function of composition in Ce 0.8-xGd0.2SrxO2 samples at 400oC and 600°C.
0.00 0.02 0.04 0.06 0.08 0.10
0.84 0.90 0.96 1.02 1.08
grain bounadry
E
a,
e
V
x in Ce1-xGd0.2SrxO2
[image:12.596.146.437.81.299.2]bulk
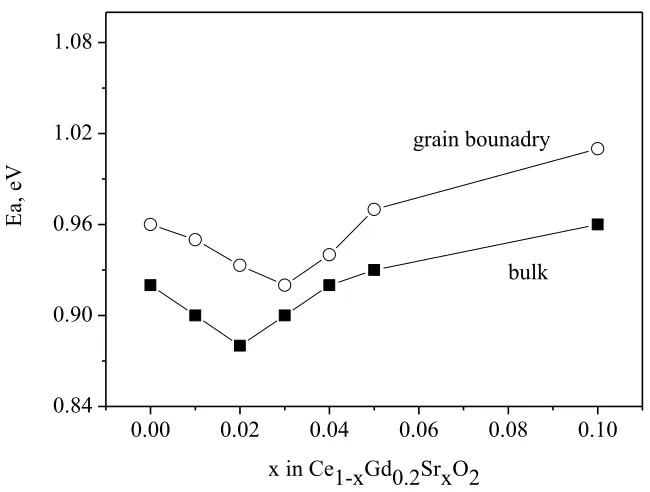
Figure 10. Activation energy of bulk and grain boundary conductivity of Ce0.8-xGd0.2SrxO2 samples
(method A)
[image:12.596.129.454.397.643.2]then lead to the defect clusters, consequently resulting in high binding energy, which is responsible in increase in energy activation [33].
Another problem associated with the final ceramic microstructure is the rather low conductivity of grain boundary (gb), as compared with that of the corresponding bulk. This fact is attributed to the
presence of impurities located in the grain boundary, which lower the ionic mobility. One possible solution, that has been suggested to overcome this is: decreasing grain boundary resistivity by increasing the grain sizes, i.e. lowering the GB density, or the incorporation of a controlled amount of dopants such as CaO, SrO, which could cleanse the GB of non-aequate impurities in Gd2O3 doped
ceria [34,35].
0 200 400 600 800
0.0 0.2 0.4 0.6 0.8 1.0
0 40 80 120 160 200 20GDC
2Sr20GDC
E
,V
I(mA/cm2)
P
(
m
W
/c
m
2 )
Figure 11. The family of P-I curves recorded for (20GDC) and (2Sr20GDC) samples at the temperature of 700°C (cells a, b)
[image:13.596.156.442.438.633.2]
The Ce0.8Gd0.2O2- and Ce0.78Gd0.2Sr0.02O2-samples (method B) were chosen for further
investigations as components of solid oxide fuel cells filled with gaseous hydrogen or solid carbon particles as fuels. Fig. 11. shows the family of overpotential (E) – current denisty (I) recorded for an SOFC with 20GDC (a) and 2Sr20GDC samples as electrolytes at a temperature of 700oC.
The power (P) density as well as current (I) density of an SOFC with Ce0.78Gd0.2Sr0.02O2-
electrolyte reached higher values than the same SOFC, involving the Ce0.8Gd0.2O2electrolyte. This
could be attributed to a decrease in the resistance of the cell. As can be seen, the utilization of solid oxide electrolyte with higher ionic conductivity led to a reduction in ohmic losses during IT-SOFC performance.
An important idea for direct carbon fuel cell technology is to improve the current densities and the power density drawn from this cell. In the case of solid oxide fuel cells filled with carbon powder the most important tested solid electrolyte in DC-SOFC is 8 %Y2O3 in ZrO2 (8YSZ) [37-38]. Our
previous investigations [25] also showed that replacing 8YSZ with an oxide electrolyte with higher ionic conductivity could be one of the possible ways of improving the performance of such cells.
The increase in current density as well as power density of a solid fuel cell filled by carbon vs. temperature is recorded. In DC-SOFC, during the direct carbon conversion, carbon dioxide (CO2) is
produced at the anode, and it can be sequestrated. A competing reaction of the direct carbon conversion: C+O2(g) CO2(g) (1) is the Boudouard reaction C+CO2(g) 2CO(g) (2). At higher
temperatures this reaction is shifted to the right side, so that carbon monoxide (CO) may be produced. This reaction is endothermic, and leads to fuel loss. Thus, to minimize this effect, we have reduced the operating temperature. In the SOFC, conventional material used as a solid oxide electrolyte is exclusively zirconia stabilized by 8% mol Y2O3 (8YSZ) in the temperature range 800–1000°C. In
order to reduce temperature of the operating DC-SOFC down to 700°C, the ceria-based electrolytes should be utilized as oxide membranes in ceramic fuel cells.
0 40 80 120 160
0 5 10 15 20 25 30
35 2Sr 20GDC
20GDC
P
(
m
W
/c
m
2 )
[image:14.596.153.431.510.727.2]I (A/cm2) 8YSZ
application of ceria-based powders prepared by hydrothermal synthesis allowed a reduction in the sintering temperature of ceria-based electrolytes from 1500°C to ca. 1250°C.
It was found that the introduction of strontium into a Ce0.8-xGd0.2SrxO2solid solution leads to
improving of ionic conductivity compared to Ce0.8Gd0.2O2 samples.
A direct comparison of results of ionic conductivity indicated that the better results were achieved for ceria-based samples obtained by hydrothermal method than Pechini process.
The Ce0.78Gd0.2Sr0.02O2 dense samples seem to be more adequate oxide electrolytes than
Ce0.8Gd0.2O2, for application of solid oxide fuel cells filled with gaseous hydrogen or a solid carbon.
ACKNOWLEDGEMENTS
This work was sponsored by the AGH-University of Science and Technology, Faculty of Fuels and Energy.
References
1. H. Inaba, H. Tagawa, Solid State Ionics 83 (1996) 1. 2. S. Kuharuangrong, J. Power Sources 171 (2007) 506. 3. J.W Fergus, J. Power Sources 189 (2006) 30.
4. A.Gondolini, E. Marcadelli, Ceramic International 37 (2011)1423.
5. J.W. Fergus, R.Hui, X.Li, D. P. Wilkinston, J.Zhnag, CRC Press London New York, USA. 6. Y.Zheng, L.Wu, H.Gu, L. Gao, J. Alloys Compd 486 (2009)586.
7. T.Mori, T. Ikegami, H. Yamamura, J. Electroch. Soc. 146 (1999) 4380.
8. M.Dudek, W. Bogusz, Ł. Zych, B. Trybalska, Solid State Ionics 179 (2008) 164. 9. X. Guan, H. Zhou, Y. Wang, J. Zhang, J. Alloys Compd 464 (2008) 310.
10.S. Ohmar, E. Wachsman, J. Nino, Solid State Ionics 178 (2008) 1890.
11.S.Ramesh, V. Kummar, P. Kistaih, C. Reddy, Solid State Ionics 181 (2010) 86. 12.S. Dikmen, J. Alloys Compd 491 (2010) 106.
13.Y. Ji, J.Liu, T. He, J. Wang, W. Su, J. Alloys Compd 389 (2005) 317.
14.J.Cheng, Q. Jiang, H. He, J. Jang, Mat. Chemistry and Physics 125 (2011)704 15.X. Hongmei, Y. Hongge, Ch. Zhenhua, Solid State Science 10 (2008) 1179.
16.S.L.Jain, Y. Nabae, B.Lakeman, K.Pointon, J. Irvine, Solid State Ionics 179 (2008) 1417. 17.G.A. Hackett, J.W. Zondlo, W. Stevensson, J. Power Sources 68 (2007) 111.
19.D. Cao, G. Wang, Ch. Wang, J. Wang, T. Lu, Int J.Hydrog Energ 35 (2010) 1778. 20.K. Niihara, J. Mater. Sci. Lett. 2 (1983) 221.
21.N. Moskała, W.Pyda, J. Eur. Ceram. Soc. 26 (2006) 3845-3851.
22.R. Lach, K. Haberko, M.M. Bućko, M.Szumera, G. Grabowski, J. Eur. Ceram. Soc. 31(2011) 1889-1895.
23.J.R. Dygas, W. Breiter, Electrochim. Acta 41 (1996) 993. 24.J.R. Dygas, W. Breiter, Electrochim. Acta 44 (1999) 4163. 25.M.Dudek, P.Tomczyk, Catal. Today, 176 (2011) 388-392
26.M.Dudek, A.Rapacz-Kmita, M. Mroczkowska, M. Mosiałek, G. Mordarski, Electrochim. Acta 55 (2010) 4387.
27.W.Pyda, Bull. Polish Academy of Sciences. 1999 ( 47) 397. 28.B.Li, W.Pen, J. Power Sources 183(2008) 498.
29.R.P Shannon, T. Prewitt, Acta Crystallog. Sect. B: Struct. Sci 25 (1969) 925. 30.A.F.Orliukas, A. Kezionis, E. Kazakevicius, Solid State Ionics, 176 (2005) 2037. 31.J.A Kilner, Solid State Ionics 129 (2000)13.
32.P.J.Schlichta, Solid State Ionics 28-30 (1988) 480.
33.F. Ye, T. Mori, D.R. Ou, A. N. Cormack, Solid State Ionics 180 (2009)1127.
34.F.Ye, T. Mori, D. R. Ou, M. Takahashi, J. Zou, J.Drennan, J. Electrochem. Soc. 154 (2007) B180. 35.P. Seok, S. B. Lee, D.S. Kim, J. H. Lee, D. Kim, H. Park, Electrochem. Solid-State Lett. 9 (2006)
A399.
36.P. Cho S. Park, J. Kim ,H. Do, Solid State Ionics 181(2010) 1420. 37.Ch. Li, Y.Shi, N.Cai, J. Power Sources 196 (2011)754.
38.J.P Kim, H. Lim, Ch.H. Jeon, Y.J. Chang, K.-N.Koh, S. M. Choi, J. Power Sources 195 (2010) 7568.
39.S. L. Jain, Y. Nabae, B. J. Lakeman, K. D. Pointon, J. T.S. Irvine, Solid State Ionics, 179 (2008) 1417.