GERM LINE POLYSOMY IN
ATRACTOMORPHA
SIMILIS
Gregory Bernard Peters B.Sc.(Hons), A.N.U.
Thesis submitted for the degree of Doctor of Philosophy at the Australian National University
November, 1977
To My Parents
This thesis contains no material which has been accepted for the award of any other degree or diploma in any university and, to the best of my knowledge and belief, it contains no material previously published or written or the result of work by another person, except where due
reference is made in the text.
ACKNOWLEDGEMENTS
I am grateful to my supervisory committee, Dr D,M, Paton, Prof. B. John, Dr G,L.G, Miklos, Dr J. Robbins and Dr J,M, Dearn, for
their guidance during ·the latter half of this project. I am especially indebted to Prof. B, John for suggesting the topic and for his
invaluable assistance during the writing of this thesis.
I also thank Dr O,R, Byrne for his supervision during the early stages of this study. Dr R,N, Nankivell also gave much
assistance and encouragement at that time. To Dr G ,C, Webb I am thankful for assistance in the G- and C-band.ing experiments. Mr M. Adena gave much helpful advice during the early stages in the
construction and implementation of the computer programme used in Chapter Four.
For technical preparation of this thesis I am principally indebted to Mrs T. Raath, who provided patient and cheerful assistance throughout the course of the project. Mr M, Commons and Mr K. Herbert are to be thanked for their skilled preparation of the photographic plates. Other staff members and fellow students of the Botany
Department gave help at various times, and to them I am also grateful.
I thank Ms E, Alfred, Ms B. Britton and Ms K. Su!llm:!rs for much painstaking work in the typing of the thesis.
CHAPTER 1: INTRODUCTION
TABLE OF CONTENTS
Acknowledgements Summary
1.1. The Taxonomy and Distribution of the Genus
Atractomorpha
in Australia1.2. Biological Features of
Atractomorpha
s
imiLi
s
1.3. The Field Surveys: Rationale and Results
1.4. Rationale for the Thesis
CHAPTER 2: THE CHROMOSOMES OF
Atractomorpha
simiLis
2.1. The Basic Karyotype
2.2. Chiasma Frequency Variation
2.2.1. Chiasma Scores
iv ix
1
3
6
12
14
14
20
20 2.2.2. The Relationship of Chiasma Frequency Variation to Other
Karyotypic Variables 23
2.3. Karyotype Variation
2.3.1. Structural Variation
2.3.1.1. Supernumerary Segment Polymorphism 2.3.1.2. Centric Fusion
27
27
27 31
2.3.2. Numerical Variation 33
2.3.2.1. The Polysomic Polymorphism 33
2.3.2.1.1. Inter- and Intra-Individual Variation 33 2.3.2.1.2. Condensation Cycle and Chiasma
Formation in Normal and Polysomic Copies of Autosome 9 36 2.3.2.1.3. Bivalent and Multivalent Formation
Involving Polysomic Chromosomes 40 2.3.2,1.4. Spermatid Micronuclei 41 2.3.2.2. Aneuploidy in the Embryo
2.3.2.3. Numerical Variation caused by a True B Chromosome in
A
.s
imilis
CHAPTER 3: THE GENETIC BASIS OF GERM LINE POLYSOMY
3.1. Introduction
3. 2. The Selective Breeding of Polysomic Individu·als: Technical
45
49
56
56
Considerations 59
3.2.1. Scoring of the Polysomic Character
3.2.2. The Effect of Inbreeding on Hatchability 3.3.1. Materials and Methods
3.3.2. Transmission of Polysomy: The Mechanism as Revealed by Mating of Selected Individuals and Families
59
63 66
68
3. 3. 3. Maternal versus Paternal Transmission of Germ Line Polysomy 79
3.4. The Long-Term Response to Selection for and against Germ Line Polysomy
3.4.1. The First Laboratory Generation and Its Parents 3, 4. 2. The Inter - Follicular Distribution of Extra A9 's
in Go and G1.
83
84
3.4.3.
The Second Laboratory Generation 883.4.4.
The Inter-Follicular Distribution of Extra A9's in G2 923.4.5.
The Third Laboratory Generation 933.4.6.
The Inter-Follicular Distribution of Extra A9's in G3 953.4.7.
The Heritability of Germ Line Polysomy 963.4.8.
Further Aspects of the Response to Selection For andAgainst Germ Line Polysomy 98
CHAPTER 4: THE GENERATION OF INTRA-INDIVIDUAL VARIATION IN CHROMOSOME
NUMBER 103
4.1. The Structure and Components of the Orthopteran Testis 103
4.2.
The Embryogenesis of the Grasshopper Testis 1054.3.
Cellular Mechanisms Resulting in Variable Chromosome Number 1104.4. The Computer Model 113
4.4.1. Aims and Assumptions
4.4.2.
The Mechanics of the Model113
117
4.5.
Comparison of Simulated and Real Chromosome Number Distributions 1244.5.1. Salient Features of the Observed Chromosome Distribution and Their Relevance to the Computer Model 124
4.:i.2.
Execution and Results of Computer Simulation4.6. Conclusions
128
CHAPTER 5: DISCUSSION AND CONCLUSIONS
5.1. The Tranmission of Extra Chromosomes
5.2. The Effect of Various Kinds of Chromatin on the Fitness of the Individual
5.3. The Evolutionary Significance of Extra Chromosomes
APPENDICES
BIBLIOGRAPHY
viii
138
138
150
164
171
ix
SUMMARY
Atractomorpha similis
(Orthoptera, Acridoidea, Pyrgomorphidae)is distributed along the east coast and adjacent tablelands of Australia
from Sydney, N.S.W., to Cape York Peninsula, Queensland. Populations were
sampled from northern N.S.W. to north Queensland and examined cytologically.
Males of the species carry a widespread polymorphism for polysomy of the
megameric Autosome Nine. This polymorphism occurs in most populations
of the species at frequencies as high as 33%. Polysomic males carry
extra chromosomes only in their germ cells, and, within these, the degree
of polysomy always varies between but not within different follicles of
the testis. Up to ten extra copies of Autosome Nine were observed in
a single cell, although the modal frequency, among polysomic individuals
in the field, is one extra copy. Selective laboratory mating of polysomic
males with females from polysomic families resulted in an increase in the
frequency of polysomic males from 24% to 71% after three generations of
selection. Selection against polysomy resulted in the reducing of this
frequency to only 5% after a similar period of selection.
The irregular manner in which this germ line polysomy was
inherited, coupled with cytological observations on the meiotic behaviour
of the extra chromosomes, suggested that factors promoting germ line polysomy,
rather than the extra chromosomes themselves, were transmitted between
generations. Furthermore, computer generation of simulated populations
of cells mosaic for various degrees of polysomy showed that such mosaicism
population initially devoid of any extra chromosomes.
The nature and behaviour of these extra chromosomes is
discussed in relation to the other more commonly occurring types of
dispensable chromatin, namely supernumerary chromosomes and segments,
both of which also occur in
Atractomorpha similis.
Also, the cytogeneticpeculiarities of
A.similis
are contrasted with those of the relatedspecies
Atractomorpha
australis,
with which it was found to be sympatricin one population. It is proposed that the various chromosomal
abnormali-ties found in these species, of which germ line polysomy is the most
common, are most probably maintained in natural populations in order to
fulfil various functional roles for which each has become especially
adapted. These various manifestations of genomic specialisation should
be considered as part of a spectrum of genie control mechanisms, which
ranges in scale from the interaction which one single gene may have
with another to the adaptive effects resulting from multiplication of
the entire genome as occurs during polyploidisation.
1
CHAPTER 1
INTRODUCTION
1.1. The ·Taxonomy and Distribution of the genus
Atractomorpha
in AustraliaUntil 1960, only two Australian species of
Atractomorpha
were recognised. These wereA.australis
(Rehn, 1907) andA
.
crenaticeps
(Blanchard, 1853).
A.similis
(Bolivar, 1884) was regarded as a southern variety ofA.crenaticeps
(Rehn, 1953), the type specimen of which wascollected in New Guinea. In 1960, Bannerjee and Kevan recognised
A.similis
as a separate species on morphological grounds. Subsequently, the rangeof
A.crenaticeps
was reduced to include only New Guinea and some nearby islands (Kevan and Chen, 1969).A.australis
occurs in relatively humid parts of easternVictoria, eastern N.S.W. and southeast Queensland. In the northerly part of its range it commonly lives in the cooler, higher altitudes of the
Great Dividing Range.
A.similis
,
on the other hand, is predominantly tropical and sub-tropical in distribution and ranges from Cape York downthe eastern coasts of Queensland and N.S.W. as far as Sydney. Additionally, some isolated populations are found inland in the Murray-Darling drainage
system of N.S.W., northwest Victoria and south-eastern South Australia. There is also one report of the species in southwest Queensland (Fig.1.1).
Elsewhere,
A.similis
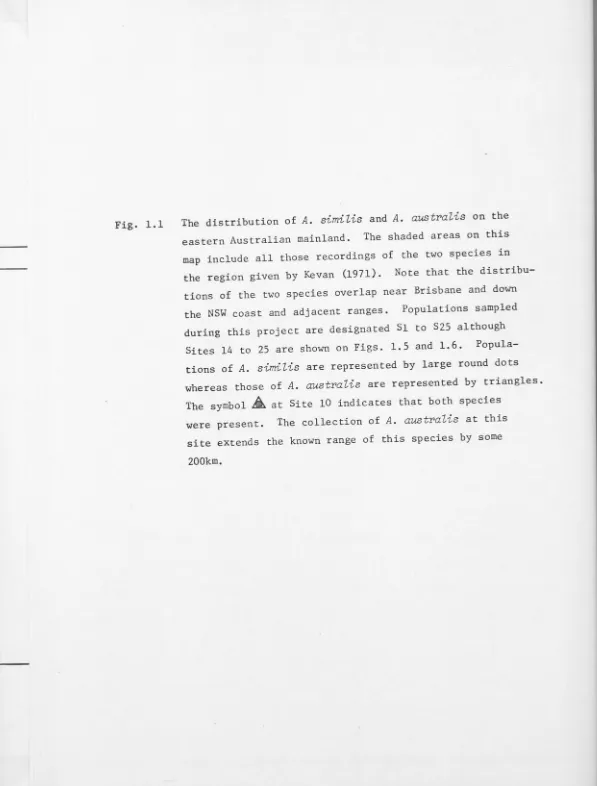
is found in Arnhem Land (NT) and the Kimberley region of Western Australia.Fig. 1.1 The distribution of
A. similis
andA. aUBtralis
on the eastern Australian mainland. The shaded areas on this map include all those recordings of the two species in the region given by Kevan (1971). Note that the distribu-tions of the two species overlap near Brisbane and down the NSW coast and adjacent ranges. Populations sampled during this project are designated Sl to S25 althoughSites 14 to 25 are shown on Figs. 1.5 and 1.6. Popula-tions of
A. similis
are represented by large round dots whereas those ofA. australis
are represented by triangles. The symbol~ at Site 10 indicates that both specieswere present. The collection of
A. aUBtr
a
lis
at this site extends the known range of this species by some [image:12.673.15.612.20.806.2]146° E
QUEENSLAND
Tropic of Capricorn
I
I
I
..
..
.
.
:-'
I
I
I
I
f
:\:
J
A.similis[ \\] A. a us
t
r a Ii s12°S _ __.
See Figs.1.5 and 1.6
I
0
3 6°S
I
200 Kilometres
I
2
occurs only in a very confined habitat along the foot of the scarp
in Arnhem Land. The genus
Atractomorpha
is thus represented in Australia by three species. All three are distinct not only on morphological butalso on cytological grounds (Nankivell, 1976).
A.australis
from southernand central N.S.W. is easily distinguished from
A.similis,
the latter species, especially the females, being more slender (Nankivell, 1976).This distinction is not equally clear throughout the range of the two
species. In some areas where both species are found within a few
kilometres of each other, or together as at Site 10, it is impossible to
differentiate the two on gross external morphology.
A.similis
from Sites5, 10 and 11 could not be distinguished in the field from
A.australis
captured at Sites 6 and 10· (Appendix I, and Fig.1.2). It is quite probable,
however, that an examination of genitalic structure would have made
possible the distinction of the two species.
In the present study, the two species were differentiated by
cytological analysis. At meiosis, the great reduction in chiasma frequency
and increase in number of terminal heterochromatic segments in
A.similis
makes species identification a simple task (see Nankivell, 1976 for a
sunnnary of karyotype differences in the Australasian species of
Atractomorpha)
.
Although
A.australis
andA.similis
overlap in their distribution, nosympatric populations had been found prior to the present study. The
population at Site 10 was found to contain both species. Of nine males
examined, six were identified cytologically as
A.australis
and two asA.similis.
The other one contained no scoreable cells and so could not be identified. This site (Fig.l.3a) is unique in that not only is itthe only place where both species have been recorded living together, but it is also the most northern site of
A.australis.
Kevan (1971) reportsthe northern limit of the species as 20 km northwest of Brisbane, some
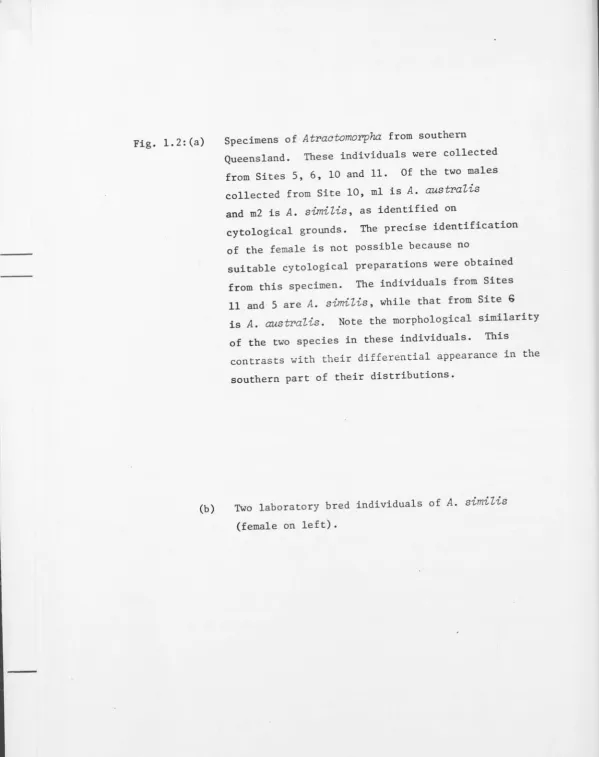
Fig. 1.2:(a) Specimens of
Atractomorpha
from southern Queensland. These individuals were collectedfrom Sites 5, 6, 10 and 11. Of the two males
collected from Site 10, ml is
A. australis
and m2 is
A. similis,
as identified oncytological grounds. The precise identification
of the female is not possible because no
suitable cytological preparations were obtained
from this specimen. The individuals from Sites
11 and 5 are
A.
similis,
while that from Site Gis
A. australis.
Note the morphological similarityof the two species in these individuals. This
contrasts with their differential appearance in the
southern part of their distributions.
(b) Two laboratory bred individuals of
A. similis
[image:15.662.12.611.17.774.2]S11:
f
S6:m
1
I
m
1cm
L...J
'
(\
S10:f m1 m2
S5:
f
m
Fig. 1.3:
Fig. 1.4:(a)
Site 10; Splinter Creek, looking south along western bank of the creek. Both
A. austraZis
andA. simiZis
were collected at this site, where they were found randomly dispersed onthe vegetation.
Abnormal spermiogenesis in an individual of
Atractomorpha
from Site 10. Note the wide [image:17.665.7.614.17.790.2]II, •
'
8·
J~
•
b
•.
,.
•
5:-•
•
.
(.
•
•
.
#
'
I•
20)"
·
•
•
.._.
•
•
•
•
,
"\
-
·
•
p
·,
I•••
•
•
n
••
•
•
~
...
:
,
••
•
•
•
\\
•
•
•
•
•
•
.
n-•
-·
.
•
•
•
•
•
•
••
•
•
••
•
•
•
•
•
~
•
•••
.
-
•••
•
•
•••
•
••
so..,
•••
•
·u
•
•
•
••
..
•
•
•
..~
TABLE 1.1 RESULTS OF INTER-SITE SINGLE-PAIR MATINGS
*
A: Matings between different populations of
A.simiZis
Copulation
Female Parent Male Parent Observed Hatchlings
Site 5 Site 9
9 5
9 1
11 8
8 11
8 5
B: Between-species matings
Site 6
6
2
5
Laboratory-bred
A. simi
ZisSite 9 5 11 2
A. austraZis,
Sullivan's Creek, A.C.T.
+
+
+
+
+
+
+
+
+
+
+
+
+
+
+
+
(4)+
.
(2**)*
More than one single-pair mating was set up in most cases. Normally, three pairs were so mated.** These two hatchlings were the total progeny of ten single-pair matings.
Adults
+
+
+
+
[image:19.666.20.650.15.793.2]3
hybridise at Site 10, as they do copulate in the laboratory (Table 1.1). ·The one undetermined male from Site 10 might possibly·have been hybrid as
it appeared to be sterile. Its testes were undeveloped, no meiotic
divisions were found, and the few sperm present were abnormal in appearance (compare Figs. 1.4a and b). However, considering the extremely low
viability of hybrids seen in the laboratory, it seems unlikely that hybrid individuals, sterile or otherwise, would be detected in such a small
population sample as that taken from Site 10. Previous attempts to hybridise the species in the laboratory have all proved unsuccessful
(Nankivell, 1976). Inter-specific matings reported in this study also failed to produce any viable progeny, except in one mating, where a single sterile adult female resulted (Table 1.1).
1.2. Biological Features of
Atractomorpha
simiZis
In his 1971 paper, Kevan listed 114 recordings of
A.simiZis
or its earlier synonyms. This species is particularly well known between Townsville and Mosman on the north Queensland coast and 47 of the 114 reports relate to this area. Like other species of the genus,A.simiZis
lives in moist situations and feeds on dicotyledonous herbs (Key, 1969, p.341).
4
of low vagility and occurs, over the less humid parts of its range, in
small discrete populations several kilometres apart. Only in the relatively
humid "refuge area" in New Guinea, around Cairns and near the N.S.W./
Queensland border are continuous populations found. "Refuge areas" are
those which, as a result of their particularly favourable climates, were
the only areas inhabitable by many species during periods when the climate
of the entire region was much drier than at present. These areas and the
times at which they were acting as refuges are discussed in detail by
Keast (1961). In these areas,
A.simiZis
is present along roadsides, inovergrown areas in and around cultivated fields and in domestic gardens.
In less humid areas, the species is restricted to the banks of creeks and
rivers.
A.simiZis
has a preference for fleshy dicotyledonous food plantsand hence is much more common in weed-infested or cultivated areas than in
native vegetation. The advent of European settlement has probably led to
a wider distribution of this endemic species. However, despite its
widespread abundance, it is difficult to catch in large numbers because it
often lives amongst dense ground cover. Its tendency to crawl rather than
fly from plant to plant makes it difficult to find in thick vegetation.
A.simiZis
has no winter diapause, unlikeA.austraZis
which isunivoltine except possibly in the "refuge area" near the N.S.W./Queensland
border, near the northern limit of its range (Site 6, Fig.1.1). Judging
by the generation times observed in the laboratory,
A.simiZis
could gothrough 2.5 generations per year in its north Queensland habitat. A great
deal of generation overlap was observed in all north Queensland populations.
Field records made during collection note the presence of most instars
occurring contemporaneously. Collections were made during April and
September and at both times individuals at all stages of maturity were
5
year. Populations in north Queensland are perennial. Specimens of
A.similis
raised in the laboratory have survived up to the age of 14 monthsand females may still lay eggs up to the age of 12 months.
The north Queensland climate varies most with respect to rainfall,
and the year may be divided into two seasons: dry, May to October, and wet,
November to April (Atlas of Australian Resources, 1959). This division
becomes less pronounced inland, as total rainfall drops dramatically.
This trend is shown in the map of the region (Fig.1.5). The average annual
rainfall in the area ranges from approximately 2500 mm in some coastal
areas to 1000 metres southwest of Mareeba, around Site 21. It should be
noted that above average rainfall has been recorded in this region for
every year since 1970. The isohyets shown in Fig.1.5 are those supplied
by the Bureau of Meteorology for 1975. In that year, mean rainfall in
the Barron Meteorological District, which includes the area of this study,
was 15% above average. The altitude of sampled population sites ranges
from six metres (Site 17, Fig.1.6) to 900 metres (Site 20). Variation in
the vegetation is largely correlated with rainfall, and ranges from
tropical rain forest on the eastern edge of the Tableland and the coastal
plain, from which it has been almost totally removed by man, to dry
sclerophyll woodland around Site 21 and further west.
On the humid coastal plains, grasshoppers are relatively
plentiful, and are dispersed evenly rather than concentrated in small
pockets, as they are further inland. The nature of these two types of
site is shown in Fig.1.7. The inland populations are often confined to
disturbed areas in the sclerophyll forest. Such sites are usually beside
roads or under bridges at river or creek crossings. The disturbed areas
around the bridge earthworks are often colonised by noxious and other weedy
species such as Noogoora burr
(X
anth
i
wn chinen
s
e
),
blackberries(
Rubu
s
Fig. 1.5: The frequency of germ-line polysomic males in populations of
A. similis
taken from theCairns/Atherton Tableland region of North
Queensland (see inset of Fig. 1.1 for
location and scale). Isohyets, drawn from
the regional annual rainfall map for 1975
(Australian Bureau of Meteorology) are
labelled at the bottom of the map with the
annual rainfall in millimetres. Grasshopper
collection sites are denoted as S14 to S25
and the relative frequencies of polysomic
individuals at each site are represented
as unshaded sectors in the pie diagrams.
The number of individuals sampled at each
[image:23.666.6.612.20.776.2]S 2 2 ~
S 2 1 ~
1 O O 0
160 0
2 400
3200
I
I
146°E
170
s
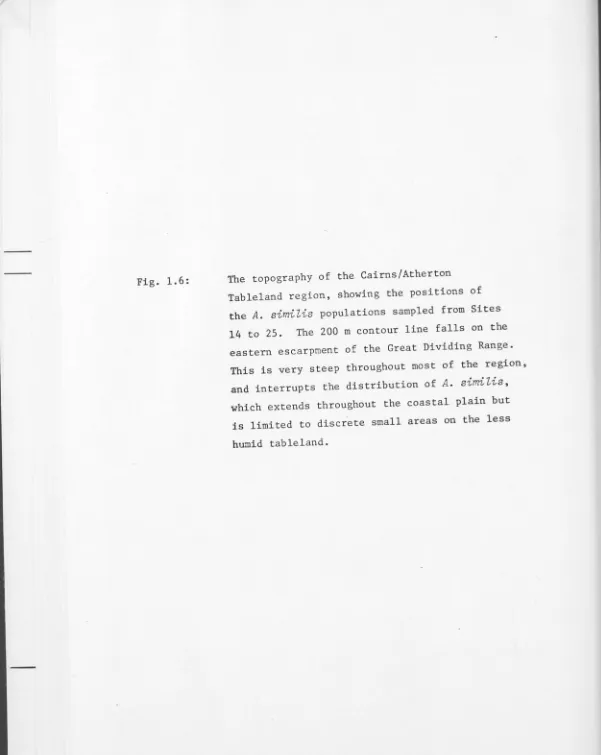
J.+.-,-Fig. 1.6: The topography of the Cairns/Atherton Tableland region, showing the positions of
[image:25.660.6.607.17.772.2]D
<
200m
~
.-:::::·
:-:
2 0 0 - 1 0 0 0
m
-:··
. ::::-··:·:-146
°
E
Fig. 1. 7: The two major kinds of site at which populations of
A. similis
are found in no_rth Queensland. (a) A site (S18) on the humid coastal plain, 18 km north of Cairns.A.
simiLis
was found in thegrassy region stretching from the foreground to the sugar cane. (b) A typical riparian site
[image:27.665.7.613.18.780.2]6
Polygonaceae and Compositae.
Some of these species provide ideal food souTces for
A.simiZis,
which rarely eats grasses or xerophytic shrubs. The abovementioned species are hydrophilic and, in drier areas of the region, their growth is primarily limited by lack of rainfall. During the winter drought, the plants, and hence the grasshoppers, live in a much smaller area and in reduced numbers. The grasshoppers need moist· bare earth or sand in which to lay their eggs and the sides of river banks, ploughed fields or roadsides provide ideal laying sites.
1.3. The Field Surveys: Rationale and Results
This study began with the specific aim of surveying the chromosome variation present in widespread populations of the grasshopper,
A
.s
imiZis.
To this end, the initial field collection surveyed populations of this species from northern N.S.W. to north Queensland, a range of some 2000 kilometres (Fig.1.1). Only relatively small numbers of individuals from each site were sampled at this stage since the intention was to maximise the number of populations examined.TABLE 1.2 INITIAL SURVEY: FREQUENCIES OF GERM LINE POLYSOMIC MALES
IN
A.SIMILIS
POPULATIONSPolysomic Males Sample Size
Site: II Name Number Frequency
5 Kedron Brook 0 0 3
7 North Yandina 0 0 5
8 Catfish Creek 2 0.33 6
9 Raglan 1 0.17 6
10 Splinter Creek 0 0 2
11 Barambah Creek 1 0.25 4
12 Black River 0 0 15
13 Cordelia 0 0 13
14 Innisfail 0 0 14
15 Atherton 1 0.10 10
16 Mt.Molloy 2 0.20 10
17 Rocky Point 2 0.20 10
18 Reed Road* 2 0.13 15
x
=0.10 ~ =113TABLE 1.3 OCCURRENCE OF POLYSOMIC AND B CHROMOSOMES
IN
A.AUSTRALIS
POPULATIONSName
S*2 Musk Valley Creek
S 3 Crystal Creek
S 4 Nixon's Creek
S 6 Mt Glorious
S10 Splinter Creek
*
SiteIndividual
II
1 2 3 4 5 1 2 3 1 2 3 4 5 6 1 2 3 1 2 3 4 5 6Number of Extra.Chromosomes Per Follicle
Polysomics B's Follicle
II
1 2 3 4
2 1 2 0 0 0 0
1 2 2
2 0 6 3
0 2 0 1 2 2 0 3 0 0 2** 0 0 0 0 0 1
Follicle ti
1 2 3 4
0
0 0 0 1 0
0 0
0
0 0 0 0
1 1 1 2 0 0 0 2 0 0 0 0 1 0 0 0 0
supernumerary chromosomes are not homologous with any member of the
standard set (White, 1973, p.312; Rees, 1974) whereas,. as shown in Fig. 7
1.8, the extra chromosome in
A.similis
occasionally establishes a clearchiasmate connection with the megameric chromosome of the standard set, A9.
Individuals carrying such extra chromosomes are thus unmistakably polysomic.
The occurrence of polysomy on this scale is rare in any organism
and is especially so among animals (Khush, 1973, Ch.12). It was, therefore, of considerable interest to attempt an analysis of the nature, the extent and the consequences of such polysomy. Since the first collection had shown that polysomy in
Atractomorpha similis
was most frequent in the Cairns/Atherton Tableland region of north Queensland, this area was chosenas the site for a detailed examination of the phenomenon.
In the Atherton Tableland/Cairns region, the maximal climatic
change over the shortest distance occurs along a line running WSW from the coastline near Cairns. The Cairns/Mareeba/Dimbulah road provides a
reasonable approximation to this line. Reports of
A
.
similis
from several sites along this road were recorded in Kevan's 1971 review. The species extends southwest from Dimbulah, on the road to Chillagoe, for at least 32 kilometres, as far as Eureka Creek (Site 21), where the annual rainfallis approximately half that found in Cairns. Unfortunately, this transect does not afford maximal variation in altitude or, therefore, in mean
monthly temperature. The Tableland varies between 350 and 450 metres above sea level along this road. Further south around Ravenshoe the altitude
reaches 900 metres and more. One population was sampled in this region (Site 20, Fig.1.6) which is as high as any known habitat of
A
.
similis
in Australia. An additional site from the humid coastal plains near Innisfailwas chosen, as this area has a mean rainfall of approximately 2500 mm per
annum, the highest in the region, and indeed, the equal of the highest rainfall
Fig. 1.8:
Fig. 1.9:
Pachytene of male meiosis in
A. sirrrilis.
This cell is trisomic for the megameric Autosome 9, andthe 3 copies of A9 are associated in what appears
to be a trivalent, designated 9:iii. One
interstitial and one terminal chiasmata are
present in this trivalent. The centromeres
of the 3 AG's are marked with small bars.
Late diplotene of male meiosis, showing the
presence of a univalent B chromosome. Also
shown are 2 heteromorphic bivalents, including
a very large homozygous segment on Autosome 7.
The characteristic megameric bivalent, designated
9m, is also identified, as is the X. Note the
close proximity of the X, the megameric 9m and
the heterochromatic half of the B. Such
associations are often observed, but do not
usually persist beyond diakinesis. This cell
(Site 19), 90% of them died during or soon after transportation to the
laboratory. Among samples from the other seven sites visited during this
same expedition, survival to the time of fixation varied between 36 and
64% (Table 1.4 ) .
8
This field survey would perhaps have been more successful if
material had been fixed in the field, as it was during the preceding field
collection. However, a major aim of the last collection trip was to provide
enough live animals for establishment of breeding stocks containing polysomic
chromosomes. As the suspected frequency of individuals carrying these
chromosomes was conservatively estimated at 10%, at least 20 live males
from each site would have been required in order to ensure the availability
of a reasonable number of polysomic parents for future breeding.
The second major aim of this field survey was to test whether
the frequency of polysomic individuals in different populations could be
correlated with any environmental variable. The Cairns/Atherton Tableland
region is geographically and climatically heterogenous to a far greater
degree than any region of comparable size throughout the range of
A.similis.
It was therefore expected that if maintenance of extra chromosomes in these
populations was achieved by any environmental selection pressure, then a
correlation between some measurable variable and frequency of polysomy
would be most easily detected within this region. A similar rationale
II
has been used elsewhere. Bosemark (1967) studied the frequency of
accessory chromosomes in the plant
Phlewn phleoides
on a Baltic islandwhich was chosen specifically for its heterogeneity of soil type. The
istand was 140 x 15 km, a size sufficiently large to provide significant
environmental variation, but small enough to ensure that all plants present
would not be so genetically diversified as to have evolved different
responses to any given value of a relevant environmental parameter. In the
TABLE l.4 Site II 18 19 20 21 22 23* 24 25
THE FREQUENCIES OF EXTRA CHROMOSOMES IN POPULATIONS SAMPLED IN NORTH QUEENSLAND
N 48 8 16 20 18 36 31 48 Site Altitude (Metres) 20 90 900 400 450 500 450 350
Frequency of % Survivial
Polysomic Between Collection Males and Examination
0.15 64
0 9
0.19 40
0.25 36
0.33 25
0.33 51
0.19 52
0.27 64
~ = 225 X = 0.23
these prerequisites than does any other area available.
The wide-ranging but smaller population samples of the first field collection yielded information on chromosomal variation
9
in the species over long distances. On this scale, any local peculiarities could be the product of genetic isolation as well as adaptation to
local selection factors. The results of the earlier collection are shown in Tables 1. 2 and 1. 3. What one can conclude from these is
that polysomy in
A.simiZis
seems to be more connnon in the Cairns/Atherton Tableland populations than elsewhere. Nankivell (1976) also found a relative absence of polysomy in southern populations of the species. Heobserved no polysomy in Dee Why (Sydney) and Balranald (southwestern N.S.W.) populations, but did observe trisomy for A9 in one individual from Coff's Harbour (north coast of N.S.W.). This individual also contained a single B chromosome (Nankivell, 1976, his Fig. 3), similar in appearance to the only other B chromosome known in this species
(Fig.1.9), which was found, during this study, in two individuals from Site 23 in north Queensland (Fig.1.5), 1600 km from Coff's Harbour.
B chromosomes occur much more frequently in
A
.
a:ustraZis
.
Nankivell (1976) reports a large and a small B chromosome in the Gilderoy (Melbourne) population. Two similar species of extra chromosomes were found in this study, in the Site 4 population ofA.a:ustraZis.
Extra chromosomes of one kind or another were foundin
A
.
australis
populations from Sites 2, 3, 4, 6 and 10 (Fig.1.10).These appear similar in morphology to either the large or the small B chromosome seen in the Gilderoy population (c.f. Nankivell, 1976, his Fig.?.), despite the fact that Gilderoy and the populations sampled here are at least 1000 km apart.
Fig. 1.10:
Fig. 1.11:
Extra chromosomes found in populations of
A
.
austraZis.
(a) AB chromosome found at S2 (Musk Valley Creek). The heterochromatic end of the Bis associated with the X chromosome which is itself associated with the megameric bivalent (labelled 9m). (b) A small extra chromosome, designated 9e, which was found at S3 (Crystal Creek). This cell is therefore
tetrasomic for A9. The individual was mosaic with respect to the number of extra copies of 9 present and the inset includes part of a cell from another follicle in the same individual, containing only three extra A9's, here associated as a trivalent (9e:iii). (c) The large B chromosome found at S4 (Nixon's Creek). This individual contains one B, although two others from this same site had
two B's each. (d) The small chromosomes labelled u were observed in an individual from S6 (Mt. Glorious). From their degree of condensation, it is probable that these chromosomes are unpaired megamerics from an essentially polysomic
individual and that the bivalent labelled 9ii represents a pair of additional A9's. (e) The semi-heterochromatic B chromosome found in one
A. austraZis
male from S10 (Splinter Creek).Diagrammatic representations of the B chromosomes found during this study in both
Atractomorpha
·s.
C
.
,
~ Sp
A-l ~'\ '
.-.
- -
..
'
d
Q)~
I
52
t'
:/
u\
S4
9e
,
,
e
•
•u
I9ii
Jx
I
xtl
S10
S23
'
...C
4 and 6 (Table 1.3) could possibly be an extra copy of A9 rather
than a true B. The megameric chromosome of
A.australis
is smaller and less distinctive than its counterpart inA
.
similis,
and soidentification of extra copies of it is more difficult. However, the
small chromosomes from Site 3 do occasionally exhibit a striking
similarity to the megameric pair (Fig.l.lOb).
·This small extra· chromosome and the similar one from Site 4
(Fig.l.lOc) are present in variable numbers in the germ line, unlike the
large B chromosome coI!IlTlon at Site 4 and the smaller Bat Site 2 which
are present in invariant numbers within an individual. When three
of the small unstable chromosomes are present, they can form a
trivalent (Fig.l.lOb). The behaviour of these small chromosomes, as
will be demonstrated in Chapter Two, is remarkably like that of the
polysomic chromosomes common in
A
.s
imilis.
If the small extra chromosomes ofA
.
australis
are extra copies of the megameric, then, in the population sampled at Site 3, such polysomy appears morefrequently than does polysomy in any known
A.similis
population{Compare Tables 1.2 and 1.3). Up to six extra A9's were seen in the
germ line of
A
.
australis
.
A.similis
andA
.
australis
may both commonly exhibit apparent germ line polysomy, but they do not show such similarity in theirpossession of true B chromosomes. In
A.australis,
alarge-sized stable B chromosome was found to be very common at Site 4
and intermediate sized stable B's were found at Sites 2 and 10 (Table
1.3). These occurred in four out of six individuals at Site 4, one
out of five at Site 2 and one out of six at Site 10. All three B
chromosomes were semi-heterochromatic, and are shown in Fig.1.11.
10
this B chromosome was also heterochromatic for half its length and thus
similar in appearance to the B reported in an individual from Coff's
Harbour, N.S.W. (Nankivell, 1976, his Fig.3).
11
A striking feature of the findings of the last field collection
is that there is no sign{ficant difference between the frequencies of
polysomy at any of the seven sites visited. These frequencies ranged from
15 to 33% with a mean of 24% (N = 217) (Table 1.4) if Site 19 from
which only nine males were sampled is excluded. By contrast, out of a
total of 68
A.similis
collected earlier from Sites 5 to 14, only four were polysomic. These sites all lie south of the Cairns/Atherton Tablelanddistrict. Two of the polysomic individuals were found at Site 8, the
others at Sites 9 and 11. AG-test of the difference between this sample
and the Cairns/Atherton Tableland sample gives a highly significant result.
G = 11.852 as calculated by means of the 2x2 test of independence (Sokal
and Rohlf, 1969, p.591). Such a G value indicates that the probability
of both samples coming from one homogeneous population is less than
0.005. The null hypothesis, that there is no difference in frequency of
polysomy over the range examined, is thus rejected.
Although only four polysomic males were found in the southern
and central range of
A.similis,
it should be noted that polysomy was also found in this species at Coff's Harbour, N.S.W. (Nankivell, 1976). Ittherefore seems that germ line polysomy, although it is more connnon in
the north, occurs throughout most of the species range in eastern Australia.
The same is probably true of
A
.
australis
,
although true B chromosomes are an equally frequent phenomenon in the latter species.The small numbers of
A
.si
milis
sampled from populations in southern Queensland make it difficult to state whether these sites differsignificantly from those further north in respect of the frequency of
Tableland region were from southern Queensland. What does seem certain, therefore, is that the populations between Townsville and Innisfail
12
(Sites 12, 13, 14 and 19) are relatively devoid of polysomy, compared with
the Cairns/Atherton Tableland populations. There is no recognisable
environmental factor common to these sites which could be responsible for
this. The annual rainfall at Innisfail is approximately 1000 mm compared
with 300 mm p.a. at Townsville. Most other environmental variables change as a result of this rainfall differential.
From the field data presented here, it is not possible to
identify any environmental factor which correlates with the frequencies of polysomy found in natural populations of
A
.similis.
These frequencies do vary, but only over distances of hundreds of kilometres, which are far in excess of the distance over which populations of this invagile species could have been in recent genetic contact.1.4. Rationale for the Thesis
In summary, the survey of natural populations of
Atractomo
r
pha
s
imilis
revealed the occurrence of male germ line autosomal polysomy in 14 of the 20 populations sampled. As some of these 14 populations were small and isolated, containing, for example, an estimated one to13
in natural populations are these: (1) Any adaptive advantage or disadvantage
suffered by the individual as a result of germ line polysomy; (2) The
efficiency with which a basis for polysorny is transmitted from one
generation to the next. In essence, this thesis attempts an investigation
of these two factors, with emphasis on the second, as this is a cytological
rather than an ecological study. The data presented in this chapter shed
some light on the first factor: the adaptive significance of germ line
polysorny. It is clear that if there is any such adaptive significance,
it is only marginal, as there is no drastic net reduction or increase in
fitness associated with germ line polysomy. The equivalent viability of
polysomic and non-polysomic laboratory stocks, discussed in later chapters,
reinforces this conclusion.
The remainder of this thesis falls into four major sections, each
of which is concerned with a different aspect of the polysomic system in
A.s
imilis.
The aims of these sections can be briefly summarized as follows: (1) To define the precise nature of the polysomic variation encounteredwithin and between individuals and to consider it against the more general
background of the other forms of cytological variation encountered within
this species. (2) To investigate the basis of transmission of the polysomic
state and to consider the results of laboratory matings, including selection
both for and against polysomic parents; (3) To attempt a computer simulation
of the patterns of variation observed within this polysomic system in order
to define more clearly the causal factors involved in the maintenance of
this system and (4) To compare the observed behaviour of the polysomic
chromosomes with that of supernumerary chromosomes and other forms of
CHAPTER 2
THE CHROMOSOMES OF
ATRACTOMORPHA SIMILIS
2.1. The Basic Karyotype
The karyotype of
Atractomorpha
similis
is that of a typicalpyrgomorphid grasshopper. The male has 2n
=
18+
XO, the female18
+
XX. All the chromosomes are rod-shaped (Fig.2.1). There is acurrent controversy as to whether such chromosomes have terminal or
sub-terminal centromeres. Proponents of the latter claim that a small,
usually invisible, arm is present in all rod chromosomes which are hence
acrocentric (Prokofieva, 1935; Muller, 1938). In some organisms, it
is known that experimentally produced telocentrics, formed by fission 14
of a metacentric at the centromere, show impaired centromeric activity,
manifest in lagging at anaphase (White, 1973, p.204). Clearly such
unstable chromosomes would be expected to be rapidly lost from natural
populations. The arguments in favour of telocentric chromosomes are
based on the observations that (a) some spontaneous novel telocentrics,
which also arise by fission of a metacentric, are certainly not unstable
at either mitosis or meiosis (Southern, 1969; John and Hewitt, 1968)
and that (b) in many species, and particularly Orthopterans, the
centromeres appear to be genuinely terminal, as they seem to be in
A.similis
(cf. Fig.2.2a and b).For the purpose of this thesis all the chromosomes of
A.similis
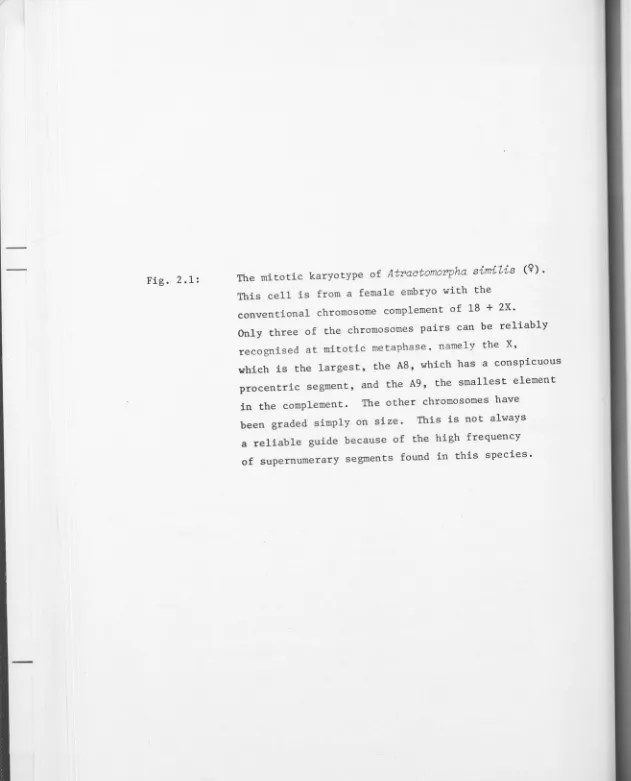
will be referred to as telocentric. Autosome Nine is distinctFig. 2.1: The mitotic karyotype of
Atractomorpha
simiZis
(9). This cell is from a female embryo with theconventional chromosome complement of 18
+
2X.Only three of the chromosomes pairs can be reliably
recognised at mitotic metaphase. namely the X,
which is the largest, the AS, which has a conspicuous
procentric segment, and the A9, the smallest element
in the complement. The other chromosomes have
been graded simply on size. This is not always
a reliable guide because of the high frequency
[image:45.690.5.636.21.802.2]8
2
4
9
'
7
4
5
3
8
5
2
X
9
3
s
X
A1
A2
A3
A4
Fig. 2.2:(a)
Fig. 2.3:(a)
Anaphase II of meiosis in
A. similis
to indicate the terminal position of the centromeres(denoted by small bars). Note that the
megameric half-bivalent (9m)has already separated.
A large heteromorphic segment (r--1) is present on
one of the autosomes. (b) Anaphase I of an
extra univalent A9 in
A.
sunilis
showing that its centromere (indicated by bars) is also terminal.Late mitotic prophase in a standard male of
A
.
similis
showing the uniformly condensed nature of all the chromosomes. Centromericpositions are indicated by bars. (b) Diplotene
of male meiosis in
A. similis
showing the various heterochromatic segments occurring in this species.Seven of these are polymorphic (r---,) in this
individual. Because of the internal differentiation
a
b
9in
,
-9m,
.
I
I
-• Sp
I
a
b
X
, ~ . _
.
' '
~
c,x
·
,
Itf
~]\
I I
~
,
~r
·
7
f''I.,
.~~.
-,_
2
,1!
...,
:
,
, v
i~
•
,
13;
1 ;~
+• l ~
~~
••j\
\ ~# I · ~ ·~I
,.,,.
\
,, l''
I
-'
.
, s,,. •
behaviour, which is common in grasshoppers, identifies the A9 as the
megameric chromosome, as first described by Corey (1938).
The chromosomes of
A.similis
are distinguished from thoseof other species of the genus by the presence of distinct terminal
or sub-terminal heterochromatic blocks in all chromosomes other than
Al. Smaller blocks are present at the centric ends of all the
autosomes. None of these heterochromatic segments are apparent at
mitotic prophase (Fig.2.3a), but most are well defined at prophase
of meiosis (Fig.2.3b). There is considerable variation in the number
and the size of the heterochromatic blocks present in
A.similis.
Fig.2.4 shows a C-banded meiotic cell from a male heteromorphic for
four terminal and one sub-terminal segments, as well as two probable
procentric segments. If the commonest arrangement is taken as a
standard then the chromosomes can be classified as shown' in Table 2.1.
This table also indicates the extent of the variation seen in respect
of heterochrornatic segments. This variation is discussed in more
detail in Section 2.3.1. By reference to the features described in
Table 2.1, it is possible to classify individual members of the
complement by the symbols Al to A9 as illustrated in Fig.2.5.
The X chromosome in the male is negatively heteropycnotic
from metaphase I to telophase I (Fig.2.5), but not differentially
pycnotic in mitosis (Fig.2.3a). It is also negatively heteropycnotic
15
in most spermatogonial mitotic metaphases. The X chromosome commonly
behaves in this manner in the short-horned grasshoppers (White, 1973).
Other notable features of the X in
A.similis
are its large size, it beingin fact the largest chromosome, and its characteristic sub-terminal
Fig. 2.4: Diakinesis in a C-banded cell heteromorphic for 3 terminal, 2 sub-terminal and 3 centric
segments. The segments in Al, A3 and A7 involve variation in the amounts of both C-band positive and C-band negative chromatin. Note that the X chromosome is C-band positive only at its
centric end and at the site of the sub-terminal band which is visible after conventional staining. In this cell, the A9 bivalent appears to have undergone 2 crossover events. This coupled with
9
5
X
2
I 514 IX
A1
A2
A3
. I
AS
Al
Al
A9
I I
\;
l
.
.
TABLE 2.1
Chromosomes
X
A 1
2
3
DIAGNOSTIC FEATURES OF THE KARYOTYPE OF
A.SIMILIS
Conventional Meiotic Appearance
positively heterochromatic in prophase. Negatively heterochromatic from metaphase I to telophase I. Non-staining sub-terminal band usually present, and visible up to and sometimes beyond telophase I.
very small amount of heterochromatin around centromere, and sometimes visible at
sub-terminal and terminal distal end.
small centric heterochromatic block, and
small sub-terminal distal block.
small centric heterochromatic block, slightly larger sub-terminal distal block, and smaller terminal block.
Conventional C-banding
(all have
centric C-bands)
small terminal and large
·sub-terminal C-bands
two large sub-terminal and occasionally a small terminal band
broad sub-terminal and small terminal bands
narrow sub-terminal and small terminal bands
Supernumerary Segments
Major super-numerary segments
Minor super-numerary segments
as revealed by C-banding
non-staining band may be of variable
width
terminal band may be present, interstitial bands may vary in
size
sub-terminal band may be of variable width.
4
5
6
7
8
large distal block small centric block large distal block large centric block, appears bipartite at times
similar to A5, but all heterochromatic blocks are smaller here
often
indistinguishable
small amount of condensation at and near centric end. Distal end free of
heterochromatin.
small amount of centric heterochromatin, distal end euchromatic
9 adjacent blocks of centric terminal and (megameric) sub-terminal heterochromatin, interstitial
euchromatic segment, and small distal terminal euchromatic segment.
large sub-terminal distal heterochromatic block.
all have large terminal band
centric band only when segment absent same as
A7
five evenly spaced and sized bands along length of A9
large distal heterochromatic block on one pair
very large ·
segment, 20%
euchromatic large distal heterochromatic block
small interstitial band sometimes present,
distal and centric segments of variable size
centric band of variable size
16
division and, to a lesser extent, in mitotic division.
It is difficult to consistently distinguish particular
chromosomes at mitosis in this species because all of them are rod-shaped.
In meiosis, the problem of identification is somewhat alleviated by the
presence of large and distinctive heterochromatic blocks in bivalents
such as A9, and their absence in Al. However, the considerable amount of
segment polymorphism mentioned earlier makes identification by
heteropycnotic character somewhat unreliable. Identification of mitotic
chromosomes is not assisted at all by reference to heterochromatin,
because, apart from the negatively staining X band, heterochromatic regions
are not visible in condensed mitotic chromosomes. As the aim of this
project was the analysis of the extensive polysomy found in natural
populations, the identification of polysomic as distinct from supernumerary
elements in both spermatogonial and somatic mitoses was essential.
The identification of specific chromosomes is frequently
facilitated by techniques of chromosome banding. These were introduced
in 1971 (Caspersson et al., 1971; Arrighi and Hsu, 1971; Drets and Shaw,
1971) and include several different types of staining and chemical
pretreatment of the chromosomes. Banding techniques may be broadly
classified into two types. One type, involving only mild pretreatment,
includes the G-, R- and Q-banding processes. The other, known as
C-banding,demands more drastic pretreatment. In the G and R techniques,
chromosomes are stained with Giemsa, whereas the Q technique involves
the use of fluorescent dyes such as Quinacrine mustard. The G, Rand Q
techniques give essentially similar banding patterns. The human karyotype
has been extensively studied by these methods, and roughly corresponding
hands are produced in all three cases, although R-bands have reversed
stain intensities (Paris Conference, 1971: Standardization in Human
technique, as well as all the G-bands. Because only mild pre-treatment is required to give G-bands, many simple techniques have been reported, each giving similar results (references given in Paris Conference, 1971). Common pretreatment techniques involve trypsin digestion or heating in solutions of Na2P04, SSC, distilled H20 or NaOH solution (Comings et al., 1973). In the present study, trypsin pre-treatment was used, following the method of Seabright (1971), with some modifications (Webb, 1976).
There is as yet no satisfactory explanation of the molecular nature of chromosome bands. Evidence (McKay, 1973; Comings et al., 1973; Schneider and Nagl, 1976) suggests that G-bands result from a disruption of chromosome regions containing particular acidic proteins. The
preferential removal of the cations associated with these acidic groups, and their replacement with some component of the Giemsa stain may lead to the formation of a darker staining band. This partial denaturation also removes some of the DNA, mainly from the non-staining regions. Severe pre-treatment, such as that used to produce C-bands, results in much greater DNA loss, again mainly from the non-staining regions.
C-bands generally appear in a small segment of each chromosome. Their distribution corresponds approximately to that of constitutive heterochromatin. Hence in humans, C-bands occur around the centromeres and in the long arm of the Y chromosome. In
A
.s
imilis
,
Fig.2.5 shows that C-bands are present near the centromeres as well as at the distal ends of most chromosomes, corresponding in many but not all cases to the large heterochromatic blocks seen with normal staining.G-bands, by contrast, are distributed more evenly over the entire genome. In humans, G- (and
Q-
and R-) bands occur over nearly all chromosome arms. Unlike C-bands, they are not limited to the region immediately adjacent to the centromere, and, in humans, are rarely found at chromosome tips (Paris Conference, 1971). In Orthopterans generally,Fig. 2 .5:
Fig. 2.6:
The diagnostic features of the karyotype of
A. similis
at meiotic prophase. In this figure, dots have been placed adjacent to the distinguishingfeatures of each of the chromosomes. These features
arc discussed in Table 2.1. Centromeres of all the
chromosomes are represented by the small bars. The
two larger brackets (r---i) indicate heterochromatic
segments in A7 and A8 respectively. Segment
polymorphism is so common in this species that
individuals are rarely, if ever, found without
any such segments.
A spermatogonial mitosis after G-banding. This
cell is from an individual carrying the stable
B chromosome derived from the population at S23.
The cell is also abnormal in that it contains
only one A9. The Band the A9 are the only
members of the complement which do not G-band
throughout their entire length, although there
is a tendency for a number of the autosomes to
stain lightly at or near their centromeric ends
(bars). The centromeres of the Band the A9 are
indicated by arrows. The A9 is not stained
at or adjacent to its centromere. It has two
interstitial G-positive bands. With the
exception of the small band adjacent to the
centromere, the centric half of the Bis
X
A1
....
•
•
•
•
IA4
AS
'
I
A7
AS
t
A2
-•
•
A6
/•
Al
. I
A3
•
•
•
•
18
almost the entire genome is G-band positive, and differential staining
is usually restricted to some of the highly condensed heterochromatic
blocks of the megameric chromosome, and specific segments of supernumerary
chromosomes (Webb, 1976). -Fig.2.6 shows a G-banded spertnatogonial mitosis
from
A.similis
which behaves in a similar fashion to other Orthopterans in that only the B chromosome, which is G-positive for half its length,and the megameric A9 are not homogeneously stained.
Daniel and Lam-Po-Tang (1973) showed that in the chromosomes of
the vole
Microtus agrestis,
as in humans, most but not all constitutive heterochromatic blocks correspond to C-bands. Similar observations canbe made from the distribution of C-bands in
A
.s
imilis
.
Figs.2.7 and 2.8show C-banded chromosomes from an adult spermatogonial mitosis and a
male embryo respectively. In both cases, it is evident that the C-bands
generally correspond to the heterochromatic regions visible in a
non-meiotic cell (Fig.2.5), but there are some exceptions to this. Some
of the heterochromatin of the megameric A9 is not C-banded. Conversely,
some bands appear to correspond to no visible heterochromatic blocks
of appropriate size. This is the case with the band on the distal end
of the X, and the two large sub-terminal bands on Al (Fig.2.5).
There is some parallel between this C-banding distribution
and that of the particular heavy DNA satellite isolated from
A.similis
by Miklos and Nankivell (1976).
In situ
hybridisation with an RNAcopy of this satellite showed that it was localised in the distal
heterochromatic blocks of all autosomes other than AS, but was absent from
the centric blocks. This satellite copy also annealed to the negatively
staining sub-terminal band on the X. However, some of the heterochromatin
of A9 behaved in an exceptional manner. Here, the labelled RNA copy
annealed only at or near the distal end despite the fact that both C-bands
Fig. 2.7:
Fig. 2.8:
C-banded spermatogonial mitosis in a cell containing the normal male
chromosome complement. Heteromorphic C-banded segments occur on Al, A3,