Int. J. Electrochem. Sci., 10 (2015) 9167 - 9178
International Journal of
ELECTROCHEMICAL
SCIENCE
www.electrochemsci.org
Microstructure and Corrosion Properties of Ti-6Al-4V alloy by
Ultrasonic Shot Peening
Conghui Zhang*, Wei Song, Fengbo Li, Xu Zhao, Yaomian Wang, Guizhi Xiao
School of metallurgical engineering, Xi'an University of Architecture and Technology, Xi'an, Shaanxi 710055, China
*
E-mail: jiandazhang2010@hotmail.com
Received: 17 July 2015 / Accepted: 23 August 2015 / Published: 30 September 2015
A nanostructured surface layer of Ti-6Al-4V alloy was obtained through ultrasonic shot peening (USSP). The microstructure and microhardness were studied using an optical microscope and a nanoindentation tester. The corrosion performance of the Ti-6Al-4V alloy was investigated using potentiodynamic polarization and electrochemical impedance spectroscopy (EIS). The composition of the passive film formed on the surface was analyzed using X-ray photoelectron spectroscopy (XPS). The results show that the grain size of the surface layer is on nanometer scale and increases gradually from the surface to the matrix after USSP treatment. The surface microhardness reaches up to approximately 7 GPa, which is significantly higher than that of the matrix. The self-corrosion potential of the USSP samples increases compared with that of the untreated sample, and the corrosion current density decreases by two orders of magnitude, the capacitive resistance is much larger. A compact and stable passive film forms on the surface after USSP treatment. High-density nanograin boundaries and dislocations generated from surface nanocrystallization provide more channels for Ti4+ to form passive oxide films.
Keywords: Ultrasonic Shot Peening (USSP) Ti-6Al-4V microstructure electrochemical corrosion behavior
1. INTRODUCTION
USSP treatment uses high-frequency projectile impacting specimen surface repeatedly to achieve grain refinement and introduce the compressive residual stress at the same time. USSP treatment could significantly improve the mechanical properties of materials. Wu et al.[1] reported that a strengthened layer was produced on the surface after USSP treatment. The mechanism of grain refinement has been discussed as well. Unal et al.[2] reported that the nanohardness after USSP was approximately 1.5 times higher than that of the initial state, and the elastic modulus increased to approximately two times that of the initial state. Mao et al.[3] reported that USSP treatment enhanced the wear and corrosive wear resistance of Cu-30 Ni alloys. The nano-sized grains obtained during the USSP treatment were considered as the major factor in enhancing wear and corrosive wear resistance.
The factors influencing corrosion behavior are complex, and the results obtained by different authors are controversial. The four major factors are described as follows. (1) Grain size is a critical factor in the corrosion resistance of metallic materials. Wang et al.[4] investigated the effect of surface nanocystallization induced by shot peening on the corrosion resistance of 1Cr18Ni9Ti stainless steel. They pointed that surface nanocrystallization decreased the current density and improved the corrosion resistance of stainless steel. (2) Compressive residual stress is another factor in increasing corrosion resistance. Trdan et al.[5]reported that a significant improvement in pitting potential was observed in 0.05 M NaCl solution after pure mechanical laser peening on AA6082-T651 Al alloy. They pointed that the increase in critical pitting potential was attributed to the effects of compressive residual stress and work hardening. Liu et al.[6] confirmed the beneficial effects of compressive stress on localized corrosion. The samples with compressive residual stress increased the breakdown and repassivation potentials and decreased the passive current density. (3) Roughness is also an important factor in corrosion resistance. Lee et al.[7]studied the influence of surface roughness on the corrosion behavior and showed that smoother surface indicated better corrosion resistance. The surface active area became larger and the corrosion rate became faster with the increase in surface roughness. (4) The processing method degree[8], and corrosion environment[9-11] are also the influencing factors in corrosion resistance.
The corrosion resistance of Ti and its alloys has been extensively studied. Balyanov et al.[12] found that Equal channel angular pressing derived ultrafine-grained Ti could more readily form passive film on the surface than coarse-grained Ti, and the impurity segregation was more homogeneous than in coarse-grained Ti. Johansen et al.[13] had a similar viewpoint, and they pointed that passivation initially started on the crystalline lattice defects of the surface. This effect could be avoided by the adsorption of albumin onto the metal surface. Huang et al.[10] reported that the passive films formed on Ti-6Al-4V alloy could be destroyed by fluoride ions via Na2TiF6 formation when the NaF concentration was increased to 0.1%. Ittah et al.[14] reported that the pitting sensitivity of titanium in different density of corrosion medium was anomalous. Furthermore, Silva et al.[15] reported that nitrogen enriched Ti-6Al-4V alloy layer was formed on the material surface through plasma-immersion ion implantation, which resulted in better corrosion resistance for Ti-6Al-4V alloy.
2. EXPERIMENTAL
2.1. Materials
Commercial titanium alloy(Ti-6Al-4V) was selected for USSP treatment. The samples were ground and washed with acetone, and then dried in air before USSP. The ZG30 pill with 3mm diameter was jetted at a constant angle for 85°under 0.4 MPa working pressure. The samples were subjected to USSP treatment for 15, 30, and 45 min, respectively.
The corrosion specimens were cut from USSP treatment plate in a dimensions of 15 mm ×15 mm ×4 mm. After being washed with acetone, specimens were embedded in epoxy resin with a top surface exposed area of 1 cm2.
2.2. Methods
The OLYMPUS GX51 was used to observe the microstructure. Nanoindentation test was performed by Agilent Nano Indenter G200. The test started from the top surface to the matrix, 20 µm as an interval, and it was kept at the maximum load of 5 gf for 10 s. The JEM-3010 transmission electron microscopy was used to observe the microstructure of the sample.
Electrochemical experiments were performed by PARSTAT-4000, equipped with a standard three-electrode configuration: using a platinum sheet as auxiliary electrode and a saturated calomel electrode (SCE) as the reference electrode. The corrosion medium is 3.5% NaCl solution. Before the electrochemical test, the specimens were immersed in the solution for 30 min for the equilibrium potential. In order to clarify the reproducibility, the tests were repeated three times. Potentiodynamic polarization curves were performed in the potential range from -250 mV to 800 mV at a scan rate for 1.5 mV/s. EIS experiments were realized in the frequency range from 100 KHz–0.01 Hz with AC amplitude of ±10 mV superimposed to the open circuit potential value[16]. Both the experiments and the data were fitted using the ZSimpWin software. Surface chemical compositions of both untreated and 30 min USSP-treated sample, which were immersed in 3.5% NaCl solution at room temperature for one month, were analyzed by X-ray photoelectron spectroscopy (XPS). The XPS were performed in an K-Alpha spectrometer with a monochromatic Al Kα X-ray source of 1486.71 eV and a power of 225W. The binding energy was calibrated with C1s peak with a binding energy value of 284.8 eV.
3. RESULTS AND ANALYSIS
3.1. Microstructure
[image:4.596.65.541.126.381.2]
time of 15, 30, and 45 min is about 100, 150, and 170 µm, respectively, which increases with the prolonging of the process time.
Figure 1. OM images of Ti-6Al-4V for samples:(a)Untreated sample, (b)15 min USSP-treated, (c)30 min USSP-treated, (d)45 min USSP-treated
[image:4.596.207.389.555.723.2]A TEM image of the topmost surface region of the 30 min USSP-treated specimen is shown in Fig. 2, which confirms the presence of a nanostructure. The grains are refined to nanoscale and homogenously distributed. High-density dislocations can also observed in Fig. 2. The figure of the corresponding diffraction represents well-defined diffraction spots for a nanoscale structure. A large number of grains exist within the scope of selection, with random crystallographic orientations.
USSP treatment can achieve surface nanocrystalline by producing severe plastic deformation on the surface of the materials. The refinement mechanisms of various materials are different because of the stacking fault energy. Slipping is the predominant mode of deformation for the Ti-6Al-4V alloy processed by USSP treatment.
3.2. Nanoindentation test
Fig. 3 shows the microhardness of Ti-6Al-4V after USSP treatment with increase of the depth from the surface. The surface microhardness of Ti-6Al-4V alloy significantly increases after extending the processing time of the USSP treatment. Grain refinement is the major factor in increasing surface microhardness. With the increase of processing time, the accumulation of plastic deformation on the surface of the material makes the work hardening phenomenon intensified. The 45 min USSP-treated sample exhibits the maximum surface microhardness, which increased by 55% compared with the untreated sample.
0 50 100 150 200 250 300 4.0
4.5 5.0 5.5 6.0 6.5 7.0
M
ic
ro
h
a
rd
n
e
ss
(G
P
a
)
Depth(m)
[image:5.596.195.384.347.510.2]USSP15min USSP30min USSP45min
Figure 3. The variation of microhardness of Ti-6Al-4V alloy with the depth from the surface after USSP
3.3. Potentiodynamic polarization curves
along with the change in potential. The anode process for the untreated sample is similar with the USSP samples. The passive current density is much larger than the USSP samples, which indicates that the surface passivation of USSP samples is much effective than that of the untreated sample.
-20 -18 -16 -14 -12 -10 -0.6
-0.4 -0.2 0.0 0.2 0.4 0.6 0.8
P
o
te
n
tia
l
ESC
E
(V
)
Log(i/Acm-2)
[image:6.596.184.389.151.319.2]Untreated USSP15min USSP30min USSP45min
Figure 4. Polarization curves of the samples before and after USSP in 3.5% NaCl
Electrochemical parameters, including corrosion potential (Ecorr), corrosion current density (icorr), passive current density (ipass), cathodic tafel slope (βc), anodic tafel slope (βa) and linear polarization resistance (Rp) are shown in Table 1. Compared with the untreated one, all USSP-treated samples exhibit an anodic shift in Ecorr and a significant decrease in icorr. Prolonging USSP treatment time leads to a more significant anodic shift, which indicates that the anode reaction process becomes more difficult. The smaller tafel slopes, the lower potential of reaction process at the same current density in kinetics. The USSP-treated 45 min sample gets the smallest tafel slope. The corrosion current density is generally regarded as an important parameter in evaluating corrosion reactions in kinetics. The corrosion current density attained from the polarization curves is usually proportional to the corrosion rate[19]. The icorr values of the USSP samples are 2 orders of magnitude smaller than that of the untreated sample. Moreover, the USSP samples exhibit much lower ipass than the untreated sample. Therefore, USSP treatment is an effective method to improve the corrosion resistance of Ti-6Al-4V alloy.
Table 1. Electrochemical parameters obtained from the polarization curves for the samples before and after USSP
Ecorr (I=0)(mV)
icorr (µA/cm2)
Βa
(mV/dec)
Βc
(mV/dec)
ipass (µA/cm2
)
Rp (KΩ×cm2
)
Untreated -329.661 6.611 170.16 -82.97 1.024 62.627
USSPed15 -267.525 0.069 127.15 -43.3 0.233 386.137
USSPed30 -257.407 0.063 50.25 -35.95 0.194 784.999
[image:6.596.44.555.663.753.2]
Grain refinement enhances corrosion resistance. Op’tHoog et al.[20] reported that grain refinement was particularly important for Mg, which commonly displayed poor corrosion resistance. Aung et al.[21] also reported that the effect of grain size was more remarkable in corrosion with un-twinned microstructure. The corrosion rate significantly increased as the average grain size increased from 65 µm to 250 µm. In the present study, the high-density grain boundaries of the nanocrystalline material make the impurity uniformly distributed and enhance the reactivity, which is favorable for passive film formation. Balusamy et al.[22] expressed a similar viewpoint.
3.4. EIS (electrode impedance spectroscopy)
EIS is employed to investigate the electrochemical properties of Ti-6Al-4V before and after USSP in 3.5% NaCl, and the Nyquist impedance diagrams are showed in Fig. 5. A large capacitive loop is present from high to low frequencies, which is related to the charge transfer of the corrosion process ocurred on the surface. Dispersion effect exists because the center of capacitive reactance arc deviates from the real axis[23]. In the present study, the radius of the capacitive loop for the USSP samples is larger than that for the untreated sample. It increases with increasing of process time. Larger radius of the capacitive loop represents higher charge transfer resistance and superior corrosion resistance of materials[24]. Corrosion resistance is enhanced after USSP treatment.
0 40000 80000 120000160000200000240000 0
100000 200000 300000 400000 500000 600000
Zi
m
(o
h
m
s)
Zre(ohms) Untreated
[image:7.596.177.388.413.578.2]USSP15min USSP30min USSP45min
Figure 5. Nyquist diagram for the samples before and after USSP in 3.5% NaCl
Figure 6. Equivalent circuit used to fit EIS spectra R
s
Q
[image:7.596.209.359.639.714.2]
An equivalent circuit showed in Fig. 6 is used to fit the experimental EIS spectra of the samples with only one time constant. In the equivalent circuit, Rct and Rs represent charge transfer resistance and solution resistance, respectively. Constant phase element (CPE) representing the double layer capacity is used to simulate a non-ideal behavior of the condenser, and n is the exponent of CPE ranging from 0 to 1.
[image:8.596.83.513.373.445.2]The simulated values of the equivalent circuit are given in Table 2. The USSP samples have higher Rct values and reach a maximum value of 9777 KΩ after 45 min of USSP treatment. These improvements are associated with the formation of the compact passive film on the surface of the USSP samples. The compact passive films increase the difficulty in charge transfer[20] and then improve corrosion resistance. The values of n are closer to 1, which means that the passive films formed on the samples are closer to ideal capacitors with compact structure. A high value of the capacitance Q corresponds to a thin passive film. Therefore, the more compact passive films formed on the surface of the USSP samples act as a barrier during corrosion[25] to prevent the metal from corroding. Moreover, the corrosion resistance of the 45 min USSP-treated sample is superior to that of the other samples.
Table 2. Equivalent circuit parameters simulation for Ti-6Al-4V before and after USSP in 3.5% NaCl Rs(Ω×cm2
) Q(F×cm2) n Rt(Ω×cm2)
untreated 6.703 2.622E-6 0.7171 3.578E5
USSPed15 6.015 2.548E-5 0.777 1.147E6
USSPed30 8.605 2.206E-5 0.8302 5.313E6
USSPed45 5.611 2.158E-5 0.8587 9.777E6
3.5. XPS
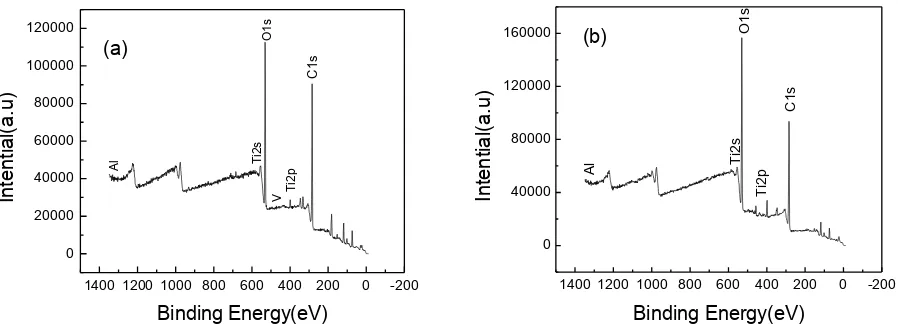
Fig. 7 shows the XPS survey spectra of the untreated and 30 min USSP-treated samples. The top surface is composed of Ti, Al, V, C, and O element. It’s reasonable to consider that titanium oxide is the major component of the passivation film.
1400 1200 1000 800 600 400 200 0 -200 0 20000 40000 60000 80000 100000 120000 In te n tia l(a .u ) Binding Energy(eV) (a) T i2 s O 1 s T i2 p C 1s V Al
1400 1200 1000 800 600 400 200 0 -200 0 40000 80000 120000 160000 In te n tia l( a .u )
Binding Energy(eV)
[image:8.596.62.511.568.734.2]Al T i2s O1s C 1s T i2p (b)
The high-resolution XPS spectra for O1s and Ti2p of the 30 min USSP-treated sample are shown in Fig. 8. The O1s is composed of two peaks, the hydroxyl OH− and O2− with the binding energy of 532.6 and 530.1 eV, respectively. The Ti2p is composed of three peaks: Ti4+2p1/2, Ti4+2p3/2, and Ti2+2P3/2, with the binding energy of 464.3, 458.3, and 455.1 eV, respectively. Depending on the characteristic of the binding energy, the combination modes of the elements are TiO2 and TiO. According to peak area, the relative contents of TiO2 and TiO are calculated to about 84.38% and 15.62%, respectively.
The high-resolution XPS spectra of O1s and Ti2p for the untreated sample are analyzed using the same method, and the relative contents of TiO2 and TiO are 76.88% and 23.12%, respectively. Compared with the untreated sample, the content of TiO2 is increased after USSP. Therefore, USSP treatment makes the surface film of Ti-6Al-4V alloy more compact.
545 540 535 530 525 520 4000 8000 12000 16000 20000 In te n si ty (a .u )
Binding Energy(ev)
O 1s
H2O
O2-475 470 465 460 455 450 445 0 4000 8000 12000 16000 In te n si ty (a .u )
Binding Energy(eV)
Ti 2p
Ti4+2p
3/2
Ti4+
2p1/2
Ti2+2p
[image:9.596.67.506.294.455.2]3/2
Figure 8. High resolution XPS peaks for O1s and Ti2p of the passive film on the surface
4. DISCUSSION
The mechanisms of grain refinement for severe plastic deformation are dependent on the crystal structure of materials and deformation conditions. The three possible mechanisms of nanograin formation are as follows: (1) twin–twin intersect[26], (2) twin–dislocation interact[27], and (3) dislocation movement[28,29]. In the present study, slipping is the predominant mode of deformation for the USSP. The dislocations in the glide plane will pile up when blocked by particles and then transform into high-density dislocation walls, which evolve into cellular structures, with a low dislocation density inside. The cellular walls gradually evolve into subgrain boundary during USSP treatment. Finally, the grains are subdivided into randomly orientated nanograins[30].
and the grain size in the surface is refined by USSP treatment. Thus, the microhardness in near surface layer is larger than that in the deep surface layer.
Azar et al.[31] reported that surface roughness induced by shot peening was deleterious to corrosion resistance, it increased corrosion current density and decreased the breakdown potential. Krawiec et al.[32] reported that the compressive residual stress induced on the sub-surface by laser shock peening process resulted in the excellent corrosion resistance of AA2050-T8 Al alloys. Peyre et al.[33] indicated that the deleterious effect of surface roughness and the beneficial effect of compressive residual stress on the corrosion resistance of 316L steel could be counterbalanced by shot peening.
The high-density grain boundaries and dislocations provide more diffusion channels for Ti4+ to transfer to the interface of oxidation film and environmental after USSP. The reaction presents:
Ti4++2OH- TiO2+2H+ (1)
The content of TiO2, the main composition of the passive film, increases by 7.5% after USSP. Moreover, TiO2 is more stable than TiO in terms of binding energy. Therefore, more stable passive films formed on the surface of the material after USSP treatment. However, plenty of Cl− can be absorbed by oxygen vacancy on the interface of oxidation film and environmental. The passive film can react with Cl- ions according to reaction:
TiO2+Cl-+2H2O [Ti(OH)3]Cl + OH- (2)
Intrui et al.[34] pointed that the high-density lattice defects of nanocrystallization could reduce Cl− adsorption and then decrease the sensitivity to pitting corrosion. Sun and Meng et al.[35,36] also reported that the disorder lattice structure and low energy in random high-angle grain boundary might decrease Cl− adsorption. In the present study, a stable passivation range is shown in the polarization curve indicates that the formation rate of the passive film is greater than its dissolution rate. Nevertheless, the formation of a passive film enhances the corrosion resistance of the material through USSP treatment.
5. CONCLUSIONS
A nanocrystalline surface layer is achieved on the surface of the Ti-6Al-4V through USSP treatment. The grain size increases from the top surface to the matrix.
Grain refinement, work hardening phenomenon and compressive residual stress make the surface microhardness increase observably.
The high-density dislocations and nanograin boundaries provide more channels for Ti4+ to transfer to the surface, which contributes to form stable passive films on the surface. The main composition of surface layer is TiO2.
ACKNOWLEDGEMENTS
This Project is financially supported by the National Natural Science Foundation of China (51274160), Innovation fund of the western material for phase two (XBCL-2-09), Shaanxi province as a whole the innovation project of science and technology plan projects (2015KTCQ01-80), Foundation of Shaanxi Science and Technology committee(2014JQ6211), Natural Science Foundation of Shaanxi educational committee (2013JK0871).
References
1. X. Wu, N. Tao, Y. Hong, B. Xu, J. Lu and K. Lu, Acta Mater, 50 (2002) 2075 2. U. Okan, A. C. Karaoglanli, R. Varol and A. Kobayashi, Vacuum, 110 (2014) 202 3. X. Y. Mao, D. Y. Li, F. Fang, R. S. Tan and J. Q. Jiang, Wear, 271 (2011) 1224 4. T. Wang, J. Yu and B. Dong, Surf. Coat.Technol, 200 (2006) 4777
5. U. Trdan, J. Grum, Corros. Sci, 59 (2012) 324 6. X. Liu, G.S. Frankel, Corros. Sci, 48 (2006) 3309
7. H. Lee, D. Kim, J. Jung, Y. Pyoun and K. Shin, Corros. Sci, 51 (2009) 2826
8. N. Zaveri, M. Mahapatra, A. Deceuster, Y. Peng ,L. J. Li and A. H. Zhou. Electrochim. Acta, 53 (2008) 5022
9. R. M. Abou Shahba, W. A. Ghannem, A. E. El-Shenawy, Int. J. Electrochem. Sci., 6 (2011) 5499 10.H. H. Huang, Biomaterials, 24 (2003) 275
11.R. Vera, S. Ossandón, Int. J. Electrochem. Sci., 9 (2014) 7131
12.A. Balyanov, J. Kutnyakova, N. A. Amirkhanova, V. V. Stolyarov, R. Z. Valiev, X. Z. Liao,Y. H. Zhao, Y. B. Jiang, H. F. Xu, T. C. Lowe and Y. T. Zhu, Scr. Mater, 51 (2004) 225
13.H. A. Johansen, G. B. Adams and P.V. Rysselberghe, J. Electrochem. Soc. 104 (1957) 339 14.R. Ittah, E. Amsellem and D. Itzhak, Int. J. Electrochem. Sci.,9 (2014) 633
15.L. L. G. da Silva, M. Ueda, M. M. Silva and E. N. Codaro, Surf. Coat. Technol, 201 (2007) 8136 16.S. Jelliti, C. Richard, D. Retraint, T. Roland, M. Chemkhi and C. Demangle, Surf. Coat. Technol.,
224 (2013)82
17.N. R. Tao, Z. B. Wang, W. P. Tong, M. L. Sui, J. Lu and K. Lu, Acta Mater, 50 (2002) 4603 18.K. Wang, N. R. Tao, G. Liu, J. Lu, and K. Lu, Acta Mater, 54 (2006) 5281
19.Z. B. Wang, J. Lu and K. Lu, Surf. Coat. Technol, 201 (2006) 2796 20.C. op’tHoog, N. Biribilis and Y. Estrin, Adv.Eng.Mater, 10 (2008) 579 21.N. N. Aung, W. Zhou, Corros.Sci, 52 (2010) 589
22.T. Balusamy, S. Kumar and T. S. N. Sankara Narayanan, Corros. Sci, 52 (2010) 3826 23.B. Panda, R. Balasubramaniam and G. Dwivedi, Corros. Sci, 50 (2008) 1684
24.L. Yuan, H. M. Wang, Electrochim. Acta, 54 (2008) 421
25.I. Cvijovic-Alagic, Z. Cvijovic, S. Mitrovic, V. Panic and M. Rakin, Corros. Sci. 53 (2011) 796 26.M. Sundararaman, L. Kumar, S. Banerjee, Characterisation of deformation microstructure beneath
machined surface and its role in the dimensional stability of alloy 718, in: E.A. Loria (Ed.), Superalloys 718, 625, 706 and Various Derivatives, TMS, Warrendale, 2001, pp. 709–719. 27.N. R. Tao, X. L. Wu, M. L. Sui, J. Lu and K. Lu, Mater. Res, 19 (2004) 1623
28.R. Ding, Z. X. Guo. Mater. Sci. Eng: A, 365 (2004) 172
29.Y. Pi, G. Agoda-Tandjawa, S. Potiron, C. Demangel, D. Retraint and H. Benhayoune, Nanosci. Nanotechnol, 12 (2012) 4892
30.K. Y. Zhu, A Vassel, F. Brisset, K. Lu and J. Lu, Acta Mater., 52 (2004) 4101 31.V. Azar, B. Hashemi and M. R. Yazdi, Surf. Coat. Technol., 204 (2010) 3546 32.H. Krawiec, V. Vignal, H. Amar and P. Peyre, Electrochim. Acta, 56 (2011) 9581
34.R. B. Inturi, Z. Szklarska-Smialowska, Corrosion, 48 (1992) 398
35.F. L. Sun, G. Z. Meng, T. Zhang, Y. W. Shao, F. H. Wang, C. F. Dong and X. G. Li, Electrochim. Acta, 54 (2009) 1578
36.G. Z. Meng, F. L. Sun, Y. W. Shao, T. Zhang, F. H. Wang, C. F. Dong and X. Li, Electrochim. Acta, 55 (2010) 2575