Eisen und Stahl,
jährliche Statistiken
Q LU O
o
o
ΓΜron and steel,
yearly statistics
Sidérurgie,
statistiques annuelles
* -k
EUROPÄISCHE KOMMISSION
EUROPEAN COMMISSION
COMMISSION EUROPÉENNE
eurostat
WÄ
THEMENKREIS 4 T H E M E 4 T H E M E 4
Industrie, Handel und Dienstleistungen
Industry, trade and services
D E
•
Eurostat hat den Auftrag, der
Europäischen Union
einen qualitativ hochwertigen statistischen Informationsdienst bereitzustellen.
EurOStat-Reihen: ein an den Bedarf aller Nutzer angepaßtes Angebot.
Pressemitteilungen:
Sie enthalten die Schlüsselzahlen zur EU,
zu ihren Mitgliedstaaten und ihren Partnern. Die Pressemitteilungen
werden kostenlos zur Verfügung gestellt. Unmittelbar nach ihrer
Veröffentlichung sind sie auch im Internet zu finden:
www.europa.eu.int/comm/eurostat/
Statistik kurzgefaßt:
aktuelle Zusammenfassungen der
wichtigsten Ergebnisse von statistischen Erhebungen, Studien und
Analysen.
Schlüsselindikatoren:
Diese Reihe enthält in einem handlichen
Buch von maximal 100 Seiten die wichtigsten Indikatoren zu einem
Themenbereich oder einem Teilbereich.
Panorama der Europäischen Union:
In dieser Reihe geht
es um die Merkmale und Trends in multisektoralen
Themenbereichen oder sektoralen Teilbereichen.
Methoden und Nomenklaturen:
Diese Veröffentlichungen
richten sich an Fachleute; sie beschreiben die Methoden und
Systematiken, die für einzelne Themen, Themenbereiche oder
Sektoren verwendet werden.
Detaillierte Tabellen:
Diese Veröffentlichungen richten sich an
Fachleute; darin sind ein Teil oder die Gesamtheit der statistischen
Angaben zu einem Thema, Themenbereich oder Sektor zu finden.
Studien und Forschung:
Zusammenfassungen der Ergebnisse
von Studien und Forschungsarbeiten im Bereich der europäischen
Statistik.
Kataloge:
Die kostenlosen Kataloge informieren rasch und genau
über das Produkt- und Dienstleistungsangebot von Eurostat.
Our mission is to provide the
European Union
with a high-quality statistical information service
Eurostat's Collections are adapted to the needs of all users.
E N
Press releases:
key figures on the EU, the Member States and
their partners. They are provided free of charge. They are also
available on the Internet as soon as they are published:
www.europa.eu.int/comm/eurostat/.
Statistics in focus:
up-to-date summaries of the main results
of statistical surveys, studies and analyses.
Methods and nomenclatures
are intended for specialists
who want to consult the methodologies and nomenclatures used
for a theme, a sub-theme or a sector.
Detailed tables:
statistical data for specialists compiled on a
theme, sub-theme or sector.
Key indicators:
the main indicators on a theme or sub-theme in
Studies a n d research
summarise the results of European
an easy-to-carry booklet. statistical studies and research and are intended for specialists.
Panorama of the European Union:
highlights the features
Catalogues:
free of charge rapid access to concise information
and trends of a multi-sectoral theme or a sectoral sub-theme. on Eurostat's products and services.
Notre mission est de fournir à
l'Union européenne
un service d'information statistique de qualité
Les collections d'Eurostat sont une offre adaptée aux besoins de tous les utilisateurs.
FR
Communiqués de presse:
les chiffres clés sur l'UE, les États
membres et leurs partenaires. Ils sont distribués gratuitement et
sont également disponibles sur Internet dès leur publication.
Statistiques en bref:
synthèses actualisées des principaux
résultats des enquêtes, des études et des analyses statistiques.
Indicateurs clés:
les principaux indicateurs concernant un
thème ou un sous-thème, sous la forme d'un livret facile à
emporter.
Panorama de l'Union européenne:
les caractéristiques et
les tendances d'un thème multisectoriel ou d'un sous-thème
sectoriel.
Méthodes et nomenclatures:
les méthodologies et les
nomenclatures relatives à un thème, un sous-thème ou un secteur.
Tableaux détaillés:
des données statistiques élaborées
concernant un thème, un sous-thème ou un secteur, destinées aux
spécialistes.
Études et recherche:
cette collection comprend les résultats
d'études et de recherches européennes en statistique et sont
destinées aux spécialistes.
Eisen und Stahl,
jährliche Statistiken
o
o
LL!
o
o
o
ÍN
ron and steel,
yearly statistics
Sidérurgie,
statistiques annuelles
EUROPÄISCHE KOMMISSION
EUROPEAN COMMISSION
COMMISSION EUROPÉENNE
Z_T73 ITnTÏI
THEr
— J/lfXHïZà
Indu
V I
I
i - ^ S 8 i
Indu
eurostat
THEMENKREIS 4 - THEME 4 - THEME 4
ustrie, Handel und Dienstleistungen
A
DE
Τ
EM
Unmittelbarer Zugriff auf harmonisierte statistische Daten
E u r o s t a t D a t a Shops: )
I n t e r n e t :
J
bieten ein umfassendes Angebot an
„maßgeschneiderten"
Dienstleistungen:
*
eine unmittelbare Bearbeitung von Informationsanfragen;
-k
eine garantiert schnelle und individuelle Antwort;
•
Wahl des Trägers, auf dem die statistischen Daten geliefert
werden.
Informationen können telefonisch, schriftlich, per Fax oder per
EMail angefragt werden.
Die wesentlichen statistischen Nachrichten aus der
Gemeinschaft
•
EuroIndikatoren: über 100 harmonisierte, vergleichbare
und kostenlose Indikatoren der Eurozone;
•
Pressemitteilungen: direkter Zugriff auf alle
Pressemitteilungen von Eurostat.
Weitere Informationen finden sich auf der InternetSite unter
www.europa.eu.int/comm/eurostat/
Immediate access to harmonized statistical data
E u r o s t a t D a t a Shops:
J
provide a wide range of
tailor-made services:
*
immediate information searches
·*■ rapid and personalised response
*
choice of data carrier
Information can be requested by phone, mail, fax or email.
I n t e r n e t :
J
Essentials on Community statistical news
•
Euro indicators: more than 100 indicators on the
eurozone; harmonized, comparable, and free of charge;
•
Press releases: direct access to all Eurostat press releases.
For further information, visit us on the Internet at:
www.europa.eu.int/comnn/eurostat/
Accès immédiat à des données statistiques harmonisées
FR
E u r o s t a t D a t a Shops:
offrent un large éventail de prestations
«sur mesure»:
·*■ la prise en charge immédiate de toute recherche d'information,
■*· la garantie d'une réponse rapide et personnalisée,
■*· le choix du support de fourniture des données.
Les informations peuvent être demandées par téléphone, par courrier,
par télécopie ou par courrier électronique.
Internet: J
l'essentiel de l'actualité statistique communautaire
*
Euroindicateurs: plus de cent indicateurs sur la zone euro
(harmonisés, comparables et disponibles gratuitement).
*
Communiqués de presse: accès direct à tous les
communiqués de presse d'Eurostat.
Pour plus d'informations, visitez le site Internet d'Eurostat:
www.europa.eu.int/comm/eurostat/
Zahlreiche weitere Informationen zur Europäischen Union sind verfügbar über Internet, Server Europa (http://europa.eu.int).
A great deal of additional information on the European Union is available on the Internet. It can be accessed through the Europa server
(http://europa.eu.int).
De nombreuses autres Informations sur l'Union européenne sont disponibles sur Internet via le serveur Europa (http://europa.eu.int).
Bibliografische Daten befinden sich am Ende der Veröffentlichung.
Cataloguing data can be found at the end of this publication.
Une fiche bibliographique figure à la fin de l'ouvrage.
Luxembourg: Office des publications officielles des Communautés européennes, 2001
ISBN 9289404604
© Europäische Gemeinschaften, 2001
© European Communities, 2001
© Communautés européennes, 2001
Printed in Luxembourg
Δ
EUROSTAT
L2920 Luxembourg — Tél. (352) 43 011 — Télex COMEUR LU 3423
e U r O S t a t
Rue de la Loi 200, B1049 Bruxelles — Tél. (322) 299 11 11
D E Eurostat ist das Statistische
Amt der Europäischen
Gemeinschaften. Es hat den Auftrag,
die Union mit europäischen
Statistiken zu versorgen, die
Vergleiche zwischen Ländern und
Regionen ermöglichen. Eurostat
konsolidiert und harmonisiert die in
den Mitgliedstaaten erhobenen
Daten.
Um die weite Verbreitung der
gewaltigen verfügbaren Datenmenge
zu gewährleisten und den einzelnen
Nutzern zu helfen, diese
Informationen richtig zu verwenden,
hat Eurostat sein Veröffentlichungs
und Dienstleistungsprogramm
geschaffen. Um sich gezielt an das
breite Publikum oder an Fachleute
wenden zu können, wurden für die
einzelnen Nutzergruppen spezielle
Reihen entwickelt.
Im Rahmen des neuen Programms
hat Eurostat eine WebSeite
entwickelt. Sie umfaßt ein breites
Angebot von OnlineInformationen
über die Erzeugnisse und
Dienstleistungen, Pressemitteilungen,
Kataloge, OnlineVeröffentlichungen
sowie Indikatoren für die Eurozone.
ΕΠΙ
Eurostat is the Statistical Office
of the European Communities.
Its task is to provide the European
Union with statistics at a European
level, that allow comparisons to be
made between countries and
regions. Eurostat consolidates and
harmonizes the data collected by the
Member States.
To ensure that the vast quantity of
accessible data is made widely
available, and to help each user
make proper use of the information,
Eurostat has set up a publications
and services programme.
As part of the new programme
Eurostat has developed its website.
It includes a broad range of online
information on Eurostat products and
services, newsletters, catalogues,
online publications as well as
indicators on the eurozone.
Yves Franchet
Director-General
F R
Eurostat est l'Office statistique
des Communautés
européennes. Il a pour tâche de
fournir à l'Union européenne des
statistiques au niveau européen,
qui permettent des comparaisons
entre pays et régions. Eurostat
consolide et harmonise les données
collectées par les États membres.
Pour assurer que l'ensemble des
données disponibles soit largement
accessible et pour aider chaque
utilisateur à faire bon usage de
toute cette information, Eurostat a
mis en place un programme de
publications et de services.
Dans le cadre du nouveau
programme, Eurostat a développé
son site Internet. Celuici comprend
toute une série d'informations
en ligne sur les produits et les
services d'Eurostat, ses bulletins
d'information, ses catalogues et ses
publications en ligne ainsi que des
indicateurs sur la zone euro.
Yves Franchet
Directeur-Général
INHALTSVERZEICHNIS
Tabelle Seite
1. Zusammenfassende Übersichten
1.1 Bevölkerung und Bruttoinlandsprodukt 2
1.2 Rohstahlbilanz (EU) 3
1.3 Ergebnisse aus der Jahreserhebung über die Tätigkeit der Industrie 4
1.4 Ergebnisse aus der Jahreserhebung über die Tätigkeit der Industrie 6
2. Produktionsgrundlagen
2.1 Abhängig Beschäftigte in der Eisen- und Stahlindustrie (Stand am Jahresende) 10
2.2 Abhängig Beschäftigte in der Gesamtindustrie (Jahresdurchschnitt) 10
2.3 Hüttenwerke nach Grössenklassen (EU) 11
2.4 Anteil der grössten Werke an der Rohstahlerzeugung (EU) 11
2.5 Hochöfen nach Grössenklassen (EU) 12
2.6 Stahlerzeugungsanlagen nach Kapazitätsklassen (EU) 12
2.7 Förderung und Bestände an Eisenerz (EU) 13
2.8 Verbrauch von Eisenerzsinter in Hochöfen 13
2.9 Verbrauch von Eisenerz nach Anlagen 14
2.10 Verbrauch von Manganerz nach Anlagen 25
2.11 Verbrauch von Roheisen, Spiegeleisen und Hochofenferromangan nach Stahlsorten (EU) 26
2.12 Verbrauch von Roheisen, Spiegeleisen und Hochofenferromangan (nach Mitgliedstaaten) 27
2.13 Stahlschrottbilanz (EU) 31
2.14 Verbrauch von Schrott nach Anlagen 32
2.15 Verbrauch von Schrott nach Verfahren (EU) 33
2.16 Erzeugung, Verbrauch und Versorgung an Schrott ¡n der Eisen- und Stahlindustrie und
in den Eisengiessereien 34
2.17 Verbrauch von Koks nach Anlagen in der Eisen- und Stahlindustrie 39
2.18 Verbrauch und Abgabe von Energie in der Eisen- und Stahlindustrie (EU) 40
2.19 Bezüge an festen Brennstoffen bei den Hüttenwerken (EU) (ohne Hüttenkokereien) 42
3. Erzeugung
3.1 Produktionsrelationen 44
3.2 Weltroheisenerzeugung 46
3.3 Kapazität und Kapazitätsauslastung der Roheisenerzeugungsanlagen 47
3.4 Roheisenerzeugung nach Mitgliedstaaten 48
3.5 Roheisenerzeugung nach Sorten 48
3.6 Weltrohstahlerzeugung 50
3.7 Die 30 grössten Rohstahlerzeuger der Welt 51
3.8 Kapazität und Kapazitätsauslastung der Rohstahlerzeugungsanlagen 52
3.9 Rohstahlerzeugung nach Mitgliedstaaten 54
3.10 Erzeugung von Rohblöcken , Strangguss und Flüssigstahl für Stahlguss 54
3.11 Rohstahlerzeugung nach Verfahren 55
3.12 Erzeugung von legiertem Stahl (Rohstahl) 58
3.13 Erzeugung von warmgewalzten Stahlerzeugnissen (EU) 59
3.17 Erzeugnisse aus Warmwalzerzeugnissen hergestellt (nach Mitgliedstaaten) 64
3.18 Flacherzeugnisse mit Oberflächenveredelung (nach Mitgliedstaaten) 65
3.19 Erzeugung von gutem Stahlguss 66
3.20 Erzeugung von Flüssigstahl für Stahlguss der unabhängigen Stahlgiessereien (EU) 66
3.21 Erzeugung der Industrien der ersten Verarbeitungsstufe von Eisen und Stahl 67
3.22 Erzeugung von Nebenprodukten der Hochöfen und der Stahlwerke 70
4. Werkslieferungen
4.1 Werkslieferungen an Stahl (EU) 73
4.2 Werkslieferungen an Blöcken und Halbzeug 74
4.3 Inlandslieferungen der Werke an Stahl nach Abnehmergruppen 75
4.4 Werkslieferungen an EGKS-Stahl 78
4.5 Werkslieferungen (EU) an Stahl und Marktverflechtungsrate (neue Abgrenzung) 80
5. Aussenhandel
5.1 Direkter und indirekter Stahlaussenhandel In Rohstahlgewicht 82
5.2 Aussenhandel in Rohstahlgewicht (EGKS - und nicht-EGKS Stahl) 86
5.3 Indirekter Aussenhandel In Rohstahlgewicht 90
5.4 Binnenaustausch und Aussenhandel an EGKS-Stahlerzeugnissen (EU) 94
5.5 Aussenhandelsvergleich 94
5.6 Aussenhandel an legierten Stählen nach Märkten (EU) , 95
5.7 Aussenhandel nach Erzeugnisgruppen (EGKS) (EU) ., 96
5.8 Aussenhandel der Vereinigten Staaten an Walzstahlerzeugnissen 98
5.9 Ausfuhr Japans an Walzstahlerzeugnissen 99
5.10 Binnenaustausch und Aussenhandel an Schrott (EU) 100
6. Stahlverbrauch
6.1 Marktversorgung mit Rohstahl 103
6.2 Stahlendverbrauch in Rohstahlgewicht 105
6.3 Tatsächlicher Stahlverbrauch (EU) nach Verbrauchsbereichen in Rohstahlgewicht 106
7. Investitionen
7.1 Bruttoanlageinvestitionen in der Industrie Insgesamt und In der Eisen- und Stahlindustrie 110
7.2 Investitionen in der EGKS-Eisen- und Stahlindustrie 111
7.3 Investitionen je Tonne Erzeugung und Kapazität in der Eisen- und Stahlindustrie 111
7.4 Investitionen in der EGKS-Eisen- und Stahlindustrie nach Erzeugungsanlagen (EU) 112
8. Preise, Durchschnittserlöse, Löhne
8.1 Index der Erzeugerpreise 114
8.2 Durchschnittserlöse im Schrottaussenhandel 115
8.3 Durchschnittserlöse im Eisen-und Stahlaussenhandel (EU) 116
8.4 Bruttostundenlöhne der Arbeiter in der Eisen- und Stahlindustrie (Insgesamt) 118
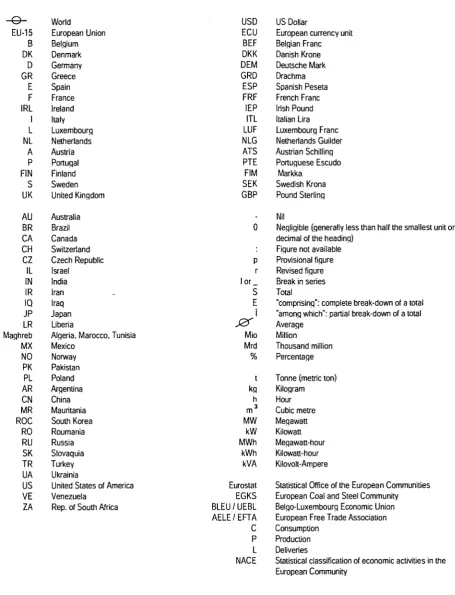
Zeichen und Abkürzungen
m
eurostat
θ
EU15
Β
DK
D
EL
E
F
IRL
I
L
NL
A
Ρ
FIN
S
UK
AU
BR
CA
CH
CZ
IL
IN
IR
IQ
JP
LR
Maqhreb
MX
NO
PK
PL
AR
CN
MR
ROC
RO
RU
SK
TR
UA
US
VE
ZA
Welt
Europäische Union
Belgien
Dänemark
Deutschland
Griechenland
Spanien
Frankreich
Irland
Italien
Luxemburg
Niederlande
Österreich
Portugal
Finnland
Schweden
Vereinigtes Königreich
Australien
Brasilien
Kanada
Schweiz
Tschechien
Israel
Indien
Iran
Irak
Japan
Liberia
Algerien, Marokko, Tunesien
Mexiko
Norwegen
Pakistan
Polen
Argentinien
China
Mauretanien
Südkorea
Rumänien
Russland
Slowakei
Türkei
Ukraine
Vereinigte Staaten von Amerika
Venezuela
Republik Südafrika
USD
ECU
BEF
DKK
DEM
GRD
ESP
FRF
IEP
ITL
LUF
NLG
ATS
PTE
FIM
SEK
GBP
USDollar
Europäische Währungseinheit
Belgischer Franken
Dänische Krone
Deutsche Mark
Griechische Drachme
Spanische Peseta
Französischer Franken
Irisches Pfund
Italienische Lira
Luxemburger Franken
Niederländischer Gulden
Österreichischer Schilling
Portugiesischer Escudo
Markka
Schwedisch Krona
Pfund Sterling
Λ 3 "
Mio
Mrd
Null (nichts)
0
Unbedeutend (im allgemeinen weniger als die Hälfte der
kleinsten in der betreffenden Reihe verwendeten Einheit
oder Dezimalzahlen)
:
Kein Nachweis vorhanden
ρ
Vorläufige Angabe
r
Berichtigte Angabe
I oder _
Bruch der statistischen Zahlenreihe
S
Insgesamt
E
"davon" : vollständige Aufgliederung einer Summe
"darunter" : teilweise Aufgliederung einer Summe
Durchschnitt
Million
Milliarde
%
Prozent
t
Metrische Tonne
kg
Kilogramm
h
Stunde
ni
Kubikmeter
MW
Megawatt
kW
Kilowatt
MWh
Megawattstunde
kWh
Kilowattstunde
kVA
Kilovoltampere
Eurostat
Statistisches Amt der Europäischen Gemeinschaften
EGKS
Europäische Gemeinschaft für Kohle und Stahl
BLEU / UEBL
BelgischLuxemburgische Wirtschaftsunion
AELE / EFTA
Europäische Freihandelsassoziation
C
Verbrauch
Ρ
Erzeugung
L
Lieferungen
NACE
Allgemeine Systematik der Wirtschaftszweige In den
Europäischen Gemeinschaften
m
Abgrenzung der EGKS-Stahlerzeuqnisse :
1. EGKS-Stahlerzeuqnisse
Rohstahl, Halbfertigerzeugnisse, warmgewalzte Fertigerzeugnisse, stranggegossene Erzeugnisse,
kaltgewalzte Bleche, überzogene Bleche (siehe im einzelnen Anlage i zum EGKS-Vertrag)
2. Nicht-EGKS-Stahlerzeugnisse
Stahlrohre, Erzeugnisse der Ziehereien und Kaltwalzwerke, Gießereierzeugnisse sowie die Erzeugnisse der Schmiede-, Preß-, und
Hammerwerke (d.h. sämtliche Stahlerzeugnisse, die nicht in der Anlage I zum EGKS-Vertrag als EGKS-Stahlerzeugnisse aufgeführt
oder dort ausdrücklich ausgeschlossen sind).
Anmerkungen :
1) Sofern nicht anders vermerkt, beziehen sich die Angaben für Deutschland ab 1991 auf ihren Gebietsstand ab 3. Oktober 1990.
2) Die Anwendung neuer Erhebungsgrundsätze ab 1. Januar 1992 in der EGKS-Stahlstatistik hat zur Folge, daß ab diesem Zeltpunkt
die Angaben bestimmter Tabellen nicht mehr mit den vorhergehenden Zeiträumen vergleichbar sind. Die Tabellen wurden demzufolge
neu konzipiert. Im einzelnen handelt es sich um folgende Änderungen:
2.1. Die Umstellung der Erfassung der Walzstahlerzeugung von der Netto- auf die Bruttoproduktion bedingt Änderungen in den
Tabellen 3.13 bis 3.22.
2.2. Die Anwendung der europäischen Norm "EN 10020" "Begriffsbestimmungen für die Einteilung der Stähle" bewirkt
Änderungen bei den Stahlqualitäten; wie in der kombinierten Nomenklatur werden die Begriffe "Grund- und Qualltätsstahl" sowie
"Edelstahl" durch "Unlegierten Stahl" bzw. "Legierten Stahl" ersetzt. Da diese Positionen auch inhaltlich neu definiert sind, ist eine
Vergleichbarkeit mit den früheren Qualitäten nicht mehr gegeben (Tab. 3.11/3.12 und 4.5).
3) Die Einführung von INTRASTAT im Rahmen der Europäischen Union für die Erfassung des Binnenaustauschs ab 1993 hat zu einem
Bruch im Vergleich mit früheren Jahren geführt. Dies betrifft die Tabellen 5.1, 5.2, 5.3, 5.4, 5.5, 5.6, 5.11,6.1, 6.2 und 8.4.
ACHTUNG
:
Aufgrund von Rundungen der entsprechenden Werte kann
es
dazu führen, daß
die
Summe
der
einzelnen
Länderdaten vom Gesamtwert für Europa abweicht, ebenso wie
die
Summe
der
einzelnen Monate
vom
Jahreswert abweichen kann.
CONTENTS
Table Page
1. Main summary tables
1.1 Population and gross domestic product 2
1.2 Crude steel balance (EU) 3
1.3 Results of the annual inquiry into industrial activity 4
1.4 Results of the annual inquiry into industrial activity 6
2. Production bases
2.1 Employees in the iron and steel industry (situation at end of year) 10
2.2 Employees in industry (yearly average) 10
2.3 Size of steelworks (EU) 11
2.4 Share of crude steel production by the largest works (EU) 11
2.5 Blast furnaces by dimensions (EU) 12
2.6 Steelmaking plants by capacity classes (EU) 12
2.7 Production and stocks of iron ore (EU) 13
2.8 Sinter consumption in blast furnaces 13
2.9 Consumption of iron ore by department 14
2.10 Consumption of manganese ore by department 25
2.11 Consumption of pig-iron, spiegel and high-carbon ferromanganese by steel category (EU) 26
2.12 Consumption of pig-iron, spiegel and high-carbon ferromanganese (by member States) 27
2.13 Steel scrap balance (EU) 31
2.14 Scrap consumption by department 32
2.15 Scrap consumption by steel process (EU) 33
2.16 Scrap production, consumption and supply in the iron and steel Industry and
In the iron foundries 34
2.17 Consumption of coke by department in the iron and steel industry 39
2.18 Consumption and deliveries of power in the iron and steel Industry (EU) 40
2.19 Receipts of solid fuels by iron and steelworks (EU)(excluding steelworks' coking plants) 42
3. Production
3.1 Production ratios 44
3.2 World pig iron production
~ .
46
3.3 Capacity and capacity utilization in pig Iron production plants 47
3.4 Pig iron production by Member States 48
3.5 Pig iron production by grade 48
3.6 World crude steel production 50
3.7 The 30 largest crude steel producers in the world 51
3.8 Capacity and capacity utilization in crude steel production plants 52
3.9 Crude steel production by Member States 54
3.10 Production of Ingots, continuously cast products and liquid steel for casting 54
3.11 Crude steel production by process 55
3.12 Production of alloy steels (crude steel) 58
3.13 Production of hot rolled steel products (EU) 59
3.14 Products obtained from hot rolled products (EU) 60
3.17 Products obtained from hot rolled products (by Member States) 64
3.18 Coated flat products (by Member States) 65
3.19 Production of sound steel castings 66
3.20 Indépendent steel foundries' production of liquid steel castings (EU) 66
3.21 Production of primary iron and steel processing industries 67
3.22 Production of blast furnace and steel furnace by-products 70
4. Works deliveries
4.1 Works deliveries of steel (EU) 73
4.2 Works deliveries of ingots and semis 74
4.3 Works home market deliveries of steel by consuming industries 75
4.4 Works deliveries of ECSC steel products 78
4.5 Works deliveries (EU) of steel and market interpénétration (new delimitation) 80
5. Foreign trade
5.1 Direct and indirect foreign trade of steel in crude steel equivalent 82
5.2 Foreign trade in crude steel equivalent (ECSC and non-ECSC steel) 86
5.3 Indirect foreign trade in crude steel equivalent 90
5.4 Internal trade and trade with third countries ¡n ECSC steel products (EU) 94
5.5 Comparison of foreign trade 94
5.6 Foreign trade of alloy steels by markets (EU) 95
5.7 Foreign trade by product groups (ECSC) (EU) 96
5.8 USA's foreign trade of iron and steel products 98
5.9 Japan's exports of Iron and steel products 99
5.10 Internal and foreign trade in scrap (EU) 100
6. Steel consumption
6.1 Apparent consumption of crude steel 103
6.2 Final consumption of crude steel 105
6.3 Real steel consumption (EU) by consuming branch In crude steel equivalent 106
7. Investments
7.1 Gross investments in fixed assets in all industries and In the iron and steel industry 110
7.2 Investments in the ECSC iron and steel industry 111
7.3 Investments per tonne produced and production capacity in the Iron and steel industry 111
7.4 Investments in the ECSC iron and steel Industry by production sectors (EU) 112
8. Prices, average values, wages
8.1 Index of producer prices 114
8.2 Average values In foreign trade of scrap 115
8.3 Iron and steel foreign trade average values (EU) 116
8.4 Gross hourly wages for manual workers In the iron and steel industry (total) 118
8.5 Hourly labour costs in the iron and steel industry (manual and non-manual workers) 118
Abbrevations and signs used
m
eurostat
θ
EU15
Β
DK
D
GR
E
F
IRL
I
L
NL
A
Ρ
FIN
S
UK
AU
BR
CA
CH
CZ
IL
IN
IR
IQ
JP
LR
Maqhreb
' MX
NO
PK
PL
AR
CN
MR
ROC
RO
RU
SK
TR
UA
US
VE
ZA
World
European Union
Belgium
Denmark
Germany
Greece
Spain
France
Ireland
Italy
Luxembourg
Netherlands
Austria
Portugal
Finland
Sweden
United Kingdom
Australia
Brazil
Canada
Switzerland
Czech Republic
Israel
India
Iran
Iraq
Japan
Liberia
Algeria, Marocco, Tunisia
Mexico
Norway
Pakistan
Poland
Argentina
China
Mauritania
South Korea
Roumania
Russia
Slovaqula
Turkey
Ukralnla
United States of America
Venezuela
Rep. of South Africa
USD
ECU
BEF
DKK
DEM
GRD
ESP
FRF
IEP
ITL
LUF
NLG
ATS
PTE
FIM
SEK
GBP
US Dollar
European currency unit
Belglan Franc
Danish Krone
Deutsche Mark
Drachma
Spanish Peseta
French Franc
Irish Pound
Italian Lira
Luxembourg Franc
Netherlands Guilder
Austrian Schilling
Portuquese Escudo
Markka
Swedish Krona
Pound Sterling
[image:13.595.60.516.68.664.2]Negligible (generally less than half the smallest unit or
decimal of the heading)
Figure not available
Ρ
r
lor
S
E
¡
J2T
Mio
Mrd
%
t
kq
h
m
3MW
kW
MWh
kWh
kVA
Eurostat
EGKS
BLEU/UEBL
AELE/EFTA
C
Ρ
L
NACE
Provisional figure
Revised figure
Break in series
Total
"comprising": complete breakdown of a total
"among which": partial breakdown of a total
Average
Million
Thousand million
Percentage
Tonne (metric ton)
Kilogram
Hour
Cubic metre
Megawatt
Kilowatt
Megawatthour
Kilowatthour
KilovoltAmpere
Statistical Office of the European Communities
European Coal and Steel Community
BelgoLuxembourg Economic Union
European Free Trade Association
Consumption
Production
Deliveries
Statistical classification of economic activities in the
European Community
All EU data for 1995 refers to EU-15 except where otherwise stated
m
Definition of ECSC iron and steel products :
eurostat1. ECSC products
Crude steel, semi-products, hot-rolled finished products, continuously cast products, cold rolled sheets and
plates, coated sheets (for more details see Annex I of the ECSC Treaty).
2. Products outside the ECSC
Steel tubes, cold-drawn, rolled and shaped products, foundry products In steel and cast iron, also products forged, stamped, pressed and
deep drawn (i.e. all Iron and steel products not listed as ECSC products in Annex I of the ECSC Treaty or which are expressly excluded
therefrom).
Notes
1) Unless otherwise stated, data for Germany - as from 1991 - refer to its territory as constitued from 3 October 1990.
2) The application of new survey principles from 1st January 1992 has rendered the data for certain tables no longer comparable with
those for previous periods. These tables have been reformulated. Specifically the following modifications are concerned:
2.1. The shift for rolled products from net production to gross production necessitates changes to tables 3.13 to 3.22.
2.2. The application of the European Norm "RN 10020" "Definition and classification of steels" Involves revision of steel qualities. As in
the Combined Nomenclature the terms "basic and quality steels" and "special steels" were replaced by "non-alloy steels" and "alloy
steels". Given that these positions have likewise been modified in their content, comparability with the former qualities is no longer
possible (tables 3.11/3.12 and 4.5).
3) The introduction of INTRASTAT for intra-community trade from 1993 has caused a break with previous years.
This has affected tables 5.1, 5.2, 5.3, 5.4, 5.5, 5.6, 5.11, 6.1, 6.2 and 8.4.
ATTENTION
:
Because data is rounded, the sum of individual countries may differ from the European
total ; similary the sum of different periods may differ from the annual total.
TABLE DE MATIERES
Tableau Page
1. Données récapitulatives principales
1.1 Population et produit Intérieur brut 2
1.2 Bilan d'acier brut (UE) 3
1.3 Résultats de l'enquête annuelle sur l'activité industrielle 4
1.4 Résultats de l'enquête annuelle sur l'activité industrielle 6
2. Bases de production
2.1 Salariés dans la sidérurgie (situation en fin d'année) 10
2.2 Total des salariés dans l'ensemble de l'Industrie (moyenne annuelle) 10
2.3 Taille des usines sidérurgiques (UE) 11
2.4 Part des plus grandes usines dans la production d'acier brut (UE) 11
2.5 Hauts fourneaux par dimensions (UE) 12
2.6 Installations des aciéries par classe de capacité (UE) 12
2.7 Production et stocks de minerai de fer (UE) 13
2.8 Consommation d'agglomérés de minerai dans les hauts-fourneaux 13
2.9 Consommation de minerai de fer par service 14
2.10 Consommation de minerai de manganèse par service 25
2.11 Consommation de fonte, de spiegel et de ferromanganese carburé par catégorie d'acier (UE) 26
2.12 Consommation de fonte, de spiegel et de ferromanganese carburé (par Pays membre) 27
2.13 Bilan de ferraille d'acier (UE) 31
2.14 Consommation de ferraille par service 32
2.15 Consommation de ferraille par procédé (UE) 33
2.16 Production, consommation et approvisionnement en ferraille dans la sidérurgie et dans les fonderies
de fonte 34
2.17 Consommation de coke par service dans l'industrie sidérurgique 39
2.18 Consommation et livraison d'énergie dans la sidérurgie (UE) 40
2.19 Réceptions de combustibles solides des usines sidérurgiques (UE) 42
3. Production
3.1 Ratios de production 44
3.2 Production mondiale de fonte brute 46
3.3 Capacité et taux d'utilisation des installations productrices de fonte brute 47
3.4 Production de fonte brute par Etat membre 48
3.5 Production de fonte brute par qualité 48
3.6 Production mondiale d'acier brut 50
3.7 Les 30 producteurs d'acier brut les plus importants du monde 51
3.8 Capacité et taux d'utilisation des installations productrices d'acier brut 52
3.9 Production d'acier brut par Etat membre 54
3.10 Production de lingots, produits de coulée continue et acier liquide pour moulage 54
3.11 Production d'aciers brut par procédé 55
3.12 Production d'acier allié (acier brut) 58
3.13 Production de produits d'acier laminés à chaud (UE) 59
3.14 Produits obtenus par transformation de produits à chaud (UE) 60
3.15 Produits plats obtenus par revêtement (UE) 60
3.16 Production de produits d'acier laminés à chaud (par pays membre) 61
3.17 Produits obtenus par transformation de produits à chaud (par Pays membre) 64
3.18 Produits plats obtenus par revêtement (par Pays membre) 65
3.19 Production de moulages d'acier parachevés 66
3.20 Production d'acier liquide pour moulage des fonderies d'acier indépendantes (UE) 66
3.21 Production des industries de la première transformation de la fonte et de l'acier 67
3.22 Production de sous-produits des hauts-fourneaux et des aciéries 70
4. Livraisons d'usines
4.1 Livraisons d'usines d'acier (UE) 73
4.2 Livraisons d'usines de lingots et demi-produits 74
4.3 Livraisons sur le marché national des usines d'acier par industrie consommatrice 75
4.4 Livraisons des usines de produits d'acier CECA 78
4.5 Livraisons d'acier des usines (UE) et taux d'interpénétration des marchés 80
5. Commerce extérieur
5.1 Commerce direct et Indirect d'acier en équivalent d'acier brut 82
5.2 Commerce extérieur en équivalent d'acier brut (acier CECA et non CECA) 86
5.3 Commerce indirect en équivalent d'acier brut 90
5.4 Echanges intracommunautaires et échanges avec les Pays tiers de produits sidérurgiques CECA (UE) 94
5.5 Comparaison du commerce extérieur , 94
5.6 Commerce extérieur d'aciers alliés par marchés (UE) 95
5.7 Commerce extérieur par groupe de produits (CECA) (UE) 96
5.8 Commerce extérieur des Etats-Unis de produits sidérurgiques 98
5.9 Exportations du Japon de produits sidérurgiques 99
5.10 Echanges intracommunautaires et commerce extérieur de ferraille (UE) 100
6. Consommation d'acier
6.1 Consommation apparente d'acier brut 103
6.2 Consommation finale d'acier brut 105
6.3 Consommation réelle d'acier brut (UE) par branche consommatrice en équivalent d'acier brut 106
7. Investissements
7.1 Investissements bruts en capitaux fixes dans l'ensemble de l'Industrie et dans l'Industrie sidérurgique 110
7.2 Investissements dans l'industrie sidérurgique CECA 111
7.3 Investissements par tonne produite et capacité de production dans l'industrie sidérurgique 111
7.4 Investissements dans l'Industrie sidérurgique CECA par secteur de production (UE) 112
8. Prix, valeurs unitaires, salaires
8.1 Indice des prix producteurs 114
8.2 Valeurs unitaires à l'importation de la ferraille 115
Abrévations et signes employés
m
eurostat
f e j
-EU15
Β
DK
D
GR
E
F
IRL
I
L
NL
A
Ρ
FIN
S
UK
AU
BR
CA
CH
CZ
IL
IN
IR
IQ
JP
LR
Maqhreb
MX
NO
PK
PL
AR
CN
MR
ROC
RO
RU
SK
TR
UA
US
VE
ZA
Monde
Union Européenne
Belgique
Danemark
Allemaqne
Grèce
Espagne
France
Irlande
Italie
Luxemburg
PaysBas
Autriche
Portugal
Finlande
Suède
RoyaumeUni
Australie
Brésil
Canada
Suisse
Tchéquie
Israël
Inde
Iran
Iraq
Japon
Liberia
Algérie, Maroc, Tunisie
Mexique
Norvège
Pakistan
Pologne
Argentine
Chine
Mauritanie
Corée du Sud
Roumanie
Russie
Slovaquie
Turquie
Ukraine
EtatsUnis d'Amérique
Venezuela
Rep. d'Afrique du Sud
USD
ECU
BEF
DKK
DEM
GRD
ESP
FRF
IEP
ITL
LUF
NLG
ATS
PTE
FIM
SEK
GBP
lou
Ρ
r
S
E
Mio
Mrd
%
t
kg
h
m
3MW
kW
MWh
kWh
kVA
Eurostat
CECA
BLEU/UEBL
AELE/EFTA
C
Ρ
L
NACE
Dollar US
Unité monétaire européenne
Franc belge
Couronne danoise
Mark allemand
Drachme
Peseta espagnole
Franc français
Livre irlandaise
Lire italienne
Franc luxembourgeois
Florin néerlandais
Schilling autrichien
Escudo portugais
Marka
Couronne suédoise
Livre sterling
Néant
Donnée très faible (généralement inférieure à la moitié de
dernière unité ou décimale des nombres mentionnés sous
la rubrigue)
Donnée non disponible
Donnée provisoire
Donnée rectifiée
Rupture de série
Total
"soit": présence de toutes les subdivisions du groupe
"dont": présence de certaines subdivisions détaillées
Moyenne
Million
Milliard
Pourcentage
Tonne métrique
Kilogramme
Heure
Mètre cube
Mégawatt
Kilowatt
Megawattheure
Kilowattheure
Kilovoltampère
Office statistique des Communautés européennes
Communauté européenne du charbon et de l'acier
Union économique belgoluxembourgeolse
Association européenne de libreéchange
Consommation
Production
Livraisons
Nomenclature générale des Activités Economiques dans le:
Communautés Européennes
Toute donnée EU à partir de 1995 est considérée EU-15, sauf indication spécifique.
Definition des produits sidérurgiques CECA :
1. Produits CECA
eurostat
Acier brut, demi-produits, produits finis laminés à chaud, produits coulés en continu, tôles laminées à froid, tôles
revêtues (pour plus de détails, voir annexe I du traité CECA).
2. Produits hors CECA
Tubes d'acier, produits étirés, tréfilés, laminés et profilés à froid, produits de la fonderie de fonte et d'acier ainsi
que produits forgés, estampés et emboutis (c'est-à-dire tous les produits sidérurgiques qui ne sont pas énumérés
en tant que produits CECA dans l'annexe I du traité CECA ou qui en sont exclus expressément).
Notes :
1) Les données pour l'Allemagne à partir de 1991 - sauf autres remarques spécifiques - partent de la situation
du 3 octobre 1990.
2) L'application de nouveaux principes de recensement, à partir du 1er janvier 1992, a eu pour conséquence
que les données pour certains tableaux ne sont plus comparables avec les périodes précédentes. Ces tableaux
ont été remaniés. Les modifications suivantes sont particulièrement concernées :
2.1. Le regroupement du recensement des produits de la production nette vers la production brute exige des
changements aux tableaux 3.13 à 3.22.
2.2. L'application de la Norme Européenne "EN 10020" "Définition et classification des nuances d'acier"
implique la révision des qualités d'acier. Comme dans la nomenclature combinée les notions "Aciers de base et
de qualité" et "Aciers spéciaux" sont remplacées par "Aciers non-alliés" ainsi que "Aciers alliés". Etant donné
que ces positions ont été modifiées également dans leur contenu, une comparabilité avec les qualités
antérieures n'est plus possible (tableaux 3.11/3.12 et 4.5).
3) L'introduction d' INTRASTAT dans le cadre de l'Union Européenne pour le recensement des échanges
intracommunautaires à partir de 1993 a causé une rupture avec les séries des années précédentes. Cela
concerne les tables 5.1, 5.2, 5.3, 5.4, 5.5, 5.6, 5.11, 6.1, 6.2 et 8.4.
ATTENTION :
Suite à des arrondis sur les valeurs, la somme des pays individuels peut différer du total européen, tout comme le total des périodes peut
différer du total annuel.
1
Zusammenfassende Übersichten
Main summary tables
1.1. Bevölkerung und Bruttoinlandsprodukt
Population and gross domestic product
Population et produit intérieur brut
m
eurostat
1990 1991 1992 1993 1994 1995 1996 1997 1998 1999 EU-15 Bevolken 348 388 366216 368 029 369712 370 984 371 891 373194 374150 374963 375 698EUR-11
ung 0
266 968 284389 285866 287 228 288174 288775 289810 290523 291107 291532
Β
9 961 10001 10045 10084 10116 10137 10156 10181 10203 10267 DK 5140 5154 5170 5189 5 206 5 233 5 263 5 285 5 304 5 322D
63 253 79984 80625 81156 81438 81678 81915 82035 82 047 82101 EL 10161 10 247 10322 10 379 10 426 10 454 10 476 10 499 10516 10 534 E 38 851 38 920 39 008 39 086 39150 39 210 39 270 39 323 39 371 39 418F IRL I
Population rt
56 735 57 055 57 374 57 654 57 900 57 899 58 375 58 610 58 851 58 860 (Χ 1000) 3 506 3 526 3 558 3 575 3 571 3 609 3 637 3 673 3714 3 755 56 719 56 750 56 859 57 049 57 203 57 301 57 397 57 512 57 588 57 646 L 382 387 393 398 404 410 416 421 426 432 NL 14 947 15 068 15182 15 290 15 381 15 460 15 531 15611 15 707 15812 A 7 729 7 813 7914 7 989 8 027 8 047 8 061 8 072 8 079 8 087 Ρ 9 899 9 871 9 867 9 881 9 897 9 916 9 927 9 945 9 968 9 989 FIN 4 986 5 014 5 042 5 066 5 088 5108 5125 5140 5153 5165
S
UKPopulation Ç]
8 559 8 617 8 668 8719 8 781 8 827 8 841 8 846 8 851 8 858 57 561 57 808 58 003 58196 58 397 58 602 58 804 58 997 59185 59 452
Bruttoinlandsprodukt (zu laufenden Preisen)
Produit intérieur brut (aux prix courants)
(Mrd ECU)Gross domestic product (at current prices)
1990 1991 1992 1993 1994 1995 1996 1997 1998 1999 4 787.2 5 232.7 5 482.3 5 529.1 5 795.8 6 451.4 6 781.1 7143.9 7 470.2 7 770.0 4 089.0 4472.1 4 714.5 4 759.1 4 980.2 5206.9 5434.8 5 554.0 5776.1 6 032.8 154.5 162.7 173.8 183.0 195.9 209.3 211.3 214.0 223.6 232.1 101.6 104.9 109.9 114.6 123.0 133.0 139.4 144.2 150.9 158.3 1182.2 1391.5 1523.8 1633.8 1729.4 1837.4 1845.2 1844.9 1910.3 1973.3 65.3 72.1 76.0 78.7 83.3 88.7 97.2 105.9 107.8 118.1 398.2 439.7 458.4 420.1 419.5 440.3 471.7 482.3 507.8 538.2 940.0 969.8 1018.8 1061.8 1117.3 1167.6 1205.1 1222.3 1274.5 1323.7 35.9 37.4 40.5 41.7 45.9 50.2 55.7 68.1 75.1 86.3 861.2 931.1 941.7 842.0 855.7 832.0 955.9 1011.1 1046.8 1090.7 8.5 9.2 10.0 11.3 12.6 13.5 13.9 14.5 15.5 16.3 222.5 234.4 247.8 266.1 281.9 303.2 310.9 319.2 336.7 353.4 125.6 134.8 144.7 156.0 165.3 176.7 179.7 181.9 189.8 198.6 54.3 63.3 72.9 71.4 74.2 80.6 85.9 90.0 95.7 102.6 106.2 98.1 82.1 72.0 82.5 96.3 98.5 105.8 111.6 117.6 180.8 193.5 191.4 158.6 167.1 176.8 198.3 201.0 202.6 209.2 763.1 816.6 808.7 804.7 857.1 845.9 911.4 1138.9 1220.4 1251.6
1.2. Rohstahlbilanz (EU)
Crude steel balance (EU)
Bilan d'acier brut (UE)
m
eurostat
(Moi)
1.
2.
3.
4.
5.
6.
7.
8.
9.
10.
S
11.
12.
13.
14.
15.
EGKS-Stahl / ECSC Steel / Acier CECA
Rohstahlerzeugung
Crude steel production
Production d'acier brut
Schrottverbrauch in den Walzwerken
Scrap consumption in rolling mills
Consommation de ferrailles dans les laminoirs
Einfuhren / Imports / Importations
Ausfuhren / Exports / Exportations
Nettoausfuhren / Net exports / Exportations nettes
Bestandsveränderungen bel Werken und Händlern
Stock variations by works and merchants
Variations des stocks dans les usines et chez les négociants
Sichtbarer Stahlverbrauch
Apparent steel consumption ( 1 + 2 5 ± 6 )
Consommation apparente d'acier
Nicht-EGKS-Stahl / Non-ECSC steel / Acier hors CECA
Einfuhren / Imports / Importations
Ausfuhren / Exports / Exportations
Nettoausfuhren / Net exports / Exportations nettes
Stahlerzeugnisse Steel products Produits d'acier
Sichtbarer Stahlverbrauch (EGKS und NichtEGKSErzeugnisse)
Apparent steel consumption (ECSC and nonECSC products)
Consommation apparente d'acier (produits CECA et hors CECA)
(1 + 2 · 5 ± 6 10)
Indirekte Einfuhren / Indirect Imports / Importations indirectes
Indirekte Ausfuhren / Indirect exports / Exportations indirectes
Nettoausfuhren / Net exports / Exportations nettes
Sichtbarer Stahlendverbrauch
Apparent final consumption of steel
Consommation apparente finale d'acier
(714) (D
1995
155.7
0.1
16.8
23.5
6.7
5.8
143.3
3.8
5.6
1.8
747.5
15.4
23.6
8.2
735.7
1996
146.6
0.0
12.3
28.3
15.7
-2.6
133.5
3.7
5.9
2.2
737.4
15.4
25.7
10.3
723.2
1997
159.8
0.0
14.5
25.6
11.1
0.3
149.0
3.9
7.8
3.9
745.7
14.8
27.9
13.1
735.9
1998
159.6
0.0
21.4
20.3
1.1
■0.4
755.7
4.7
7.3
2.6
755.5
18.1
28.2
10.1
U8.0
1999
155.1
0.0
20.8
19.9
0.9
0.7
756.7
4.5
5.6
1.1
755.6
19.4
25.9
6.5
750.2
1.3. Ergebnisse aus der Jahreserhebung über die Tätigkeit der Industrie
Results of the annual inquiry into industrial activity
Résultats de l'enquête annuelle sur l'activité industrielle
NACE Revl 27.10 : Erzeugung von Roheisen, Stahl und ferrolegierungen (gemäss EGKS-Vertrag) ohne Hüttenkokerei
NACE Revl 27.10 : Manufacture of basic iron and steel and of ferro-alloys (as defined in the ECSC Treaty) excluding integrated coke ovens NACE Revl 27.10 : Sidérurgie (selon le traité CECA) non compris les cokeries intégrées
m
eurosta
Unternehmen / Enterprises / Entreprises
Beschäftigte / Employees / Employés
Anteil an der Beschäftigtenzahl
der herstilenden Industrie
Share of employees in producing Industries
Part des employés dans l'industrie
manufacturière
Personalausgaben
Labour costs
Dépenses de personnel
Umsatz / Turnover / Chiffre d'affaires
Anteil am Umsatz der herstellenden
Industrie
Share of turnover in producing industries
Part du chiffre d'affaires dans l'industrie
manufacturière
Lagerbestände / Stocks / Stocks
Käufe von Roh, Hilfs und Betriebsstoffen
Purchases of raw and ancillary materials,
intermediate products, etc.
Achats de matières premières,
produits intermédiaires, etc.
Bruttowertschöpfung zu Faktorkosten
Gross valueadded at factor costs
Valeur ajoutée brute au coût des facteurs
Anteil a. d. Wertschöpfung der
herstellenden Industrie
Share of valueadded in producing industries
Part de la valeur ajoutée dans l'industrie
manufacturière
Bruttoproduktionswert
Gross production value
Valeur brute de la production
Einheit Unit Unité
(x W00)
(%)
(Mio ECU)
(Mio ECU)
(%)
(Mio ECU)
(Mio ECU)
(Mio ECU)
(Mio ECU)
(%)
Β
1996 1997
22.6 20.4
3.3 3.3
1072 1099
4983 5 220
3.4 3.5
3322.6 3778.4
1481 1510
3.9 3.9
4891 5 304
DK
1996
13
1.2
0.5
60
294
0.6
223.9
76
0.4
295
199710
1.2
0.5
58
302
0.5
215.9
80
0.4
293
D
1996 1997
50 51
85.2 81.2
1.8 :
4289 3963
18957 20 215
1.7 1.8
13891.0 15418.9
4 867 5 077
1.5 1.5
18 636 20 070
EL
1996 1997
10 :
2.0 2.1
2.2
66
534
2.4
402.5 :
45
0.9 :
508 :
E
1996 1997
266 225
23.0 22.5
721 721
5 902 6 431
2.1 2.1
4371.3 5032.3
1 396 1 537
1.8 1.9
5 721 6 352
F
1996
34
38.1
1.9
1900
9 920
1.5
7145.9
2 605
1.7
9 844 1997
35
38.2
1.3. Ergebnisse aus der Jahreserhebung über die Tätigkeit der Industrie
Results of the annual inquiry into industrial activity
Résultats de l'enquête annuelle sur l'activité industrielle
NACE Revl 27.10 : Erzeugung von Roheisen, Stahl und ferrolegierungen (gemäss EGKS-Vertrag) ohne Hüttenkokerei
NACE Revl 27.10 : Manufacture of basic iron and steel and of ferro-alloys (as defined in the ECSC Treaty) excluding integrated coke ovens
NACE Revl 27.10 : Sidérurgie (selon le traité CECA) non compris les cokeries intégrées
eurostat
IRL™
1996 1997
8 4
0.4 0.4
I
1996
89
36.2
2.5
1356
9 724
1.8
7290.4
2319
1.6
9612 1997
81
38.0
1.9
1632
13 447
2.5
10725.5
2 858
2.1
13 579
L
1996
6
5.2
2.7
274
1521
23.1
1249.1
295
15.3
1511 1997
5
4.3
2.5
253
1469
21.8
1198.7
324
15.8
1473
NL
1996 1997
12.2 12.0
: 566.0
2 239
: 1.4
1268.8
: 987
: 2.3
2 261
A®
1996 1997
: 14
12.7 12.5
: 343.0
1459
: 1.8
955.2
494
1.8
: 1395
Ρ
1996
23
2.2
1.2
45
422
0.7
349.7
56
0.4
411
199713
2.0
0.7
35
358
06
3063
60
04
368
FIN
1996 1997
26 21
7.2 7.1
3.9 3.5
376 382
2 263 2 340
33 3.1
1512.6 1675.2
749 743
3.6 3.2
2166 2 309
S
1996
20
13.6
4.7
596
3 085
2.7
2236.8
895
2.8
4 395 1997
10
13.6
3.9
563
3 385
2.7
2576.5
927
2.3
3 500
UK
1996 1997
45 64
36.5 35.2
2.3 1.8
1210 1515
8 753 10386
1.7 1.7
6449.9 7801.6
2152 2 464
1.5 1.4
8 620 10286
1.4. Ergebnisse aus der Jahreserhebung über die Tätigkeit der Industrie
Results of the annual inquiry into industrial activity
Résultats de l'enquête annuelle sur l'activité industrielle
m
eurostat
NACE Revl: 27.2; 27.22, 27.3; 27.5; 28.40
:
Einheit
Unit
Unité
Β
1996 1997
DK
1996 1997
D
1996 1997
EL
1996 1997
E
1996 1997
F
1996 1997
Unternehmen / Enterprises / Entreprises
Beschäftigte / Employees / Employés
Umsatz / Turnover / Chiffre d'affaires
(χ WOO)
(Mio ECU)
Herstellung von Rohren
13 17
0.9 0.9
158 162
2.7 :
381 440
NACE 27.2
162
43.2
6302
151
41.4
6219 13
0.8
116
90
4.7
863
94
5.0
911
39
15.9
2883
43
15.6
3105
Unternehmen / Enterprises / Entreprises
Beschäftigte / Employees / Employés
Umsatz / Turnover / Chiffre d'affaires
NACE 2722 Herstellung von Stahlrohren, Rohform-, Rohrverschluss-und Rohrverbindungsstücken aus Eisen Rohrverschluss-und Stahl
26 27
(x W00)
(Mio ECU)
71
¡932
712
74
4174
739
90 85
Unternehmen / Enterprises / Entreprises
Beschäftigte / Employees / Employés
Umsatz / Turnover / Chiffre d'affaires
NACE 27.3 Sonstige erste Bearbeitung von Eisen und Stahl, Herstellung von Ferroliegerungen (nicht EGKS)
(χ WOO)
(Mio ECU)
9.8 6.9
1733 1383
126
17.9
3481
128
17.7
3430 1.6
234
125
5.9
1280
133
6.0
1351
69 67
10.7 10.4
2075 2147
NACE 27.5
Unternehmen / Enterprises / Entreprises
Beschäftigte / Employees / Employés
Umsatz / Turnover / Chiffre d'affaires
(x W00)
(Mio ECU)
Giessereiindustrie
3.4 3.5
439 511
1
1
402
63.4
6378
390
60.8
6180 3
0.2
10
744
18.8
1712
734
19.6
1991
239 232
33.8 33.0
3088 3207
Unternehmen / Enterprises / Entreprises
Beschäftigte / Employees / Employés
Umsatz / Turnover / Chiffre d'affaires
NACE 28.40 Herstellung von Schmiede-, Press-, Zieh- und Stanzteilen,
gewalzten Ringen und Pulvermetallurgischen Erzeugnissen
(x 1000)
(Mio ECU)
1.6 1.8
246 248
0
532
70.0
7532
548
70.6
7815
1530
20.1
2002 1436
20.7
2061
447
39.6
4955
462
42.3
1.4. Ergebnisse aus der Jahreserhebung über die Tätigkeit der Industrie
Results of the annual inquiry into industrial activity
Résultats de l'enquête annuelle sur l'activité industrielle
m
eurostat
Erste Verarbeitungsstufe von Eisen und Stahl
First transformation of iron and steel
Première transformation de la fonte et de l'acier
IRL
1996 1997
I
1996 1997
L
1996 1997
NL
1996
Manufacture of tubes
14 16 126 115
18.9 15.2
4 227 3 944
0
7
241
Manufacture of steel tubes
12 16 326
18 689 :
4177 :
0 0
0
0
15
1 128
Other first processing of iron and steel production of non-ECSC ferro-alloys
(2)
2 3 240 242
14.1 13.4
3 997 3 435
(4)
4 4
Casting of metals
12 12
: 0.1
: 6
421 424
31.8 32.3
4194 4 338
2 2
45
469
Forging, pressing, stamping and roll forming of metal; powder metallurgy
6 8
0.2 0.3
13 22
566 591
30.7 32.4
4 766 5113
5 5
88
942
1997
10
269
25
5
107
40
492
80
1003
1) Nace 27.3 =27.10 + 27.3 3) Nace 28.40 = 28.40 + 28.51 2) Nace 2" .5 = 27.4 + 27.5 4) Nace 27 .3 = 27.: + 27.4 +
A
1996 1997
NACE 27.2
11
4.0
: 374
NACE 27.22
13 9
NACE 27.3
: 5
NACE 27.5
34
: 5.0
: 531
NACE 28.40
: 35
: 3.1
278 347
27.5
Ρ
1996
29
0.9
96
15
553
76
195
2.2
191
352
5.7
194
288
1.2
50
199721
7.3
96
12
442
79
143
2.4
337
329
6.8
280
364
1.7
60
FIN
1996
36
0.9
163
36
933
163
3
0.4
107
58
2.2
184
102
0.1
8.7
1997
36
0.9
157
36
867
157
3
0.4
124
66
2.4
239
Fe
79
0.2
22
S
1996 1997
UK
1996 1997
Fabrication de tubes
19 19
1.8 2.1
305 326
146 157
15.3 17.1
1 829 2 266
Fabrication de tubes d'acier
46 45 352 374
15 491 17 143
1894 2359
Première transformation de l'acier (non-CECA)
30 34
5.7 6.6
1 162 1 316
88 90
10.1 10.4
1 391 1 666
Fonderie
6 7
0.3 0.4
35 46
304 288
33.0 33.9
2 550 2 291
rge, emboutissage, estampage, métallurgie des poudres
10 26
1.4
14.1
385 428
30.3 33.6