Int. J. Electrochem. Sci., 8 (2013) 3794 - 3813
International Journal of
ELECTROCHEMICAL
SCIENCE
www.electrochemsci.orgControlled Size Nano-Polypyrrole Synthetized in
Micro-Emulsions as Pt Support for the Ethanol Electro-Oxidation
Reaction
F. López-García1, G. Canché-Escamilla2
, A. L. Ocampo-Flores3, P. Roquero-Tejeda3, L. C. Ordóñez1*
1
Unidad de Energía Renovable, Centro de Investigación Científica de Yucatán, C. 43 No. 130 Col. Chuburná de Hidalgo, Mérida, Yucatán, CP 97200.
2 Unidad de Materiales, Centro de Investigación Científica de Yucatán, C. 43 No. 130 Col. Chuburná
de Hidalgo, Mérida, Yucatán, CP 97200.
3 Facultad de Química, Universidad Nacional Autónoma de México. Av. Universidad 3000 México
D.F. CP 04510
*
E-mail: [email protected]
Received: 15 October 2012 / Accepted: 5 February 2013 / Published: 1 March 2013
Polypyrrole (PPy) nanoparticles were synthesized by chemical polymerization in a microemulsion system based on water, n–pentanol and sodium dodecyl sulfate (SDS) as surfactant, using pyrrole monomer and ferric chloride (FeCl3) as oxidizing agent. Additionally, PPy-fibers were obtained by
adding n–decane to the polymerization system. PPy structures were characterized by scanning electron microscopy (SEM). Fourier transform infrared spectroscopy (FTIR) analysis demonstrated that polymerization in microemulsion prevented the formation of a carbonyl function associated with overoxidation of polymer chains. The presence of dodecylsulfate as doping agent was confirmed by the S=O asymmetric stretching band in PPy-nanoparticles and PPy-fibers, while sulfur concentration determined by energy-dispersive X-ray spectroscopy (EDX) can be related to the PPy doping level. The PPy-nanoparticles conductivity was higher than that of other PPy tested materials tested. This is attributed to the doping agent nature and the structure of the polymer chains. Electrocatalysts of Pt supported on the PPy structures were obtained by reduction of H2PtCl6 by means of a NaBH4 solution.
Electrochemical measurements were performed in a three-electrode cell. Cyclic voltammetry results from these Pt/PPy catalysts, showed the characteristic peaks of ethanol electro-oxidation. Pt/PPy-nanoparticles presented lower charge transfer resistance (Rct) than a Pt/C catalyst. Ethanol electro-oxidation on Pt was enhanced by using nanostructured PPy as support. The PPy-nanoparticles showed better structural, conducting and electrochemical activity properties than other PPy synthesized materials tested as catalyst supports.
1. INTRODUCTION
Direct alcohol fuel cells (DAFCs) are energy conversion devices that directly transform the chemical energy of alcohol into electricity, through electro-catalytic reactions [1]. They have attracted much attention as an alternative to conventional internal combustion engines because low-molecular weight alcohols, as liquid fuels, have advantages compared to pure hydrogen, because they can be easily handled, stored and transported using the present gasoline infrastructure with only slight modifications [2, 3, 4]. Among alcohols, ethanol has been considered as a potential alternative fuel, mainly because it can be produced from biomass fermentation. Compared to methanol, it presents lower toxicity and price, and decreased crossover effect through solid electrolytes [5-7]. It also offers a comparable energy density (8.0 kWh/kg) to that of gasoline (10 kWh/kg) [3, 4, 8].
In direct ethanol fuel cells (DEFC), the alcohol is fed directly to the anode where it is electro-oxidized to CO2, while oxygen, generally from air, is reduced to form water at the cathode, both
electrodes are separated by a polymer electrolyte [1, 4]. Most of the active catalyst metals that may be useful in electrodes are unstable at low pH and/or high potentials. Platinum is currently considered as the best electrocatalyst since it remains active and stable in acid media [3, 8, 9]. However, the reaction mechanisms for the oxidation of alcohols involve several steps, and a number of adsorbed intermediates and byproducts. Formation of acetic acid occurs mainly at high electrode potentials (E > 0.8 V vs RHE), where the water molecule is activated to form oxygenated species at the Pt surface. Acetaldehyde formation occurs mainly at lower potentials (E< 0.6 vs RHE) [3]. Nevertheless, a large number of studies on the electrooxidation of ethanol, devoted mainly to identify the adsorbed intermediates have shown the presence of carbon monoxide strongly adsorbed at the electrode surface, among other species [3, 10]. Even though, platinum is a good catalyst for alcohol electro-oxidation, Pt-based electrodes are rapidly poisoned by a strongly adsorbed intermediate like CO [3, 6, 7, 11, 12]. Efforts to mitigate the Pt poisoning include the formation of Pt alloys [13] with metals or their oxides like Mo [1], Ru [6], Ir [14] or Sn [15], and the development of new and efficient supports to achieve high dispersion, utilization, activity and stability of catalysts [2, 12, 13, 16]. Carbon black has been generally used as catalyst support in fuel cells applications; however, carbon is prone to electrochemical oxidation, which leads to exfoliation of metal catalyst particles from the support [13, 17].
The interaction mechanism between PPy and Pt has not been clearly elucidated yet. Zhang et al. [2] evaluated a Pt/PPy-C catalyst for the methanol electro-oxidation reaction, obtaining higher current density compared to a polymer-free catalyst. However, the activity improvement could be attributed to an electronic interaction between Pt particles and nitrogen atoms in PPy. In this hypothesis, the platinum electron density changes and consequently, the adsorption strength of the intermediate species could be diminished. Bouzek et al [22] prepared different Pt/PPy composites varying Pt loading and distribution in the polymer film. Those catalysts with a three dimensional distribution of Pt did not present any methanol electro-oxidation activity. This null activity was attributed to the synthesis method, low Pt surface concentration and, to the insertion of Pt into the polymeric particles, leaving few available Pt active sites for the alcohol electrooxidation reaction. They also deposited Pt onto a pre-synthesized PPy film and, from chronoamperometry tests at 0.2 V (vs SCE), they observed that Pt/PPy presented a higher stability, if compared with that of a Pt carbon supported material. This was attributed to a CO poisoning inhibition, due to the Pt interaction with the PPy support.
In this work, PPy materials were synthesized via microemulsion polymerization using sodium dodecyl sulfate as surfactant and FeCl3 as oxidant. These materials were used as Pt supports. The
resultant Pt/PPy catalysts were characterized and evaluated for the ethanol electro-oxidation reaction through CV and EIS electrochemical measurements.
2. EXPERIMENTAL
2.1 Synthesis of PPy supports
Pyrrole received from Aldrich® was distilled. FeCl3, n-pentanol, n- decane, sodium dodecyl
sulfate (SDS) were used as obtained from Alfaesar. Three microemulsion systems were employed for pyrrole polymerization [23]. In these systems were changed the surfactant, monomer and oxidant concentrations, as well as, the organic phase composition. Reaction was carried out under nitrogen atmosphere with a vigorous agitation for 12 h. For the system 1 preparation, 12 g of SDS surfactant were dissolved in 364 g of H2O (type I 18.2 MΩ/cm) and were added, with a slow dripping, to 4 g of
n–pentanol. The finally composition for this emulsion was 96 % water, 3% SDS and 1% n–pentanol (wt %). Subsequently, 2110 µL of pyrrole were introduced by means of 10 µL drops. Afterwards, a solution of 0.9854 g of FeCl3 dissolved in 20 g of water, were dropwise added. The color solution
changed from yellow to black. Once the reaction time was reached, PPy particles were precipitated by breaking the microemulsion system with a methanol excess. Particles were collected by centrifugation at 4000 rpm for 10 minutes, washed several times with water and dried under vacuum at 60° C for 24 hours. In system 2, a 15% wt SDS solution (SDS15%) was added to a mixture with 120 g of n–pentanol
and 80 g of n–decane. The composition of this system was 50% SDS15%, 30% n–pentanol and 20% n–
decane (% wt). Then, the oxidizing solution with 3.6818 g of FeCl3 in 170 g of water was incorporated
[image:4.596.86.512.161.249.2]
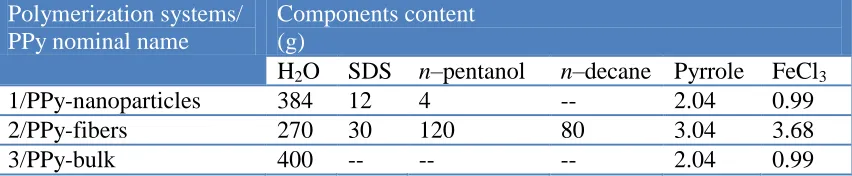
dropwise added as in system 1, without SDS or n–pentanol. The composition of all polymerization systems is summarized in Table 1.
Table 1. Nominal composition of polymerization systems and assigned designations of PPy structures
Polymerization systems/ PPy nominal name
Components content (g)
H2O SDS n–pentanol n–decane Pyrrole FeCl3
1/PPy-nanoparticles 384 12 4 -- 2.04 0.99
2/PPy-fibers 270 30 120 80 3.04 3.68
3/PPy-bulk 400 -- -- -- 2.04 0.99
2.2 Synthesis of Pt/PPy electrocatalysts
All Pt/PPy electrocatalysts were formulated with 80 wt% of the support material and 20 wt% of active phase. The synthesis was carried out by placing the appropriated quantities of PPy support and H2PtCl6 in 80 mL of 2-propanol/H2O (50/50 vol %) solution. The suspension was sonicated for 20
minutes and then vigorously stirred for 3 hours at room temperature. Once the contact time was reached, 100 mL of 0.5 M NaBH4 solution were added by slow dropping. After 1 h, the catalysts were
precipitated by centrifugation and washed with water. Finally, the Pt/PPy materials were dried at 60° C in a convection oven under vacuum for 24 h. Pt/C catalyst was synthesized following the same procedure and using Vulcan carbon as support.
2.3 Fourier transform infrared spectroscopy (FTIR)
PPy particles were analyzed by FTIR in a frequency range from 4000 to 400 cm-1 using a Nicolet Protege 460 spectrometer with a 4 cm-1 resolution. The spectra were collected by mixing the sample with KBr.
2.4 Scanning Electron Microscopy
A variable operating pressure JEOL JSM—6360 LV scanning electron microscope, operated at 20 keV, equipped with electron dispersive X-ray (EDX) device was used for SEM-EDX studies. 0.01 g of PPy sample were dispersed in 10 mL of water in an ultrasound bath for 10 minutes. 10 µL of this dispersion were placed onto a carbon film and Au coated prior to imaging.
2.5 Transmission electron microscopy
2.6. Conductivity
Conductivity measurements were performed with a two-electrode configuration cell at ambient temperature. 100 mg of each PPy support were compressed to form a pellet and it was placed between two flat circular 316 stainless steel electrodes with a transversal area of 1.76 cm2. The cell conformation was SS│PPY│SS. The AC impedance spectrum was recorded in frequency range from 10 kHz to 1 Hz with a 5 mV of rms amplitude using a potentiostat/galvanostat Autolab PGSTAT 302 equipped with a FRA module. The intercept of the impedance at high frequency with the real Z' axis represented the ohmic resistance R, which was calculated using the Electrochemical Circle fit analysis tool. The conductivity, σ, was calculated from the next equation:
where l is the distance between the upper and lower SS electrodes (pellet thickness) in cm, and A represent the pellet transversal surface area [24].
2.7. Electrode preparation
The working electrodes were prepared by mixing graphite paste with 1 mg of the PPy or Pt/PPY sample to be analyzed. The mixture was place on the surface of a 0.5 cm diameter graphite disk.
2.8. Electrochemical measurements
The electrochemical experiments were carried out at ambient temperature using an Autolab PGSTAT 302 potentiostat/galvanostat equipped with a FRA module. A typical three-electrode cell was used with a saturated mercury/mercurous sulfate electrode (Hg/Hg2SO4/K2SO4 (sat)) as reference, a
graphite bar as counter electrode and each synthesized material as working electrode. All electrode potentials throughout this paper are referred to the reversible hydrogen electrode (RHE) scale. A 0.5 M H2SO4 solution was used as electrolyte supported whereas the working solution consisted of 1.0 M
ethanol + 0.5 M H2SO4. Previous to electrochemical tests, the catalytic materials were activated in a
nitrogen-outgassed 0.5 M H2SO4 electrolyte, by potential cycling from 0.1 to 1.0 V vs. RHE at a scan
values were obtained from impedance measurements at 0.3 V vs RHE in a 0.5 M H2SO4 solution, with
a frequency scan from 10 kHz to 0.1 Hz and with an AC amplitude of 5 mV. Electrochemical impedance spectroscopy (EIS) tests were collected in a potential window from 0.1 to 1.0 V vs RHE spaced at 0.1 V intervals and allowing 60 s for equilibration in each potential. The effective amplitude (rms values) of the AC signal employed was 5 mV and 80 frequencies from 100 kHz to 0.01 Hz were recorded at logarithmic intervals. NOVA 1.6 software was employed for data analysis.
3. RESULTS AND DISCUSSION
3.1 Physical characterizations of PPy structures an Pt/PPy electrocatalysts 3.1.1 Morphology and particle size (SEM and TEM)
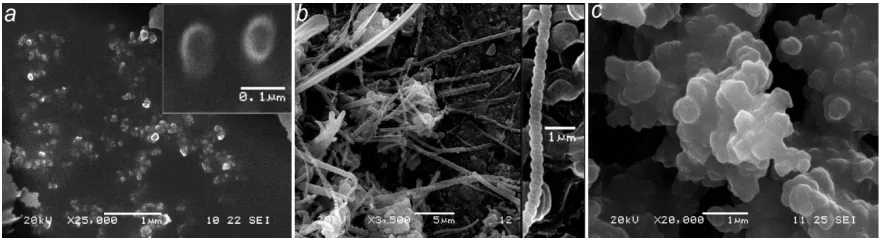
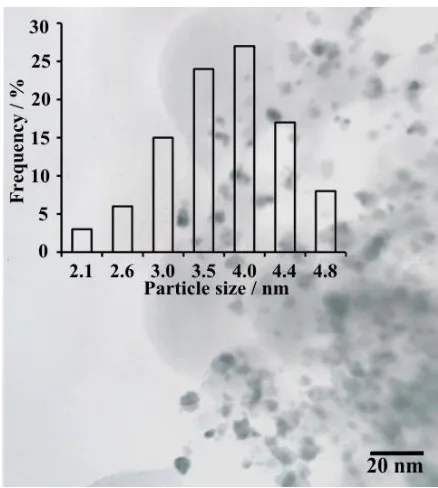
[image:6.596.78.518.581.700.2]Figure 1 shows the SEM images of the different obtained PPy structures. Depending on the system composition, distinct PPy structures were formed. From polymerization in microemulsion with system 1, PPy nanoparticles with uniform morphology and size were obtained. SDS in aqueous solution forms spherical micelles, whose size decreases by the addition of cosurfactants as n–pentanol [26, 27]. The use of this alcohol in polymerization in microemulsion might favor the production of structures with controlled size, since it has been reported that n–pentanol can promote the dispersion and migration of monomers into the micelle inner space [28], where the polymerization takes place. TEM micrographs clearly showed the spherical shape of PPy nanoparticles, even when some aggregates were formed (Figure 2). Although the main frequency particle diameter was 53 nm, an important number of smaller particles (34, 40 and 47 nm) was observed. This PPy structure size was similar to that of carbon particles commonly used as catalyst support for fuel cells [17].
Polymerization system 2 generated PPy fibers with an average diameter of 384 nm and a coil-like structure. It has been reported that the use of anionic amphiphilic templates allows the obtention of helical structures [29]. Hence, the thickness and shape of the PPy fibers was probably influenced by the used amounts of n–decane, pyrrole and SDS in the polymerization system.
Finally, in system 3, PPy synthesis was simply carried out in an aqueous medium, free of surfactant that could control particle shape. Although it has been reported that the synthesis in aqueous solution generates micrometric particles [30], no controlled size and no morphological arrangement were obtained in this PPy structure even when the monomer addition was with 10 µL drops and constant stirring was kept during the synthesis procedure.
Figure 2. TEM micrographs and histogram of PPy nanoparticles.
[image:7.596.195.401.182.349.2]TEM micrographs of PPy-nanoparticles supported Pt are presented in Figure 3. It can be seen that the PPy-nanoparticles kept the spherical shape after platinum deposition. Pt nanoparticles were homogeneously dispersed on the PPy surface with an average size of 4 nm, similar to commercial Pt/C commercial catalysts with a platinum particle size around 4.5 nm [21].
[image:7.596.188.407.476.720.2]
3.1.2 Elemental analysis
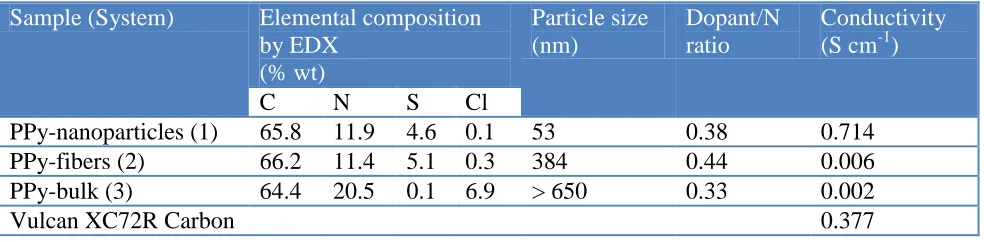
Elemental analysis confirmed the presence of C, N, S and Cl in PPy samples (Table 2). According to these results, Cl- anions can be considered as dopant of PPy-bulk, while PPy-fibers and PPy-nanoparticles were dopped by the dodecylsulfate (DS) anion. This is in agreement with the results obtained by Hoshina et al [31], who synthesized PPy by emulsion polymerization, using anionic or cationic surfactants for the emulsions preparation and FeCl3 as oxidant. They reported that when
cationic surfactants were added, the dopant agent was the Cl- ion, and when surfactants such as SDS were incorporated, DS anions doped PPy chains.
[image:8.596.54.546.411.532.2]The N/Cl ratio in PPy bulk samples was 2.96, suggesting that there was a chloride ion per three pyrrole rings in the backbone. In the case of PPy nanoparticles, the N/S ratio was 2.59, indicating that 2 DS anions were incorporated each 5 pyrrole rings in the PPy chains. For PPy fibers the N/S ratio was 2.25. The amount of counterions present in the chains of PPy materials is in accordance to that reported by several authors [32, 33]. If the opposite ratio is considered (dopant/N), a doping level of 0.33 was obtained for PPy bulk sample, which has been considered to be the optimum doping level for PPy. Nanoparticles and fibers revealed doping levels of 0.38 and 0.44, respectively. The doping level depends on the parameters used in the reaction system, when it is larger than 0.5, repulsion effects can occur between charged species [33].
Table 2. Composition and physical properties of PPy structures.
Sample (System) Elemental composition
by EDX (% wt)
Particle size (nm)
Dopant/N ratio
Conductivity (S cm-1)
C N S Cl
PPy-nanoparticles (1) 65.8 11.9 4.6 0.1 53 0.38 0.714
PPy-fibers (2) 66.2 11.4 5.1 0.3 384 0.44 0.006
PPy-bulk (3) 64.4 20.5 0.1 6.9 > 650 0.33 0.002
Vulcan XC72R Carbon 0.377
Pt loading in electrocatalysts was measured by EDX analysis, resulting in 20.91 % and 18.88 % of platinum in Pt/PPy-nanoparticles and Pt/PPy-fibers respectively, while the Pt/PPy-bulk sample showed only 6.78% of the metal. The interaction between Pt–PPy has not been yet elucidated, however, Zhang et al [2] have reported that the nitrogen in the pyrrole rings can act as nucleation centers for the formation of Pt nanoparticles.
3.1.3 FTIR
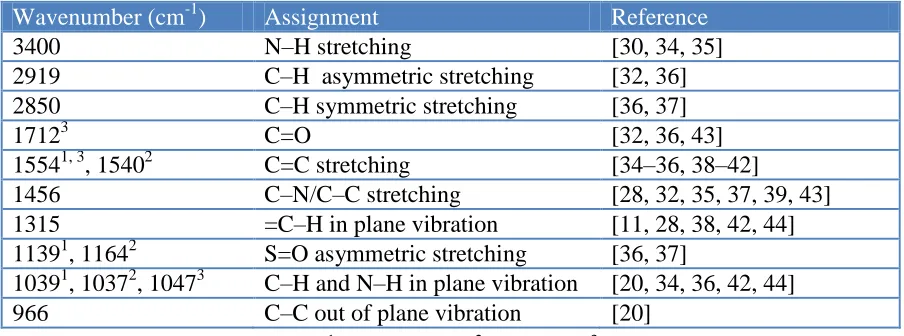
vibrations respectively, of methylene and methyl groups in the DS dopant. The presence of these peaks in PPy bulk could be attributed to C–H bonds in the backbone [30]. The band at 1554 cm-1 corresponds to the ring stretching vibrations of the C=C bond [35, 36, 38–42]. This band is red-shifted to 1540 cm-1 in PPy fibers spectrum, which could be attributed to the high content of DS in this sample and its influence on the ring vibrations of PPy [34, 36]. The band at 1456 cm-1 arises from C–N/C–C stretching modes in the ring [28, 32, 35, 37, 39, 43]. The peak at 1315 cm-1 corresponds to the plane vibration of =C–H [11, 28, 38, 42, 44]. The bands at 1164 cm-1 in the case of fibers and 1139 cm-1 for nanoparticles, are due to the asymmetric stretching vibration of S=O bond of the dopant [36, 37]. The bands at 1047 cm-1, 1037 cm-1 and 1039 cm-1 in PPy bulk, fibers and nanoparticles spectra, respectively, correspond to C–H and N–H in plane vibration modes [20, 34, 36, 42, 44]. The band corresponding to the C–C out of the plane ring deformation vibration is situated at 966 cm-1 [20] (Table 3).
[image:9.596.92.507.389.723.2]The band at 1712 cm-1 in PPy-bulk is due to the carbonyl group. The presence of this functional group indicates that the polymer chain is overoxidized [32, 36, 43], possibly due to a nucleophilic attack of water molecules to the PPy backbone [30, 36]. This band is not present in fibers and nanoparticles because the micelles formed by the presence of the surfactant are able to prevent overoxidation by water molecules [36].
Table 3. FTIR characteristic peaks of PPy spectrum.
Wavenumber (cm-1) Assignment Reference
3400 N–H stretching [30, 34, 35]
2919 C–H asymmetric stretching [32, 36]
2850 C–H symmetric stretching [36, 37]
17123 C=O [32, 36, 43]
15541, 3, 15402 C=C stretching [34–36, 38–42]
1456 C–N/C–C stretching [28, 32, 35, 37, 39, 43]
1315 =C–H in plane vibration [11, 28, 38, 42, 44]
11391, 11642 S=O asymmetric stretching [36, 37]
10391, 10372, 10473 C–H and N–H in plane vibration [20, 34, 36, 42, 44]
966 C–C out of plane vibration [20]
Bands present in PPy samples: 1nanoparticles, 2fibers, and 3bulk.
3.1.4 Conductivity
The measured conductivity of the PPy supports was compared with that of Vulcan XC–72R carbon (Table 2). PPy nanoparticles presented the highest conductivity. This nanostructured material was doped with DS anions and presented a doping level of 0.38. It has been reported that amphiphilic sulfates as dopants provide higher conductivities than many other counter ions [31, 45]. Besides doping, nanosized dimensions [38] and microemulsion-synthesis features, such as the use of n-pentanol, can lead to an ordered molecular arrangement and an enhancement in electron transport [28, 40, 46]. PPy conductivity increases as the doping level is raised [43]. However, a dopant excess can produce repulsion effects between charged species and act as a steric barrier against charge transport [32, 33, 43]. PPy fibers could thus present a decreased value in conductivity due to the doping extent. Moreover, since molecular structure influences conductivity [28], both, fiber and bulk samples could present arrangements which disfavored this property. The lowest conductivity value was observed with PPy-bulk, possibly because of the presence of carbonyl groups in the polymeric chains, detected by FTIR analysis. This chemical defect is able to interrupt the π-conjugated system and the transport of electrons through the backbone chain [30, 43, 46]. PPy bulk was also doped with Cl- anions which can be fixed to PPy chains and act as electron traps [47].
3.2 Electrochemical measurements 3.2.1 Cyclic voltammetry
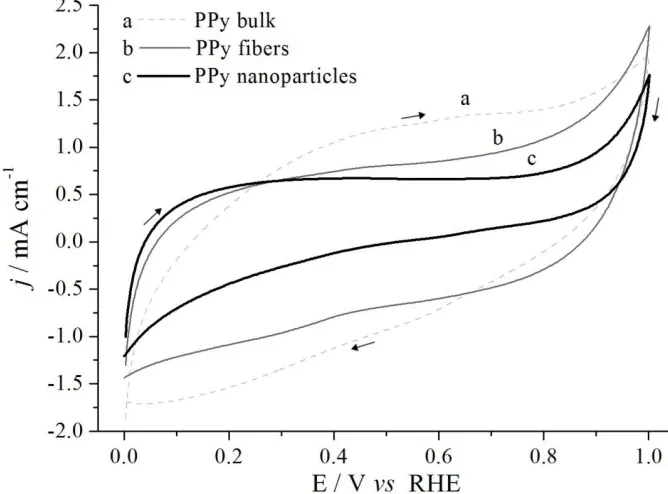
Where A– represents the counterion. This doping process is perceived in the CV by an increment in current density, which took place in a broad potential range from 0 to 0.72 V. In the return scan, towards negative potentials, the reverse process is observed (dedoping). Polymer is reduced and the counterions incorporated during the synthesis and those from the electrolyte are expelled [48, 50]:
In the case of nanoparticles (Figure 5c), the current density was increased in the forward sweep in a short potential range (0 to 0.3 V), whereas, in the backwards scan, the current density changed rapidly and kept descending gradually. This response appears to be highly influenced by the dopant. According to Weidlich et al [49], the DS anions were not expelled from PPy chains during the polymer reduction because of their size, so, cations from the electrolyte were quickly incorporated into PPy to preserve electroneutrality. Thereby, these H+ are rapidly ejected fast from the polymer matrix during PPy oxidation.
PPy fibers presented a similar voltammogram to that of nanoparticles (Figure 5b) since both PPy structures contained the same dopant. The variations in both CVs can be attributed to differences in structural arrangements of PPy chains.
[image:11.596.128.462.459.706.2]Figure 6 displays the CV of platinum nanoparticles deposited onto the different PPy structures as well as on vulcan XC72R carbon (Pt/C). As expected, typical electrochemical behavior of Pt/C in acid media is observed.
Figure 5. Cyclic voltammograms in 0.5 M H2SO4 at a scan rate of 10 mVs-1 for a) PPy-bulk (3), b)
In the positive potential scan (Figure 6d), peaks corresponding to proton desorption from different Pt sites are observed between 0 and 0.2 V [51]. The peak at 0.49 V is associated to the oxidation of oxygen-containing groups present on the carbon support. At potentials greater than 0.7 V, the formation of Pt hydroxides occurs and, at higher potentials, form Pt(II) oxide, as follows [1, 52]:
In the backward potential scan (towards negative potentials), Pt was reduced from Pt(II) to Pt(0) reaching a maximum at 0.71 V. The hydrogen adsorption took place at potentials lower than 0.2 V [1, 52]. In the Pt/PPy electrocatalysts, the associated carbon oxidation peak disappears. All Pt regions are attenuated due to the polymer doping/dedoping process which can be associated to the change in the double layer capacitance in Pt/PPy catalysts [20].
Figure 6. Cyclic voltammograms in 0.5 M H2SO4 at a scan rate of 100 mVs-1of a) Pt/PPy-bulk (3), b)
Pt/PPy-fibers (2), c) Pt/PPy-nanoparticles (1), d) Pt/C.
fibers catalysts (Figures 6b) showed a more pseudocapacitive behavior than Pt/PPy-nanoparticles (Figure 5 c). This was, probably related to resistances of charge storage-release in the PPy doping process caused by the polymer support morphology [22, 49, 53, 54].
[image:12.596.146.445.337.569.2]
3.2.2 Electro-active area
The electro-active area (EAA) for each catalyst was determinated by integrating the proton adsorption/desorption region and using the theoretical charge for hydrogen adsoption = 210C cm
-2
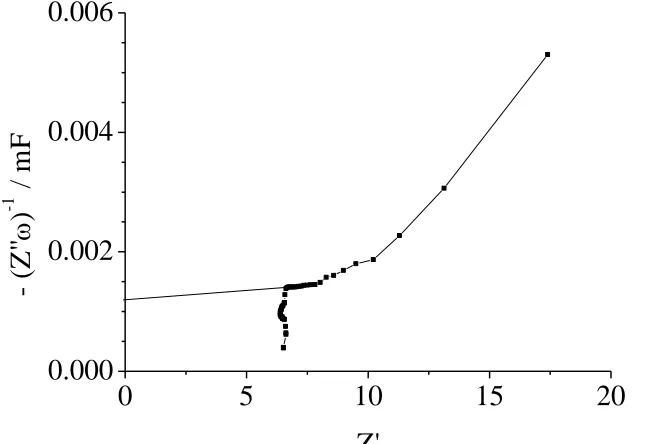
[11, 16, 18, 21]. Also, EAA was calculated by measuring the limit capacitance (C), which includes the double layer capacitance and pseudocapacitive faradaic processes, both taking place at the Pt and support material surfaces [25]. Capacitance is a measurement related to EAA assuming that the double layer capacitance does not vary at 0.3 V, and that 0.196 mF correspond to 1 cm2 of 20 wt % of Pt supported on carbon catalyst. Thereby, EAAs from different catalysts were obtained from a plot like the one shown in Figure 7. All EAA’s are summarized in Table 4.
0
5
10
15
20
0.000
0.002
0.004
0.006
-
(Z
''
)
-1
/
m
F
Z'
Figure 7. Typical capacitance plot of Pt/PPy-nanoparticles at dc bias of 0.3 V in a 0.5 M H2SO4
solution.
EAA of Pt/PPy-nanoparticles measured by capacitance was 2.00 m2/g, while for Pt/PPy-fibers it was 1.61 m2g-1. Different EAA values were recorded, probably due to different Pt distributions on the distinct obtained PPy structures, causing a variation in the number of available catalytic sites on each catalyst [22].
The calculated EAA from capacitance data was 2.00, 1.61 and 0.6 m2g-1 for Pt/PPy-nanoparticles, Pt/PPy-fibers and Pt/PPy-bulk respectively. Similar results were obtained from CV measurements. Variations on the EAA were not linear with respect to Pt content.
3.2.3 Ethanol electro-oxidation studies
[image:13.596.121.454.257.479.2]
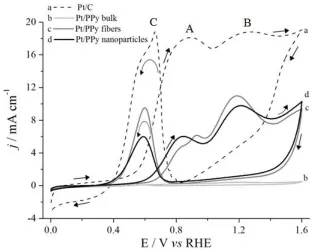
peaks. The first one, peak A, presented an onset potential of 0.4 V and reaches a maximum at 0.89 V, which has been assigned to the ethanol oxidation towards acetaldehyde (AAL) [8, 56].
At higher potentials, AAL reacts with produced OH– groups produced by water electroactivation, yielding acetic acid (AA) with a main peak potential at 1.28 V (peak B)[3, 8, 56].
Finally, at 1.3 V the oxygen evolution starts. In the return scan, an anodic peak is observed at 0.66 V with a shoulder around 0.57 V. These processes are attributed to the oxidation of adsorbed intermediate-species on active sites by the liberated oxygen from platinum reduction of Pt(II) species to Pt(0) (peak C)[1, 8, 57]. All the voltammograms of Pt/PPy materials showed the above described peaks but, with lower current densities as expected due to a smaller EAA than that Pt/C. In the case of Pt/PPy-nanoparticles, the peaks observed in the forward scan were shifted towards negative potentials (Table 3) because of the structure and a mixed electronic and ionic conductivity of support [8, 21]. In all PPy supported materials the acetaldehyde formation seems to be favored and, in the return scan, only the peak at 0.6 V appears.
Figure 8. Cyclic voltammograms of the catalysts series in 1.0 M CH3OH + 0.5 M H2SO4 at 10 mVs-1.
[image:14.596.137.449.446.696.2]
This implies a lower amount of adsorbed species that are been oxidized. For Pt/PPy-fibers, in the positive-going scan, the AAL and OH– formation took place in the range of 0.6 to 1.0 V and are presented a shoulder at 0.8 V and a oxidation peak at 0.93 V. In this material, Peak B showed the most negative-potential shift with respect to Pt/C. Pt/PPy-bulk showed the lowest currents and the highest onset potential for peak A. This is in accordance with its lower conductivity.
Table 4. Electrochemical measurements.
Electro active area (m2/g)
Cyclic voltammetry EIS
EAA CV EAA EIS Onset potential (V)
Main peak A potential (V) Main peak B potential (V) Rct (kΩ) 0.4 V 0.5 V 0.6 V Pt/PPy nanoparticles
2.16 2.00 0.35 0.84 1.21 2.0 1.2 1.1
Pt/PPy fibers 1.79 1.61 0.42 0.93 1.18 6.73 8.5 10.0
Pt/PPy bulk --- 0.60 0.57 0.80 1.18 11.8 13.1 17.7
[image:15.596.139.421.484.701.2]Pt/C 2.88 2.76 0.40 0.89 1.28 5.2 2.2 1.9
Figure 9a shows the complex plane impedance plots for Pt/C in a range from 0.1 to 1 V with a potential step of 0.1 V in a 1.0M ethanol + 0.5 M H2SO4 solution. As it can be observed, the semicircle
diameter decreases as the potential rises from 0.1 to 0.6 V, which could be attributed to changes in the capacitive double layer from the oxidation of Pt(0) to Pt(II).
0.0 0.2 0.4 0.6 0.8 1.0 0 10000 20000 30000 0 10000 20000 30000 Z ''/
Z' /
E/ V
vs RHE
0.0 0.2
0.4 0.6
0.8 1.0 0
10000 20000 30000
0
10000 20000
30000
b)
Z
''/
Z' /
E/ V
vs RHE
Figure 9. Complex plane impedance plot at various electrode potentials in 1.0 M CH3CH2OH + 0.5 M
H2SO4 for a) Pt/C and b) Pt/PPy nanoparticles.
At potentials higher than 0.7 V, more defined cycles are observed, because ethanol oxidation becomes faster and the semicircles diameter becomes wider due to formation of intermediate species. A similar process was observed with Pt/PPy nanoparticles (Figure 9b). In these Nyquist plots, a smaller semicircle diameter represents a lower Rct value and consequently a higher electrocatalytic activity [58, 59]. To compare the electrochemical activity of Pt/PPy material with respect to Pt/C, the Rct was calculated in the potential range from 0.4 to 0.6 V because it corresponds to the onset of the ethanol electrooxidation reaction, and the catalytic surface is expected to be covered with the formed intermediate species (Figure 10 and Table 3). The Pt/PPy nanoparticles plots present two semicircles which were fit to an equivalent circuit (Figure 11a), which consists of a resistor corresponding to the Rct across the electrode, in parallel with a constant phase element (CPE1). These components are connected by one side to the electrolyte resistance (Rel), and by the other side to another parallel set of resistor and constant phase element (R3–CPE2). This ladder type circuits are used to describe faradaic reactions involving adsorbed species. The Rct–CPE1 set corresponds to the first semicircle, and it has been associated to the ethanol adsorption on the catalyst surface. The R3–CPE2 element may be assigned to the oxidation of species which are already adsorbed such as adsorbed ethanol, or even to the formation of OH– groups at higher potentials [4, 60]. None of these Nyquist plots is a perfect semicircle. The flattening of the semicircles is a consequence of the CPE, whose impedance is given by
[image:16.596.145.419.79.296.2]
represents the diffusion limitations at 0.4 V. However, when the potential was increased, the CPE correspond to a capacitance distortion due to the surface roughness [60].
0 1500 3000 4500 6000 7500 9000 10500 12000 0
2000 4000 6000 8000 10000
12000 Pt/C Pt/PPy nanoparticles
0.4 V 0.5 V 0.6 V 0.4 V
0.5 V 0.6 V
-Z'' /
Z' /
Figure 10. EIS measurements of Pt/C and Pt/PPy nanoparticles (1) in 1.0 M CH3CH2OH + 0.5 M
H2SO4 solution at dc bias of 0.4, 0.5 and 0.6 V.
Figure 11b represents the equivalent circuit for Pt/C Nyquist plots. This circuit includes an inductive element (L), which is noted in the plot as a loop in the low frequency region, and is attributed to adsorbed species, like CO, on the catalyst surface [60, 61]. This negative feature was not present in Pt/Ppy nanoparticle catalysts, therefore such kind of species were likely removed from the surfaces of PPy–supported catalysts.
As stated in the literature [1,8], an important decrease in Rct is found when the electro-oxidation of the alcohol is taking place, initiating the adsorption/desorption of charge carriers. This drop in the Rct values was observed at lower potentials than 0.4 V in Pt/PPy nanoparticles, while Pt/C Rct decreased at potentials higher than 0.4 V. Besides this, the ethanol electro-oxidation is being carried out with faster kinetics in the PPy–nanoparticle supported Pt because its Rct results were smaller than in the case of Pt/C. The activity of the studied materials followed the order: Pt/PPy-nanoparticles > Pt/C >Pt/PPy-fibers > Pt/PPy-bulk.
[image:17.596.133.438.138.356.2] [image:17.596.206.387.642.771.2]
b)
Figure 11. Equivalent circuit of the ethanol electro-oxidation at a) Pt/PPy and b) Pt/C electrocatalysts.
4. CONCLUSIONS
PPy-nanoparticles with mean size of 53 nm were obtained through the polymerization in microemulsion using a system conformed by H2O/n-pentanol/SDS/pyrrole/FeCl3. PPy fibers with a
coil-like structure and an average diameter of 384 nm were also obtained by increasing the SDS and n-pentanol concentration as well as, by adding n-decane to the emulsion system. From EDS and FTIR results, it was possible to conclude that polymerization in microemulsion permits to avoid the carbonyl group formation associated with the PPy overoxidation and it was possible to identify the surfactant incorporation as a dopant agent into the PPy structures, which favoring the electronic conductivity. In the case of PPy-bulk, lower conductivity values were attributed to the presence of carbonyl groups that can interrupt the -conjugated system and electron transport thought the polymer chain. Platinum supported by PPy-nanoparticles exhibits a high activity towards ethanol electrooxidation, since it presented the lowest onset potential in cyclic voltammetry tests and the lowest Rct values obtained by EIS among all the synthesized electro-catalysts. These effects are attributed to the structure, the incorporation of surfactant as dopant agent and the redox processes of PPy.
ACKNOWLEDGEMENTS
The authors express their gratitude to Santiago Duarte for his collaboration in PPy shynthesis, Silvia Beatriz Andrade Canto for SEM-EDX technical assistance, Rossana Faride for FTIR analysis, Gustavo Martínez for technical support and Iván Puente Lee for TEM analysis. The authors acknowledge the financial support for this work from CONACyT (projects 102030 and 58332). F. López-García thank to CONACYT for grant No. 240299. Facultad de Química-UNAM is gratefully acknowledged for TEM analysis.
References
1. H. D. Herrera-Méndez, P. Roquero, M. A. Smit, L. C. Ordóñez, Int. J. Electrochem. Sci., 6 (2011) 4454.
2. S. Zhang, H. Wang, N. Zhang, F. Kong, H. Liu, G. Yin, J. Power Sources, 197 (2012) 44. 3. C. Lamy, E. M. Belgsir, J. M. Léger, J. Appl. Electrochem., 31 (2001) 799.
[image:18.596.210.386.69.198.2]
5. S. Song, P. Tsiakaras, Appl. Catal. B-Environ., 63 (2006) 187.
6. M. Brandalise, R. W. R. Verjulio-Silva, M. M. Tusi, O. V. Correa, L. A. Farias, M. Linardi, E. V. Spinacé, A. Oliveira Neto, Ionics, 15 (2009) 743.
7. B. Wu, R. Cui, Ying Gao, Z. Jiang, Russ. J. Electrochem., 45 (2009) 731. 8. S. S. Gupta, J. Datta, J. Chem. Sci., 117 (2005) 337.
9. M. H. Seo, E. J. Lim, S. M. Choi, S. H. Nam, H. J. Kim, W. B. Kim, Int. J. Hydrogen Energ., 36 (2011) 11545.
10.D. M. Dos Anjos, F. Hahn, J. M. Léger, K. B. Kokoh, G. Tremiliosi-Filho, J. Solid State Electr., 11 (2007) 1567.
11.V. Selvaraj, M. Alagar, Electrochem. Commun., 9 (2007) 1145.
12.H. Zhao, J. Yang, L. Li, H. Li, J. Wang, Y. Zhang, Int. J. Hydrogen Energ., 34 (2009) 3908. 13.O. V. Korchagin, V. T. Novikov, E. G. Rakov, V. V. Kuznetsov, M. R. Tarasevich, Russ. J.
Electrochem., 46 (2010) 882.
14.R. Wang, B. Wei, H. Wang, S. Ji, J. Key, X. Zhang, Z. Lei, Ionics, 17 (2011) 595.
15.J. M. S. Ayoub, A. N. Geraldes, M. M. Tusi, E. V. Spinacé, A. O. Neto, Ionics, 17 (2011) 559. 16.H. Zhao, L. Li, J. Yang, Y. Zhang, H. Li, Electrochem. Commun., 10 (2008) 876.
17.A. L. Dicks, J. Power Sources, 156 (2006) 128.
18.L. Li, Y. Zhang, J. F. Drillet, R. Dittmeyer, K. M. Jüttner, Chem. Eng. J., 133 (2007) 113. 19.D. P. Dubal, S. V. Patil, A. D. Jagadale, C. D. Lokhande, J. Alloy Compd., 509 (2011) 8183. 20.S. Mokrane, L. Makhloufi, N. Alonso-Vante, J. Solid State Electr., 12 (2008) 569.
21.H. Zhao, L. Li, J. Yang, Y. Zhang, J. Power Sources, 184 (2008) 375.
22.K. Bouzek, K. M. Mangold, K. Jüttner, J. Appl. Electrochem., 31 (2001) 501. 23.S. E. Friberg, C. Brancewicz, D. S. Morrison, Langmuir, 10 (1994) 2945.
24.A. J. Bard, L. R. Faulkner, Electrochemical Methods, Fundamentals and Applications, John Wiley & Sons, Inc., New York (2001).
25.E. B. Easton, P. G. Pickup, Electrochim. Acta, 50 (2005) 2469.
26.K. Holmberg, B. Jönsson, B. Kronberg, B. Lindman, Surfactants and Polymers in Aqueous Solution, Wiley, West Sussex (2003).
27.K. L. Mittal, B. Lindman, Surfactants in Solution, Plenum Press, New York (1984). 28.Y. Liu; Y. Chu; L. Yang, Mater. Chem. Phys., 98 (2006) 304.
29.T. A. Skotheim, J. R. Reynolds, Handbook of Conducting Polymers. Conjugated Polymers, Processing and Applications, CRC Press, Florida, (2007).
30.J. Jang, J. Hak Oh, X. Li Li, J. Mater. Chem., 14 (2004) 2872.
31.Y. Hoshina, E. A. Zaragoza-Contreras, R. Farnood, T. Kobayashi, Polym. Bull., 68 (2012) 1689. 32.S. Xing, G. Zhao, Polym. Bull., 57 (2006) 933.
33.J. Heinze, B. A. Frontana-Uribe, S. Ludwigs, Chem. Rev., 110 (2010) 4724.
34.N. Dutta-Gupta, D. Banerjee, N. S. Das, K. K. Chattopadhyay, Colloid Surface A, 385 (2011) 55. 35.L. Jiwei, Q. Jingxia, Y. Miao, J. Chen, J. Mater. Sci., 43 (2008) 6285.
36.S. V. Kasisomayajula, X. Qi, C. Vetter, K. Croes, D. Pavlacky, V. J. Gelling, J. Coat. Technol. Res., 2 (2010) 145.
37.L. Zhang, P. Liu, L. Ju, L. Wang, S. Zhao, Macromol. Res., 7 (2010) 648. 38.J. Jang, H. Yoon, Langmuir, 21 (2005) 1484.
39.W. Chen, G. Xue, , Front. Mater. Sci. China, 4 (2010) 152.
40.V. M. Ovando-Medina, R. D. Peralta, E. Mendizábal, H. Martínez-Gutiérrez, T. E. Lara-Ceniceros, R. Ledezma-Rodríguez, Colloid Polym. Sci., 289 (2011) 759.
41.F. Yan, G. Xue, M. Zhou, J. Appl. Polym. Sci., 77 (2000) 135. 42.M. M. Ayad, J. Mater. Sci., 44 (2009) 6392.
43.Y. Qiao, L. Shen, T. Dou, Chinese J. Polym. Sci., 28 (2010) 923.
46.P. M. Carrasco, H. J. Grande, M. Cortazar, J. M. Alberdi, J. Areizaga, J. A. Pomposo, Synthetic Met., 156 (2006) 420.
47.X. B. Che, J. P. Issi, J. Devaux, J. Mater. Sci., 32 (1997) 1515. 48.M. Beidaghi, C. Wang, Electrochim. Acta, 56 (2011) 9508.
49.C. Weidlich, K. M. Mangold, K. Jüttner, Electrochim. Acta, 50 (2005) 1547.
50.J. Tamm, A. Alumaa, A. Hallik, U. Johanson, L. Tamm, T. Tamm, Russ. J. Electrochem., 38 (2002) 182.
51.J. Clavilier, A. Rodes, K. El-Achi, M. A. Zamakhchari, J. Chem. Phys., 88 (1991) 1291. 52.B. Hoyos, J. González, C. Sánchez, Dyna, 136 (2002) 31.
53.J. Zhang, L. B. Kong, H. Li, Y. C. Luo, L. Kang, J. Mater. Sci., 45 (2010) 1947. 54.E. Frackowiak, F. Béguin, Carbon, 39 (2001) 937.
55.W. Hariyanto, W. Purwanto, R. W-Soemantojo, U. Stimming, JCNRE, 2 (2007) 47.
56.H. Hitmi, E. M. Belgsir, J–M. Léger, C. Lamy, R. O. Lezna, Electrochim. Acta, 39 (1994) 407. 57.R. G. Freitas, L. F. Q. P. Marchesi, M. R. Forim, L. O. S. Bulhões, E. C. Pereira, M. C. Santos, R.
T. S. Oliveira, J. Braz. Chem. Soc., 22 (2011) 1709.
58.H. Dong, L. Dong, J. Inorg. Organomet. P., 21 (2011) 754.
59.J. Li, R. Yuan, Y. Chai, T. Zhang, X. Che, Microchim. Acta, 171 (2011) 125.
60.X. Z. Yuan, C. Song, H. Wang, J. Zhang, Electrochemical Impedance Spectroscopy in PEM Fuel Cells, Fundamentals and Applications, Springer, London (2010).
61.P. Katikawong, T. Ratana, W. Veerasai, J. Chem. Sci., 121 (2009) 329.