Int. J. Electrochem. Sci., 10 (2015) 6651 - 6662
International Journal of
ELECTROCHEMICAL
SCIENCE
www.electrochemsci.org
Facile synthesis of high performance LiNi
0.5Mn
1.4Mg
0.1O
4and
LiNi
0.5Mn
1.4Al
0.1O
4by a low temperature solution combustion
synthesis method
Guiyang Liu 1, 2, *, Hongyan Sun1, 2, Xin Kong1, 2, Yannan Li 1, 2, Baosen Wang 1, 2 1
Lab of New Materials for Power Sources, College of Science, Honghe University, Mengzi 661199, Yunnan, China.
2
Local Characteristic Resource Utilization and New Materials Key Laboratory of Universities in Yunnan, Honghe University, Mengzi 661199, Yunan, China.
*
E-mail: [email protected]
Received: 15 April 2015 / Accepted: 28 May 2015 / Published: 24 June 2015
LiNi0.5Mn1.4Mg0.1O4 and LiNi0.5Mn1.4Al0.1O4 was synthesized by a low temperature solution combustion synthesis method at 700 ◦C in 30 min. Both of the two products are non-stoichiometric and disordered LiNi0.5Mn1.5O4 spinels. The two products exhibit similar reversible capacity and excellent cycling stability at 1C rate at room temperature. The initial reversible capacity of LiNi0.5Mn1.4Mg0.1O4 and LiNi0.5Mn1.4Al0.1O4 are 114 mAh/g and 113 mAh/g, and remain 100.0% and 98.9% after 100 cycles at 1C, respectively. LiNi0.5Mn1.4Mg0.1O4 shows better rate capability and much better cycling stability at 10C rate than these of LiNi0.5Mn1.4Al0.1O4. At 10C rate, the capacity retention of LiNi0.5Mn1.4Mg0.1O4 is near 100% after 100 cycles, but the capacity retention of LiNi0.5Mn1.4Al0.1O4 is only 80%. LiNi0.5Mn1.4Mg0.1O4 also displays better cycling stability at 55 oC than that of LiNi0.5Mn1.4Al0.1O4. The excellent electrochemical performance of LiNi0.5Mn1.4Mg0.1O4 is attributed to its higher crystallinity, larger Li+ diffusion coefficient and lower charge transfer resistance.
Keywords: Lithium ion batteries, LiNi0.5Mn1.5O4 spinels, cathode materials, doping
1. INTRODUCTION
Doping has been proved to be one of the most efficient routes to improve the electrochemical performance of LiNi0.5Mn1.5O4 [3, 4]. In the literatures, LiNi0.5Mn1.5O4 spinels doped by Mg [5], Al [6], Ti [7], Ga [8] and W [9] have been reported and exhibit improved electrochemical performance. Among them, Mg and Al are more attractive because of their light weight and high efficiency for improving the performance of LiNi0.5Mn1.5O4 [10-12].
For the preparation of doped LiNi0.5Mn1.5O4, it is important that the raw materials must be mixed homogeneously. Different synthesis methods such as solid-state method [13], sol-gel method [14] or co-precipitation synthesis [15] producing doped LiNi0.5Mn1.5O4 with different electrochemical performance have been reported. Although solid-state method is the simplest, the mixture of raw materials is non-homogeneous. In order to prepare single phase doped LiNi0.5Mn1.5O4, high temperature and long time are needed. However, high temperature generally results in increased grain size and impurities such as LixNi1−xO in the final product, leading to rate capability declining and capacity fading [16]. Other methods such as sol-gel method and co-precipitation method can obtain homogenous precursors and the electrochemical performance of the products can be improved, but the processes of them are complicated, resulting in the limitation in practical manufacturing applications.
Solution combustion synthesis method is a simple method to synthesize metal oxides at low temperature [17]. Due to the ionic level’s mixture of the raw materials in solution, doping could be easily carried out. In this paper, we introduced a modified low temperature solution combustion synthesis method to prepare Al and Mg doped LiNi0.5Mn1.5O4. Based on the optimization of the experimental conditions of the improved solution combustion synthesis method [18, 19], doped LiNi0.5Mn1.5O4 spinels with excellent electrochemical performance could be synthesized at 700oC in only 30 min. The total process took no more than 1 h. Although Mg and Al doping in LiNi0.5Mn1.5O4 synthesized by other methods have been widely reported, to our knowledge, it has not been reported that Mg and Al doped LiNi0.5Mn1.5O4 spinels with such excellent performance could be synthesized in such a short time. The electrochemical performances including capacity, cycling stability, rate capability of the products have been studied in details.
2. EXPERIMENTAL
2.1 Synthesis
2.2 Phase composition and morphology
The phase composition and structure of the products were determined by X-ray diffraction (XRD, D/max-rB, Cu-K radiation) and Fourier transform infrared spectroscopy (FTIR, Perkin Elmer, with KBr pellets). The morphologies of the products were observed by scanning electron microscope (SEM, XL30ESEM-TMP, Philips).
2.3 Elctrochemical performance test
The electrochemical performance of the as-prepared LiNi0.5Mn1.5O4 powders was tested in a standard CR2032 coin cell, which was composed of a cathode, lithium anode, a Celgard polypropylene separator, and LiPF6 in 1:1 ethylene carbonate/diethylene carbonate (EC/DEC) as electrolyte. The chathode electrode was composed of 80 wt.% active material, 12 wt.% conductive carbon, and 8 wt.% polyvinylidene fluoride binder. The cells were assembled in an argon-filled glove box and cycled at room temperature and 55 o C in the voltage ranege of 3.5 - 5.0V (versus Li/Li+ ) at different C rate (in this paper, 1C=150mA/g). Cyclic voltammograms (CV) and electrochemical impedance spectroscopy (EIS) of the products were carried out by an electrochemical workstation (Autolab PGSTAT302N, Metrohm, Switzerland). The scan rate was from 0.1 to 0.5 mV/s between 3.5-5.0 V, and the frequency range was 10 kHz to 0.1 Hz with an AC amplitude of 5 mV. Before EIS test, the cell was charged to 5V at 100% state.
3. RESULTS AND DISCUSSION
3.1 Phase structure and micro-morphologies
Figure 1. XRD patterns of (a) LiNi0.5Mn1.4Mg0.1O4 and (b) LiNi0.5Mn1.4Al0.1O4.
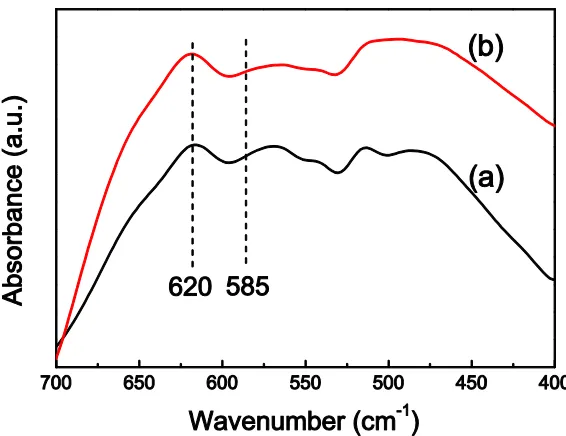
The cation ordering of LiNi0.5Mn1.5O4 can be determined by FT-IR spectroscopy effectively [24]. When the cation ordering of LiNi0.5Mn1.5O4 increases, the intensity of Ni–O band at 588 cm−1 will increase and the intensity of Mn–O band at 620 cm−1 will decrease [25]. For example, a typical highly ordered structure shows a higher intensity of Ni–O band at about 588 cm−1 than that of Mn–O band at 620 cm−1 [26]. As shown in Fig.2, the band intensity of all the products at 585 cm-1 is lower than that at 620 cm−1, suggesting that the two products have disordered structure with space group of Fd3m.
[image:4.596.163.446.478.696.2]
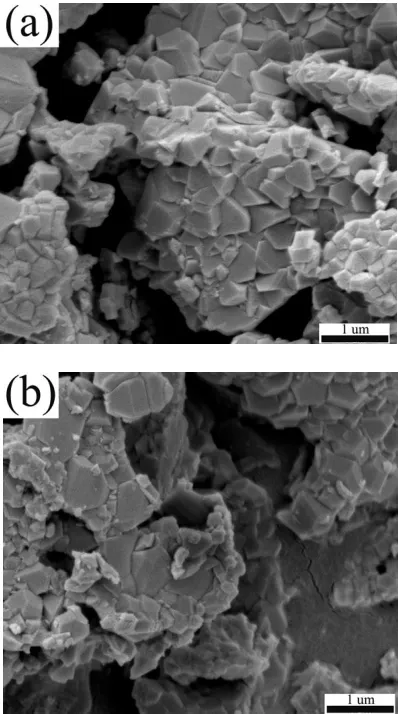
Figure 3. SEM images of (a) LiNi0.5Mn1.4Mg0.1O4 and (b) LiNi0.5Mn1.4Al0.1O4.
The SEM micro morphologies of the products are shown in Fig.3. It can be found that the micro morphologies of LiNi0.5Mn1.4Mg0.1O4 (as shown in Fig.3a) exhibit developed grains with ~300-500nm in size. The surface facets are very clear, indicating that the sample is well crystallized. Differently, besides developed grains, LiNi0.5Mn1.4Al0.1O4 also shows lots of small agglomerated particles, as shown in Fig.3b. From the small particles, typical octahedral surface facets of the spinel cannot be found, suggesting that some grains of LiNi0.5Mn1.4Al0.1O4 are not well developed.
3.2 Electrochemical performance
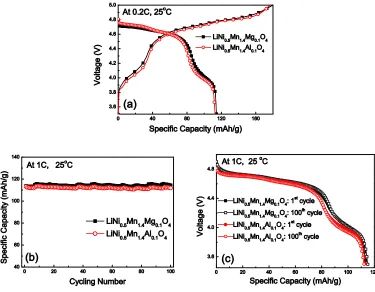
The calculated capacities from 4.0V of LiNi0.5Mn1.4Mg0.1O4 and LiNi0.5Mn1.4Al0.1O4 are 27 and 28 mAh/g, respectively. The considerable capacities from 4.0V plateaus of the products reveal that there are considerable Mn3+ ions in the products, and also indicate that the products are non-stoichiometric and disordered, which can support the results of XRD and FT-IR.
Figure 4. (a) Initial charge/discharge curves of the products. The cell was firstly charged to 5.0 V at 0.2C and held for 10min at 5.0 V, and then discharged to 3.5 V at 0.2C. (b) Cycling stabilities of the products. The cell was charged at 0.5C and discharged at 1C in 3.5-5.0V. (c) The discharge curves of the products of the 1st cycle and the 100th cycle.
[image:6.596.114.489.167.459.2][image:7.596.113.492.125.550.2]
the host structure against repeated de-intercalation of the Li+ ion therefore can enhance the cycling stability of the LiNi0.5Mn1.5O4.
Figure 5. (a) Rates capabilitis of the products. (b) Capacity retentions at different rates of the products. (c) Charge/discharge curves of LiNi0.5Mn1.4Mg0.1O4 at different rate. (d) Charge/discharge curves of LiNi0.5Mn1.4Al0.1O4 at different rate. (e) Cycling performance of the products at 10C rate. The cell was charged at a slow rate of 0.5C when discharge rate is ≥ 0.5C.
It can be seen from Fig.5c and Fig.5d that the polarizations from 0.2C to 2C of the two products are small, revealing that at lower rate, the two products show good rate capabilities. However, when the rate is above 5C, the voltage drop of LiNi0.5Mn1.4Al0.1O4 is larger than that of LiNi0.5Mn1.4Mg0.1O4. At 20C, LiNi0.5Mn1.4Mg0.1O4 still maintains an operation voltage close to 4.2V. Contrastively, the operation voltage of LiNi0.5Mn1.4Al0.1O4 badly drops to 3.7V. LiNi0.5Mn1.4Mg0.1O4 shows smaller polarization with increasing C rate.
LiNi0.5Mn1.4Mg0.1O4 displays much better cycle stability than that of LiNi0.5Mn1.4Al0.1O4. As shown in Fig.5e, the capacity retentions of LiNi0.5Mn1.4Mg0.1O4 are near 100%, but the capacity retention of LiNi0.5Mn1.4Al0.1O4 is only 80% at 10C rate after 100 cycles. Mg doping is more efficient for improving the rate capability of LiNi0.5Mn1.5O4 than Al doping. Moreover, because the two products are non-stoichiometric and disordered, and the presence of oxygen defect and Mn3+ ions in the two products could improve their rate capabilities [22, 24, 29], the as-prepared LiNi0.5Mn1.4Al0.1O4 and LiNi0.5Mn1.4Mg0.1O4 exhibit better rate capabilities than many previously reported LiNi0.5Mn1.5O4 spinels [30, 31].
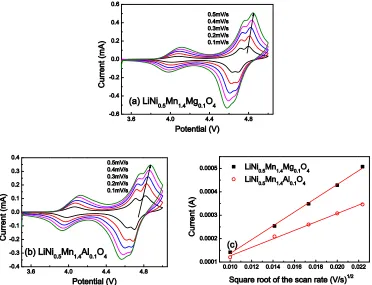
Voltammetry measurements of LiNi0.5Mn1.4Mg0.1O4 and LiNi0.5Mn1.4Al0.1O4 were performed to further study the electrochemical performance. Fig.6a and Fig.6b show the cyclic voltammograms (CVs) of LiNi0.5Mn1.4Mg0.1O4 and LiNi0.5Mn1.4Al0.1O4 scanned from 0.1 to 0.5mV/s, respectively. two regions at 4.0V and 4.7V appear in the CVs. The two redox pairs in 4.0V regions of the products are evident, suggesting the existence of the Mn4+/Mn3+ couple in the products, which confirm the results of charge/discharge curves. When the scan rates increase from 0.1 to 0.5 mV/s, the change of voltage gaps between each redox couple of LiNi0.5Mn1.4Mg0.1O4 is smaller than that of LiNi0.5Mn1.4Al0.1O4. It suggests that the polarization of LiNi0.5Mn1.4Mg0.1O4 issmaller than that ofLiNi0.5Mn1.4Al0.1O4.
Fig.6a and Fig.6b also show that as the scanning rate (v) is increased, the peak current (ip) increases. Fig.6c shows the ip vs. the square root of the scan rates (v1/2) of the products. All of them display linear increase, which suggests that the intercalation reaction is a solid-state diffusion controlled reaction [32]. Moreover, the diffusion coefficient of Li+ (DLi) can be approximately determined by the dependence of ip on v1/2 based on the following equation [33]:
2 1 2 1 2 3 5 10 69 .
2 Li Li
p n AC D
i (1)
Where n is the number of electrons per reaction species (for lithium-ion n=1), A is the total surface area of the electrode (2 cm2 in this case), and CLi is the bulk concentration of Li+ in the electrode (given as 0.02378 mol/cm3) [34, 35]. From the slope of linear fit of ip vs. v½ in Fig.6d, the diffusion coefficients (DLi) of LiNi0.5Mn1.4Mg0.1O4 and LiNi0.5Mn1.4Al0.1O4 have been calculated as 5.30×10⁻¹²
[36], the larger DLi of LiNi0.5Mn1.4Mg0.1O4 results in better rate capability than that of LiNi0.5Mn1.4Al0.1O4. Theoretically, the bond strength of Al-O is stronger than these of Mg-O [21], which may results in more difficult lithium ion diffusion in the lattice, therefore leads to the larger DLi.
Figure 6. Cyclic voltammogram (CV) of (a) LiNi0.5Mn1.4Mg0.1O4 and (b) LiNi0.5Mn1.4Al0.1O4 at different scan rate. (c) The plotting of peak current vs. square root of the scan rate for the products.
[image:9.596.114.486.150.435.2]
Figure 7. (a) EIS spectra of LiNi0.5Mn1.4Mg0.1O4 and LiNi0.5Mn1.4Al0.1O4 in the frequency range between 0.1 Hz and 100 kHz. (b) The equivalent circuit of the EIS.
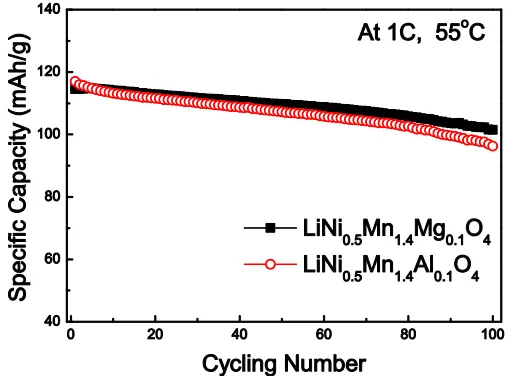
[image:10.596.111.498.69.208.2]The main drawback of the LiNi0.5Mn1.5O4-based cathodes is the severe capacity loss when cycling is carried out at elevated temperature [42]. The cycling performances at 55 ◦C of the products are shown in Fig. 9. Although the initial capacities of the products are similar with the results at 25 ◦C, the capacity fading of the products is more obvious at 55 ◦C. The capacity retention after 100 cycles at 1C at 55 ◦C of LiNi0.5Mn1.4Mg0.1O4 is 88.6%, higher than that of 82.3% of LiNi0.5Mn1.4Al0.1O4. The higher capacity retention at 55 ◦C of LiNi0.5Mn1.4Mg0.1O4 than that of LiNi0.5Mn1.4Al0.1O4 may be attributed to the higher crystallinity of LiNi0.5Mn1.4Mg0.1O4 [43]. Although the capacity loss of the two products at 55◦C is larger than that at 25 ◦C, they are still better than many doped LiNi0.5Mn1.5O4 spinels [6, 44].
Figure 8. Cycling performance of LiNi0.5Mn1.4Mg0.1O4 and LiNi0.5Mn1.4Al0.1O4 at 55oC. The cell was charged at 0.5C and discharged at 1C at 55oC in the voltage range of 3.5-5.0V.
4. CONCLUSION
[image:10.596.174.429.452.640.2]
products exhibit similar reversible capacity and cycling stability at 1C rate at room temperature, but LiNi0.5Mn1.4Mg0.1O4 shows better rate capability, better cyling stability at 10C rate and better elevated-temperature cycling stability than these of LiNi0.5Mn1.4Al0.1O4. LiNi0.5Mn1.4Mg0.1O4 delivers an initial reversible capacity of 114 mAh/g and remains 100.0% after 100 cycles at 1C. At 10C, the capacity is still 91 mAh/g and remains also 100.0% after 100 cycles. The excellent electrochemical performance of LiNi0.5Mn1.4Mg0.1O4 is attributed to its higher crystallinity, larger Li+ diffusion coefficient and lower charge transfer resistance.
ACKNOWLEDGEMENT
The present work was supported by the National Natural Science Foundation of China (No. 51362012), Natural Science Foundation of Yunnan Province (2012FB173) and the Key Construction Disciplines of Chemistry for Master Degree Program in Yunnan.
Reference
1. H. Li, Z. Wang, L. Chen, X. Huang, Adv. Mater., 21(2009) 4593. 2. A. Manthiram, J. Phys. Chem. Lett., 2(2011) 176.
3. A. Ito, D. Li, Y. Lee, K. Kobayakawa, Y. Sato, J. Power Sources, 185 (2008)1429. 4. T. Yi, Y. Xie, Y. Zhu, R. Zhu, M. Ye, J. Power Sources, 211 (2012) 59.
5. M. Liu, H. Huang, C. Lin, J. Chen, S. Liao, Electrochim. Acta, 120 (2014) 133. 6. G.B. Zhong, Y.Y. Wang, Z.C. Zhang, C.H. Chen, Electrochim. Acta, 56 (2011) 6554. 7. J. Kim, N.P.W. Pieczonka, Y. Sun, B.R. Powell, J. Power Sources, 262(2014) 62. 8. D.W. Shin, A. Manthiram, Electrochem. Commun., 13 (2011) 1213.
9. S.J.R. Prabakar, S.C. Han, S.P. Singh, D.K. Lee, K.S. Sohn, M. Pyo, J. Power Sources, 209 (2012) 57.
10.C. Locati, U. Lafont, L. Simonin, F. Oomsb, E.M. Kelder, J. Power Sources, 174 (2007) 847. 11.X. Wang, O. Tanaike, M. Kodama, H. Hatori, J. Power Sources, 168 (2007) 282.
12.G. Zhong, Y. Wang, X. Zhao, Q. Wang, Y. Yu, C. Chen, J. Power Sources, 216 (2012) 368. 13.H. Wang, H. Xia, M. Lai, L. Lu, Electrochem. Commun., 11 (2009) 1539.
14.G. Liu, L. Zhang, L. Sun, L. Wang, Mater. Res. Bull., 48 (2013) 4960.
15.J. Liu, Z. Sun, J. Xie, H. Chen, N. Wu, B. Wu, J. Power Sources, 240 (2013) 95. 16.H. Fang, Z. Wang, X. Li, H. Guo, W. Peng, Mater. Lett., 60 (2006) 1273.
17.X. Kong, H. Sun, Q. Wang, Z. Yi, B. Wang, G. Liu, Ceram. Int., 40 (2014) 11611. 18.G. Liu, X. Kong, H. Sun, B. Wang, Ceram. Int., 40 (2014) 14391.
19.G. Liu, X. Kong, B. Wang, J. Electrochem. Soc., 161(2014) A742. 20.R.D. Shannon, Acta Crystallogr., A32(1976) 751.
21.Lide, David R., ed. CRC handbook of chemistry and physics. CRC press, 2004. 22.D. Liu, Y. Lu, J.B. Goodenough, J. Electrochem. Soc., 157 (2010) A1269
23.J. Xiao, X. Chen, P.V. Sushko, M.L. Sushko, L. Kovarik, J. Feng, Z. Deng, J. Zheng, G.L. Graff, Z. Nie, D. Choi, J. Liu, J. Zhang, M. Whittingham, Adv. Mater., 24 (2012) 2109.
24.G. Liu, X. Kong, H. Sun, B. Wang, Z. Yi, Q. Wang, Electrochim. Acta, 141 (2014) 141. 25.L. Wang, H. Li, X. Huang, E. Baudrin, Solid State Ionics, 193 (2011) 32.
26.H. Lee, P. Muralidharan, C.M. Mari, R. Ruffo, D.K. Kim, J. Power Sources, 196 (2011) 10712. 27.S. Patoux, L. Daniel, C. Bourbon, H. Lignier, C. Pagano, F. Le Cras, S. Jouanneau, S. Martinet, J.
Power Sources, 189 (2009) 344.
28.F.G.B. Ooms, E.M. Kelder, J. Schoonman, M. Wagemaker, F.M. Mulder, Solid State Ionics, 152- 153 (2002) 143.
30.Y. Yao, H. Liu, G. Li, H. Peng, K. Chen, Mater. Chem. Phys., 143 (2014) 867.
31.W.W. Wu, H.F. Xiang, G.B. Zhong, W. Suc, W. Tang, Y. Zhang, Y. Yu, C.H. Chen, Electrochim. Acta, 119 (2014) 206.
32.S. Myung, S. Komaba, N. Kumagai, H. Yashiro, H. Chung, T.g Cho, Electrochim. Acta, 47 (2002) 2543.
33.R.S. Nicholson, Anal. Chem., 37 (1965) 1351.
34.Y. Xia, H. Takeshige, H. Noguchi and M. Yoshio, J. Power Sources, 56(1995) 61. 35.T. Yang, N. Zhang, Y. Lang and K. Sun, Electrochim. Acta, 56(2011) 4058.
36.X. Zhang, F. Cheng, K. Zhang, Y. Liang, S. Yang, J. Liang, J. Chen, RSC Adv., 2(2012) 5669. 37.J. Liu, A. Manthiram, J. Phys. Chem. C, 113(2009) 15073.
38.M. Kunduraci, G.G. Amatucci, Electrochim. Acta, 53(2008) 4193.
39.M.W. Xiang, C.W. Su, L.L. Feng, M.L. Yuan, J.M. Guo, Electrochim. Acta, 125 (2014) 524. 40.G.Y. Liu, Y.N. Li, B.S. Wang, Int. J. Electrochem. Sci., 10 (2015) 3124.
41.Y.Z. Wang, X. Shao, H.Y. Xu, M. Xie, S.X. Deng, H. Wang, J.B. Liu, H. Yan, J. Power Sources, 226 (2013) 140.
42.M. Aklalouch, R.M. Rojas, J.M. Rojo, I. Saadoune, J.M. Amarilla, Electrochim. Acta, 54 (2009) 7542.
43.L.J. Xi, H.E. Wang, Z.G. Lu, S.L. Yang, R.G. Ma, J.Q. Deng, C.Y. Chung, J. Power Sources, 198 (2012) 251.
44.J.J. Shiu, W.K. Pang, S.g Wu, J. Power Sources, 244 (2013) 35.