Int. J. Electrochem. Sci., 8 (2013) 6321 - 6331
International Journal of
ELECTROCHEMICAL
SCIENCE
www.electrochemsci.org
Electrocatalytic Properties of Sol-Gel Derived Spinel Co
xFe
3-xO
4(0 ≤ x ≤ 1.5) Electrodes for Oxygen Evolution in Alkaline
Solution
Ritu Yadav, M. K. Yadav and N. K. Singh*
Department of Chemistry, Faculty of Science, University of Lucknow, Lucknow-226007 (INDIA)
*
E-mail: [email protected]
Received: 27 February 2013 / Accepted: 6 April 2013 / Published: 1 May 2013
The spinel-type oxide electrodes of CoxFe3-xO4 (0 ≤ x ≤ 1.5) have been studied for their electrocatalytic
properties with regards to oxygen evolution reaction in 1M KOH solution at 25 0C. These oxides were prepared by ammonium hydroxide sol-gel auto-combustion method and reproduced in the form of film on nickel support by an oxide-slurry painting technique. Oxides, so synthesized, were characterized physicochemically by using scanning electron microscopy (SEM), infrared (IR) spectroscopy. Cyclic voltammetry and Tafel polarization techniques were used for electrochemical characterization. The study showed that substitution of cobalt in the base oxide greatly influences the electrocatalytic properties. Among synthesized oxides, the Co1.5Fe1.5O4 electrode was found to be the most active
electrode for oxygen evolution reaction. The Tafel slope values of the oxide electrodes were ranged between 44 – 56 mVdecade-1. The order for the OER with respect to OH- concentration was found to be ~ 2 with each oxide electrocatalyst. The catalytic activities of the electrodes are correlated with their surface roughness. The thermodynamic parameters for oxygen evolution reaction (OER) such as, standard electrochemical enthalpy of activation (∆H0#el), standard enthalpy of activation (∆H0#) and
standard entropy of activation (∆S0#
) have also been calculated.
Keywords: Spinel oxides, Sol-gel method, Infrared spectroscopy, Electrocatalysis, Oxygen evolution
1. INTRODUCTION
In water electrolysis, oxygen evolution reaction is the basic anodic reaction process. A number of electrocatalysts, such as, transition metal oxides with spinel-structure (AB2O4; where, A & B are a
bivalent & trivalent transition metal ions, respectively) and perovskite-structure (ABO3; where, A is
are technologically important materials with regards to their structural, electronic, magnetic and catalytic properties [4]. These materials have been extensively used in several important heterogeneously catalyzed reactions, such as, an anode catalysts for chlorine and chlorate production [2], synthesis of ammonia [5], decomposition of H2O2 [6], application in the electron transfer of
hemoglobin [7], selective oxidation of butane to butadiene [8] and in a biosensors [9]. Earlier, these oxides were prepared by conventional ceramic methods [10, 11], which usually produced materials of high resistivity and low specific surface area and thereby lead to relatively low electrocatalytic activities. The specific surface area vis-à-vis the electrocatalytic properties could be improved to a considerable extent by using relatively low temperature preparation methods, namely, precipitation [12, 13], sol-gel [14, 15] etc and substitution of suitable metal ions [16-21].
Recently, Singh et. al. prepared a series of metal-substituted binary and ternary ferrospinels [12, 19-23] using a low temperature precipitation method with a controlled pH (=11) and found considerable enhancement in the electrocatalytic properties towards the OER. Singhal et. al. [24] obtained Cr-substituted Co-Zn nanoferrites by sol-gel auto-combustion method and studied their structural, electrical, optical and magnetic properties. By adopting the same method, we synthesized pure and Co-substituted ferrites and studied their physicochemical and electrocatalytic properties for OER in alkaline solution. Results of the study are presented in this paper.
2. EXPERIMENTAL
Pure and Co-substituted spinel ferrites ware synthesized by the method, recently reported in literature [24]. For the purpose, purified Fe(NO3)3.9H2O (Merck 98%), Co(NO3)2.6H2O (Merck 97%)
and citric acid (Merck) were weighed in stoichiometric ratio and dissolved in minimum amount of double distilled water. The individual solutions were then mixed together and the pH of the solution was adjusted to 6 by adding NH4OH solution. The solution was then slowly evaporated in a water bath
till gel like mass was formed. The gel formed was then burnt to self ignition to obtain a loose powder. The powders were then sintered at 4000C for 3 hrs in muffle furnace to get the desired oxides.
Materials, so obtained, were characterized by recording IR spectra (JASCO FT/IR-5300) in the frequency range of 4000–400 cm−1. In case of IR, oxide powder and purified KBr were mechanically mixed and pressed to transfer in the pellet form. The morphology of the oxide powders was examined using a high performance scanning electron microscope (SEM; LEO 430). The identity of the oxide was confirmed by obtaining X-ray diffractograms using Cu-Kα radiation (λ = 0.15418 nm).
and silver paste as described in the literature [25]. Only 0.5 cm2 area of the film was used in electrochemical study and the remaining film including uncovered surface of Ni plate was covered with Araldite.
All the electrochemical studies, such as, cyclic voltammograms (CV) and Tafel polarization were performed in a conventional three-electrode single compartment Pyrex glass cell using a computerized potentiostat/galvanostat (Gamry, Reference 600). The potential of the working electrode was measured with respect to Hg/HgO/1M KOH electrode. All potentials mentioned in the text are based on the Hg/HgO (E0 = 0.098 V vs. NHE at 25 0C) electrode only. A pure Pt-foil (~ 2 cm2) was used as an auxiliary electrode.
3. RESULTS AND DISCUSSION
3.1. Physicochemical Properties 3.1.1. Morphology of oxide powder
(a) (b)
(c) (d)
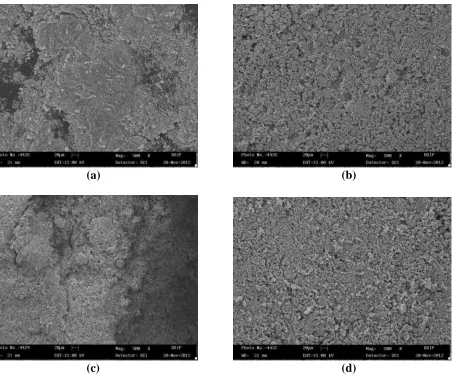
[image:3.596.77.530.344.722.2]
SE micrographs of pure and Co-substituted oxide powders, sintered at 4000C for 3 hrs, are represented in the Fig. 1 (a - d) at one magnification. From figure, it is revealed that the appearance of the oxide powder is almost similar. However, some aggregates have been observed in the case of Fe3O4 and CoFe2O4 [Fig.1 (a & c)]. These oxides also show compactness. Crystals of Co0.5Fe2.5O4 and
Co1.5Fe1.5O4 [Fig.1 (b & d)] are distributed more uniformly and more homogeneous with smaller grain
size. The grain size was found to be smallest with Co1.5Fe1.5O4 [Fig. 1(d)].
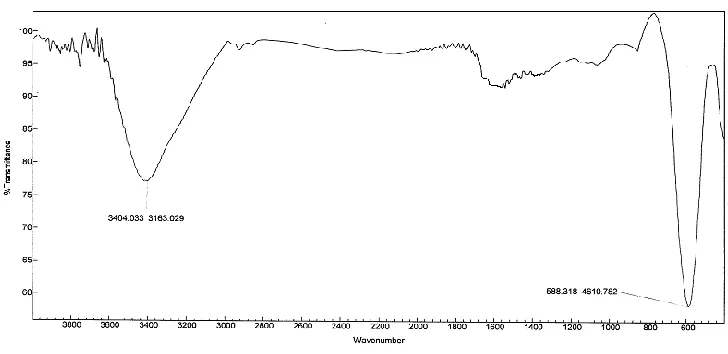
[image:4.596.116.480.225.402.2]3.1.2. Infrared
Figure 2. IR spectra of CoFe2O4 oxide sintered at 4000C for 3 hrs.
IR spectra of each oxide powder, sintered at 400 0C for 3hrs, were recorded in the region of 4000-400 cm-1. A strong peak at ~ 588 cm-1 indicates the formation of pure spinel ferrite [26, 27]. A representative IR spectrum for the CoFe2O4 is shown in the Fig. 2. The peak value ~ 3404 represents
the hydroxyl group of CoFe2O4. The presence of hydroxyl group on the ferrite may help in the
conjugation and dispersion of nonmaterial [28].
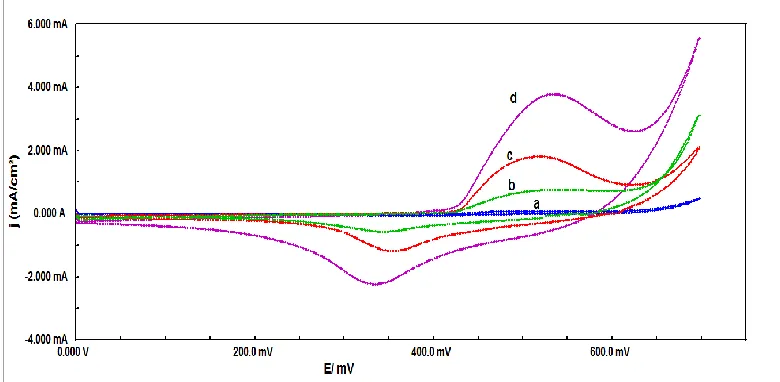
3.2. Electrochemical properties 3.2.1. Cyclic Voltammetry (CV)
In order to know the electroactive species on the surface of oxide electrode with regard to the oxidation-reduction reaction, cyclic voltammograms of each oxide electrode were recorded at the scan rate of 20 mV s-1 in the potential region of 0.0 – 0.7 V in 1 M KOH at 25 0C. Typical CV curves for the base and Co-substituted species are shown in the Fig. 3. Cyclic voltammograms for the each oxide electrodes were quite similar, regardless of the nature of the oxide films. The observed peak currents (jpa & jpc) in the case of base oxide are very low. So, it is not clearly seen in the figure in combination
with the other Co-substituted oxide electrode.
(Epc) peak potentials, the separation potential (∆E = Epa - Epc), and the formal redox potential [E0 =
(Epa + Epc)/2] were estimated and their values, at the scan rate of 20 mV s-1,are listed in Table 1. The
result shows that the ∆E value increases appreciably with the Co-substitution in the base oxide. The ∆E value was found to be greatest with 1.0 mol Co-substitution. The E0 values were almost similar with each oxide electrode.
Figure 3. Cyclic Voltammograms of Co-substituted ferrite electrodes on a Ni-substrate at 20 mV s-1 in 1M KOH at 25 0C; (a) Fe3O4, (b) Co0.5Fe2.5O4, (c) CoFe2O4 and (d)
[image:5.596.105.495.173.364.2]Co1.5Fe1.5O4
Table 1. Results of the cyclic voltammetry of Ni/CoxFe3-xO4 (0 ≤ x ≤ 1.5)at the scan rate 20 mV s-1 in
1M KOH at 25 0C.
Electrode Epa /mV Epc /mV ∆E = (Epa - Epc)
/mV
E0 = (Epa+Epc)/2
/mV
Fe3O4 502 349 153 426
Co0.5Fe2.5O4 527 347 180 437
CoFe2O4 540 337 203 438
Co1.5Fe1.5O4 529 342 187 436
Also, from figure 3, it is observed that anodic (jpa) and cathodic (jpc) peak current density increased,
significantly, with the increase of Co-content in the base oxide. The effect is found to be greatest with Co1.5Fe1.5O4 electrode. This increase in the peak current density might be due to the fact that the
catalysts stimulate not only the oxygen evolution reaction but also the redox couple.
3.2.2. Electrocatalytic activity
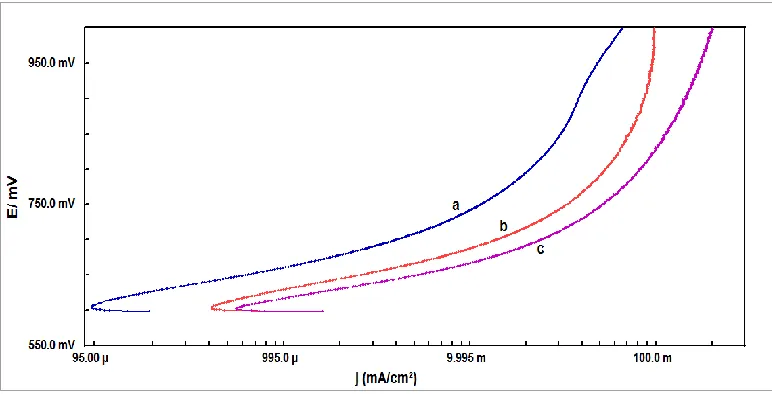
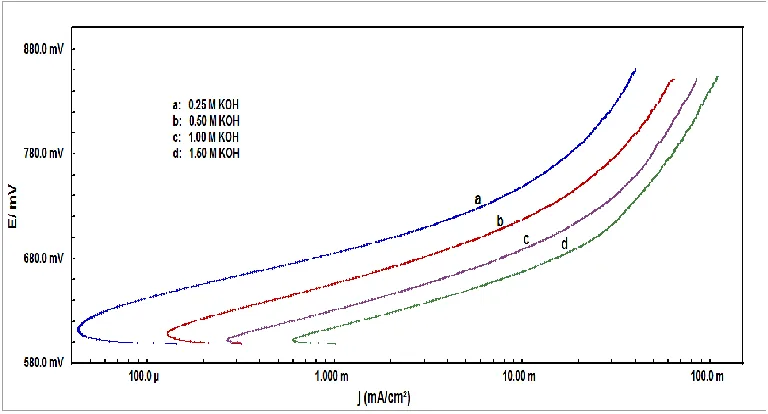
Figure 4. Tafel plots for oxygen evolution on the CoxFe3-xO4 (0 ≤ x ≤ 1.5) electrode in 1M KOH at
250C (scan rate = 0.2 mV s-1). (a) Fe3O4, (b) CoFe2O4, and (c): Co1.5Fe1.5O4
The electrocatalytic activity of each oxide electrode was determined by recoding the anodic polarization curves (E vs log j) for the OER at a slow scan rate of 0.2 mV s-1 in 1 M KOH at 25 0C. The polarization curves for each oxide electrode, as shown in Fig. 4, were nearly similar regardless of the Co content. Due to complexity/overlapping in presentation, the Tafel plot for Co0.5Fe2.5O4 is not
shown the figure 4. The values of Tafel slopes (b) and apparent current density (ja) at three different
potentials were estimated from the polarization curve and shown in the Table 2. The Tafel slope values were ranged between 44 – 56 mV decade-1. The b-values at low potential were ca. RT/F in the case of CoFe2O4 and Co0.5Fe2.5O4 (b = 56 mVdecade-1) and cs. 2RT/3F in the case of Fe3O4 (b = 49
mVdecade-1) and Co0.5Fe2.5O4 (b = 44 mVdecade-1). These results indicate that the rate determining
step is not the same for different catalytic films. From figure 4 and Table 2, it is observed that among all the oxide electrodes prepared, the Co1.5Fe1.5O4 is electrocatalytically the most active whereas Fe3O4
is the least active. In terms of apparent current density (ja) at three different potentials (E = 650mV,
750 mV & 850 mV) the Ni/Co1.5Fe1.5O4 electrode showed about 3 - 9 times higher activity as
compared to the base oxide. Based on the apparent current density at E = 850 mV, the electrocatalytic activity of different followed the order:
Co1.5Fe1.5O4 (j = 108.0 mA cm-2) > Co0.5Fe2.5O4 (j = 71.8 mA cm-2) ≈ CoFe2O4 (j = 69.6 mA
[image:6.596.105.493.193.390.2]
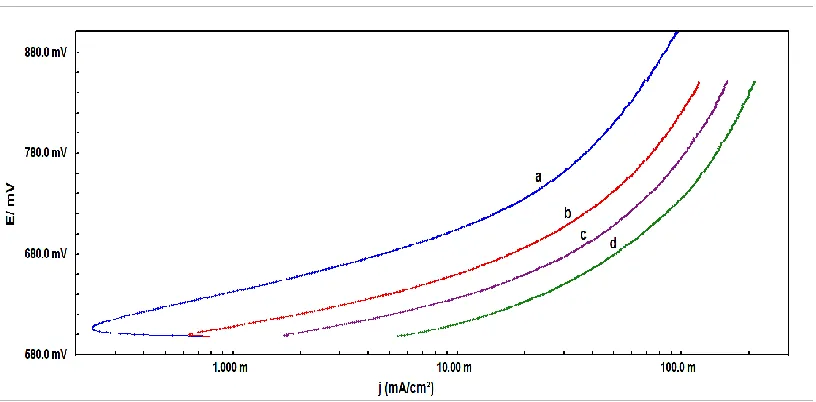
In order to determine the reaction order (p) with respect to OH- concentration, the anodic Tafel polarization curve was recorded in different KOH concentrations by keeping the ionic strength of the medium constant (µ = 1.5) (Fig. 5). An inert supporting electrolyte KNO3 (Merck, purified) was used
to maintain the ionic strength. The value of order (p) was estimated from the slope of the plot log j vs log [OH-] (Fig. 6) at constant potential (E = 650 mV). The estimated values of p were found to be ~ 2 for each oxide catalyst and shown in Table 2.
Figure 5. Tafel plots on Ni/Co1.5Fe1.5O4 at potential scan rate of 0.2 mV s-1 in different KOH
concentrations (µ = 1.5).
As observed by us, Orehotsky et. al. [10] also found similar low Tafel slopes (37- 49 mV decade-1) for oxygen evolution on NixFe3-xO4 (0.49 ≤ x ≤ 1.68) prepared by a freeze-drying technique.
The observed Tafel slope (b) values were in fair agreement with those recently reported for the CoFe 2-xCrxO4 (b = 40-51 mV decade-1) [19], MnxFe3-xO4 (b = 36-65 mV decade-1) [12], MnFe2-xCrxO4 (b =
34 - 41 mV decade-1) [34], and NiFe2-xCrxO4 (b = 38 – 41 mV decade-1) [35]. Lyons et. al. also found
[image:7.596.106.490.189.396.2]same Tafel slopes (b = 37–47 mV decade-1) on oxidized nickel, cobalt and iron electrodes in basic medium for oxygen evolution reaction [36].
Table 2. Electrode kinetic parameters for O2 evolution on Ni/CoxFe3-xO4 (0 ≤ x ≤ 1.5) 1M KOH at 25 0
C.
Electrodes Tafel slope (b) /mV decade-1
Order (P)
Current (j/mAcm-2) at E/mV
650 750 850
Fe3O4 49 2.0 0.6 11.6 31.0
Co0.5Fe2.5O4 56 2.1 2.7 33.5 71.8
CoFe2O4 56 1.8 5.5 36.8 69.6
A similar value of electrode kinetic parameter (b) was also found in the case of sprayed NiCo2O4 film (b = 42 mV decade-1) [37], CuCo2O4 films (b = 42 mV decade-1), Ni, LaPO4- bonded on
Ni; prepared by thermal decomposition of the metal nitrates [38, 39], electrodeposited Ni-Fe alloys on mild steel (b = 37- 45 mV decade-1) [40]. As for as the order is concerned, both first and second order kinetics have been reported for oxygen evolution on the oxide electrodes with respect to [OH-].
-0.7 -0.6 -0.5 -0.4 -0.3 -0.2 -0.1 0.0 0.1 0.2
-5.0 -4.5 -4.0 -3.5 -3.0 -2.5 -2.0 -1.5
lo
g
j /
A cm
-2
log [OH-]
[image:8.596.164.429.188.389.2]At 650 mV Fe3O4 Co0.5Fe2.5O4 CoFe2O4 Co1.5Fe1.5O4
Figure 6. Plot of log j vs log COH- of the oxide electrodes at a constant potential (E = 650 mV) across
the oxide/1M KOH interface at 250C.
Figure 7. Tafel plots on Ni/Co1.5Fe1.5O4 at potential scan rate of 0.2 mV s-1 in 1M KOH at different
temperatures. (a) 200C, (b) 300C, (c) 400C and (d) 500C
It is noteworthy that the electrocatalytic activity of CoxFe3-xO4 (0 ≤ x ≤ 1.5) electrodes prepared
[image:8.596.95.503.446.647.2]
NiFe2O4 in 30 wt% KOH. However, Co-substituted ferrite electrodes prepared by us gave the same
current density at O2 ≈ 0.36 V in 1M KOH at 25 0C. The ηO2 is the formal overpotential; ηO2 = E -
EO2/OH-, where E and EO2/OH- (= 0.303 V vs Hg/HgO) are the applied potential across the catalysts/1M
KOH interface and the theoretical equilibrium potential in 1M KOH at 25 0C. Singh et. al. [20] observed 1.2 mA cm-2 (at E = 0.7 V) in 1M KOH at 25 0C, particularly, for the CuFe2O4 electrode
prepared by the hydroxide precipitation method at controlled pH (= 11). Very recently, at the same potential, Al-Mayouf et. al. [41] observed ~ 6 mA cm-2 with nickel ferrite electrode prepared by hydrothermal method. However, cobalt ferrites in this study produced more than 10 mA cm-2 at the same potential.
3.1 3.2 3.3 3.4 3.5
0.0 0.2 0.4 0.6 0.8 1.0 1.2 1.4 1.6 1.8 2.0
lo
g
j/ mA cm
-2
1/T X 103
at 675 mV Co1.5Fe1.5O4
[image:9.596.168.433.254.458.2]Fe3O4
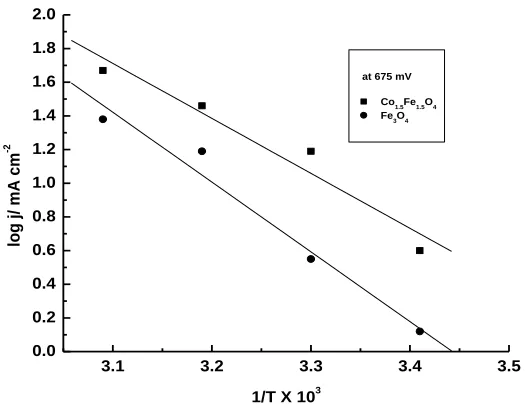
Figure 8. Arrhenius plot for oxygen evolution reaction on CoxFe3-xO4 at a constant potential (E =675
mV)
The effect of temperature on the OER has also been studied at the two oxide electrodes i.e. Fe3O4 and Co1.5Fe1.5O4. For the purpose, Tafel polarization curve was recorded in 1M KOH at four
different temperatures (20, 30, 40 and 500C). A set of four anodic polarization curves is shown in the Fig. 7 for the case of Co1.5Fe1.5O4. The standard enthalpy of activation (∆H0#el) was estimated from the
slope of the plot log j vs 1/T (Fig. 8) at constant potential (E = 675mV). Values of activation energy were found to be 81.3 and 67.9 kJ mol-1 for Fe3O4 and Co1.5Fe1.5O4, respectively, at E = 675 mV.
These values of ∆H0#
el were very similar to that observed by Singh et. al. [19] at E = 560 mV.
However, values were much higher than those reported on Adams-RuO2 (49 kJ mol-1) [42], oxide
coated Co50Ni25Si15B10 amorphous alloy (40 kJ mol-1) [43] and Cu0.9Co2.1O4 (45.2 kJ mol-1) [44].
∆H0#
- αFηby using the average value of transfer coefficient. The data shown in Table 3 indicates that Co-substitution in the base oxide decreases the ∆H0# value. Values of standard entropy of activation (∆S0#
) (Table 3) for oxygen evolution was found to be highly negative. This suggests the role of adsorption phenomenon in the electrochemical formation of oxygen. The ∆S0#
values were calculated by using the relation [45].
∆S0# = 2.3R [log j + ∆H0#
el /2.3RT – log (nFωCOH-)]
Where, ω (= kBT/h) is the frequency term and n = 2. All the terms in the above equation have
their usual meanings. The estimated values of transfer coefficient (α), standard enthalpy of activation (∆H0#) and entropy of activation (∆S0#
[image:10.596.69.524.297.376.2]) as shown in Table 3, were found to be very close to that reported in literature [19].
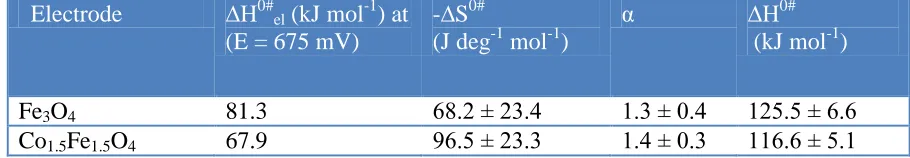
Table 3. Thermodynamic parameters for O2 evolution on Ni/CoxFe3-xO4 (0 ≤ x ≤ 1.5) 1M KOH
Electrode ∆H0#el (kJ mol-1) at
(E = 675 mV)
-∆S0#
(J deg-1 mol-1)
α ∆H0#
(kJ mol-1)
Fe3O4 81.3 68.2 ± 23.4 1.3 ± 0.4 125.5 ± 6.6
Co1.5Fe1.5O4 67.9 96.5 ± 23.3 1.4 ± 0.3 116.6 ± 5.1
4. CONCLUSION
The study shows that the substitution of Co for Fe in the base oxide greatly enhances the electrocatalytic activity of the oxide toward the OER. The Co1.5Fe1.5O4 electrode showed about 3 - 9
times higher activity as compared to the base oxide in 1M KOH at 250C. Co-substitution also reduces the value of standard enthalpy of activation.
ACKNOWLEDGEMENTS
The authors are thankful to Department of Science and Technology (DST), New Delhi for financial support under Fast Track Scheme for Young Scientist (Project No.: SR/FT/S-044/2009).
References
1. E. J. M. O’Sullivan, E. J. Calvo (1987) In: R.G. Compton (ed) Comprehensive chemical kinetics, vol. 27. Elsevier, Amsterdam, pp 247-360.
2. S. Trasatti, G. Lodi (1981) In: S. Trasatti (ed) Electrodes of conductive metallic oxides, part B, Elsevier, Amsterdam, pp 521-625.
3. S. Trasatti (1994) In: J. Lipkowski, P. N. Ross (eds) Electrochemistry of novel materials. VCH, New York, pp 207-295.
4. P. Lahari and S. K. Sengupta, J. Chem. Soc. Faraday Trans. 91(19) (1995) 3489-3494. 5. R. R. Rajaram, A. Sermon, J. Chem. Soc. Faraday Trans. 81 (1985) 2577-2591. 6. H. M Kota, J. Katan, M. Chin and F. Schoenweis, Nature, London, 203 (1964) 1281. 7. G. Zhao, J.-J. Xu, H.-Y. Chen, Electrochem. Commun. 8 (2006) 48–54.
8. H. K. Harold and C. K. Mayfair, Adv. Catal. 33 (1985) 159-198.
10.J. Orehotsky, H. Huang, C.R. Davidson, S. Srinivasan, J. Electroanal. Chem. 95 (1979) 233-235. 11. I. Nikolov, R. Darkaou, E. Zhechevo, R. Stayanova, N. Dimitrov, T. Vitanov, J. Electroanal.
Chem. 429 (1997) 157-168.
12.N. K. Singh, S. K. Tiwari, K. L. Anitha, R. N. Singh, J. Chem. Soc. Faraday Trans. 92(13) (1996) 2397-2400.
13.Guo-Hui Li, Li-Zhem Dai, Da-Shun Lu and Shao-Yi Peng, J. Solid State Chemistry, 89 (1990) 167-173.
14.M. El Baydi, G.Poillerat, J. L. Rehspringer, J. L. Gautier, J. F. Koenig and P. Chartier, J. Solid State Chem, 109 (1994) 281-288.
15.J. L. Martin se Vidales, O Garcia Martinez, E. Vila, R. N. Rojas and M. J. Torralvo, Mat. Res. Bull., 28 (1993) 1135-1143.
16.F. Svegl, B. Orel, I. Grabec-Svegl, V. Kaucic, Electrochim. Acta 45 (2000) 4359–4371. 17.E. Rios, P. Chartier, J.-L. Gautier, Solid State Sci. 1 (1999) 267-277.
18.P. D. Allen, N. A. Hampson, G.J. Bignold, J. Electroanal. Chem. 99 (1979) 299-309. 19.R. N. Singh, N. K. Singh, J. P. Singh, Electrochim. Acta 47 (2002) 3873-3879. 20.J. P. Singh, N. K. Singh, R. N. Singh, Int. J. Hydrogen Energy 24 (1999) 433-439. 21.R. N. Singh, J. P. Singh, B. Lal, A. Singh, Int. J. Hydrogen Energy 32 (2007) 11–16. 22.N. K. Singh, R. N. Singh, Ind. J. Chem. 38A (1999) 491–495.
23.R. N. Singh, J. P. Singh, A. Singh, Int. J. Hydrogen Energy 33 (2008) 4260–4264.
24.Santosh Bhukal, Tsering Namgyl, S. Mor, S. Bansal, Sonal Singhal, J. of Molecular Structure 1012 (2012) 162-167.
25.S. K. Tiwari, P. Chartier and R. N. Singh, J. Electrochem. Soc. 142(1) (1995) 148-153. 26.B. Gillot, M. Laarj, S. Kacim, J. Mater. Chem. 7 (1997) 827-831.
27.B. Gillot, V. Nivoix, E. Kester, O. Nusillard, C. Villette, Ph. Tailhades, A. Rousset, Mater. Chem. Phys. 48 (1997) 111-118.
28.B. Dong, B.L. He, Y.M. Chai, C.G. Liu, Mater. Chem. Phys. 120 (2010) 404-408.
29.X. Wang, H. Luo, H. Yang, P.J. Sebastian, S.A. Gamboa, Int. J. Hydrogen Energy 29 (2004) 967-972.
30.S. K. Tiwari, K. L. Anitha, R. N. Singh, J. Electroanal. Chem. 319 (1991) 263-274. 31.C. Iwakura, A. Honji, H. Tamura, Electrochim. Acta 26 (1981) 1319-1326.
32.P. Rasiyah and A.C.C. Tseung, J. Electrochem. Soc. 130(12) (1983) 2384-2386. 33.P. Rasiyah and A.C.C. Tseung, J. Electrochem. Soc. 130(2) (1983) 365-368.
34.R. N. Singh, J. P. Singh, H. N. Cong, P. Chartier, Int. J. Hydrogen Energy 31 (2006) 1372-1378. 35.R. N. Singh, J. P. Singh, B. Lal, M. J. K. Thomas, S. Bera, Electrochim. Acta 51 (2006)
5515-5523.
36.M. E. G. Lyons, M. P. Brandon, J. Electroanal. Chem. 641 (2010) 119-130.
37.S. K. Tiwari, S. Samuel, R. N. Singh, G. Poillerat, J.-F. Koenig, P. Chartier, Int. J. Hydrogen Energy 20 (1995) 9-15.
38.N. Fradette, B. Marsan, J. Electrochem. Soc. 145 (1998) 2320–2327. 39.K. Fatih, B. Marsan, Can. J. Chem. 75 (1997) 1597–1607.
40.R. N. Singh, J. P. Pandey, K. L. Anitha, Int. J. Hydrogen Energy 18 (1993) 467-473.
41.M.S. AL-Hoshan, J. P. Singh, A. M. Al-Mayouf, A. A. Al-suhybani and M. N. Shaddad, Int. J. Electrochem. Sci., 7 (2012) 4959-4973.
42.A. Mills, H. L. Davis, Electrochim. Acta 37(7) (1992) 1217-1225.
43.T. Kessler, W. E. Triaca, A. J. Arvia, J. Appl. Electrochem., 24 (1994) 310-315.
44.I. Nikolov, R. Darkaou, E. Zhecheva, R. Stoyanova, N. Dimitrov, T. Vitanov, J. Electroanal. Chem. 429 (1997) 157-168.