1. Introduction
Production of fish in aquaculture is increasingly contributing to global food fish supply. Already in 2006 almost every second food fish was aquaculture produced (Cressy, 2009). The global finfish production increased by 90% during the last decade (2004-2014) (FAO, 2016). Thus, demands for high quality and protein rich feed ingredients is growing, too. This is especially the case for organic aquaculture as all feed ingredients must be organically or sustainably certified, thus strongly limiting the availability of feed ingredients and influencing the prices. Traditionally, fishmeal is the most important protein source for aqua feeds but fishmeal supply from targeted fishery is limited to around 5.5-6.5 million metric tons annually (Hardy, 2010) resulting in continuously
decreasing fishmeal levels in fish feeds (Deutsch et al.,
2007; Naylor et al., 2009). Furthermore, some of the fish
currently used for fishmeal production could directly be
consumed by humans (Fréon et al., 2014). For organic
aquaculture the situation is even more complicated as the implementation of conventionally produced fishmeal, i.e. fishmeal from targeted reduction fishery, is prohibited
according to all organic and almost all sustainability directives or standards, such as the standard for organic aquaculture of the European Union (EC, 2009), Naturland (Naturland, 2014), Soil Association (Soil Association, 2016), Bio Suisse (2015) and the Aquaculture Stewardship Council (ASC, 2012). Instead, fishmeal produced from trimmings of food fish or from fish caught under a sustainability scheme (e.g. Marine Stewardship Council) needs to be used which, in case of fishmeal from trimmings, contains relatively more Phosphorous than other fishmeal. As a consequence of the limited fishmeal resources, plant derived protein sources have been increasingly utilised for aquaculture feeds in the last decade, with soy beans and soy protein concentrate, wheat and wheat gluten, corn, canola, cottonseed, peas/ lupines and barley being the most important alternatives
(Naylor et al., 2009; Olsen and Hasan, 2012). Still, in terms
of land use efficiency, the direct competition between plants being produced as animal feed, versus plants produced
as human food remains an unsolved issue (Cassidy et al.,
2013; Schader et al., 2015).
Hermetia illucens meal as fish meal replacement for rainbow trout on farm
T. Stadtlander1*, A. Stamer1, A. Buser1,2, J. Wohlfahrt1, F. Leiber1 and C. Sandrock1
1Research Institute of Organic Agriculture, Ackerstr. 113, 5070 Frick, Switzerland; 2ETH Zurich, Institute of Agricultural Sciences, Animal Nutrition, Universitaetstrasse 2, 8092 Zurich, Switzerland; timo.stadtlander@fibl.org
Received: 14 November 2016 / Accepted: 6 May 2017 © 2017 Wageningen Academic Publishers
RESEARCH ARTICLE
Abstract
In a 7-week on-farm feeding trial rainbow trout (Oncorhynchus mykiss) were provided with a diet containing 28%
mechanically de-fatted insect meal prepared from larvae of the black soldier fly, Hermetia illucens (HIM) and compared to
a control that received a certified organic and fishmeal based diet. In the test diet insect meal replaced almost 50% of the fishmeal. The whole experiment was conducted under practical conditions on an organically certified rainbow trout farm in Switzerland. Fish of initially 66.5±2.3 g body weight were grown to 125±4.5 g and assessed for their growth performance, as well as analysed for their proximate composition, feed conversion ratio, fatty acid contents and organoleptic properties. Improved lipid utilisation and decreased protein utilisation were observed in fish fed the HIM diet. Furthermore, in a controlled degustation no differences except a slightly darker coloration of fish fed HIM were observed. The experiment demonstrated that substantial replacement of fishmeal by insect meal is possible without compromising growth, feed conversion and product quality. However, the decreased protein utilisation efficiency in HIM fed fish might lower production efficiency when applied over a whole production cycle and not only over 7 weeks.
Keywords: insect meal, fishmeal replacement, growth performance, feed conversion, organoleptic properties
OPEN ACCESS
Besides plant based protein sources several animal based feedstuffs are readily available and utilised too (Naylor et al., 2009). The interest in insects as feed for a variety
of livestock species is strongly increasing (Barroso et al.,
2014; Henry et al., 2015; Makkar et al., 2014;
Sánchez-Muros et al., 2014). One particularly promising candidate
insect species is the black soldier fly, Hermetia illucens,
because it can be employed to convert food waste material or manure into high quality insect protein highly suitable
to be implemented in animal feed (Sheppard et al., 1994).
It is native to Central and Latin America and large parts of the USA, yet secondarily established in virtually all (sub-)
tropical regions worldwide (Sheppard et al., 1994). The
protein and lipid content of H. illucens meal (HIM) is highly
variable; based on dry matter, protein and lipid contents reported for de-fatted HIM were 47.2 and 11.8% (Kroeckel et al., 2012) and 51.8 and 14.8%, respectively (Cullere et
al., 2016), whereas protein and lipid content reported for
full-fat HIM were 36.2 and 18.0% (Barroso et al., 2014). Its
potential as a valuable feed ingredient has been reported for several livestock species, such as poultry (cockerels, Hale,
1973; layer hens, Maurer et al., 2016; broilers, Leiber et al.,
2017; Cullere et al., 2016), pigs (Newton et al., 1977) and a
number of commercially important cultured fish species
like Atlantic salmon (Salmo salar, Lock et al., 2015), channel
catfish (Ictalurus punctatus) and blue tilapia (Oreochromis
aureus, Bondari and Sheppard, 1981, 1987), Nile tilapia, (Oreochromis niloticus, Hem et al., 2008; Webster et al.,
2015), rainbow trout (Oncorhynchus mykiss, Gasco et al.,
2015; Sealey et al., 2011; St-Hilaire et al., 2007) and turbot
(Psetta maxima, Kroeckel et al., 2012).
The rainbow trout is the most important freshwater aquaculture species in central Europe with a total production volume of 294,000 metric tons (mt) in 2014 (FAO, 2016). In Switzerland the production volume was 1,100 mt out of 1,393 mt total volume in 2014, thus, making it by far the most important cultured species of which around 30% are organically certified (FAO, 2016; Stadtlander and Gerber, 2014).
The aim of this experiment was to evaluate de-fatted HIM as replacement of approximately half of the fishmeal in extrusion cooked and organically certified trout feed. In a seven week experiment the growth performance, feed and nutrient conversion and organoleptic properties of rainbow trout fed with either a commercial control feed or a feed with high fishmeal replacement by HIM were compared.
2. Materials and methods
Production of insect meal
Freshly emerged H. illucens larvae were fed with chicken
feed (Demeter layer hen crumble) for 10 days until reaching the second larval stage. Later on they were fed
with vegetarian preconsumer food waste supplied by
convenience industry. The feeding substrate for H. illucens
larvae was basically composed of pasta, spent brewer grains and fruit and vegetable leftovers. When the majority of the larvae reached the prepupal stage, they were separated from debris, killed by freezing at -20 °C and stored frozen until further processing. The prepupae were washed in water and cleaned from debris, oven dried for 24-34 hours at 60 °C and coarsely ground. Afterwards the insects were mechanically defatted with a small scale commercial oil press (KK 20 F Universal; Screw Press, Reut, Germany) and the press cake was milled in order to obtain a homogenous meal. The defatted HIM was stored frozen until fish feed production.
Experimental diets
Two different diets, one commercial and one experimental diet, were applied. Manufacturing of both diets using extrusion-cooking in a commercial-scale extruder was commissioned to Hofmann Nutrition AG (Bützberg, Switzerland). The standard organic grow-out feed ‘Natura Trout’ (certified under the Bio Suisse regulation) served as control diet (diet C) and contained the ingredients fishmeal, wheat flour, soy meal, blood meal, vitamin and mineral
premixes and the immunostimulant Immuguard
®
. The sameingredients with the same proportions have been used for the H. illucens meal diet (diet HIM) with the only difference that 46% of the fishmeal has been substituted by HIM, which in turn corresponded to 28.1% of the final diet. The pellet size was 3 mm; the proximate composition of both diets is presented in Table 1. The formulation details are confidential property of Hofmann Nutrition AG and have not been cleared for publication. The digestible energy was estimated by caloric equivalents of 16.7 MJ/kg for nitrogen free extracts (NFE), 33.5 MJ/kg for crude lipids (CL) and 19.6 MJ/kg for crude protein (CP) according to Brett and
Table 1. Proximate composition of the control (C) and the
Hermetia illucens meal (HIM) diets. Values derived from one
pooled sample per feed type.
Proximate analyses Diet C Diet HIM
Crude protein (g/kg DM) 457 491 (477)1
Crude lipids (g/kg DM) 151 126
Ash (g/kg DM) 134 126
Crude fibre (g/kg DM) 13 44
Nitrogen free extract (g/kg DM) 189 164 Digestible energy (MJ/kg DM) 17.2 17.0 (16.3)1
DP:DE ratio (g/MJ)2 23.5 25.9 (25.5)1
1 Crude protein corrected for crude fibre (presumably corresponding to
chitin in the HIM; see Lovell et al., 1968).
2 DP:DE = estimated digestible protein to digestible energy ratio in
g digestible protein per MJ digestible energy.
Groves (1979). The digestibility of CP in both diets was estimated to be 83.1% (based upon an average gross energy content in CP of 23.6 MJ/kg (NRC, 2011) and the digestible energy content of 19.6 MJ/kg (Brett and Groves, 1979)).
Experimental setup and fish
The experiment was conducted on an organically certified trout farm in Switzerland under practice conditions. The farm is designed as water re-use system comprising of
three channels running in a circle with seven 65.1 m3
compartments per side (14 per channel), a fluid bed bio filter at each end and a drum filter at the distal end. The water in each channel is flowing circularly through all compartments and the respective water flow rate is approximately 200 l/s. Around 10% of the total water volume was exchanged per day. For the experiment the two compartments directly downstream of one of the bio filters were used. This setup was replicated in each of the three channels resulting in three independent replicates for each treatment. At the beginning of the experiment each compartment was stocked with a total of 191.3 kg rainbow trout with an average individual weight of 66.5±2.3 g (mean ± standard deviation), corresponding to an initial
stocking density of 2.91 kg per m3 and 2,874±100 fish in
each compartment, respectively.
The fish were hand fed four times per day according to the water temperature and their biomass under a restrictive scheme adapted from the feed manufacturer (Table 2). The water temperature was ambient and ranged between 8.7 and 12.1 °C. Every second week around 100 fish were weighed in each compartment to adjust feeding rations. When the water was too turbid, for instance after heavy rainfall, no feed was provided (this happened on 2 days).
In order to evaluate the growth performance and nutrient utilisation the following parameters were calculated:
Percent weight gain (PWG; %) = (final body weight (g) – initial body weight (g)) / initial body weight (g) × 100
Specific growth rate (SGR; %/day) = (ln final body weight (g) – ln initial body weight (g)) / days of experiment × 100
Feed conversion ratio (FCR) = total dry feed intake (g) / (final body weight (g) – initial body weight (g))
Protein efficiency ratio (PER) = (final body weight (g) – initial body weight (g)) / total protein intake (g) × 100
Protein productive value (PPV; %) = (final fish protein content (g) – initial fish protein content (g)) / total protein intake (g) × 100
Lipid efficiency ratio (LER; %) = (final body weight (g) – initial body weight (g)) / total lipid intake (g) × 100
Lipid productive value (LPV) = (final fish lipid content (g) – initial fish lipid content (g)) / total lipid intake (g)
Viscerosomatic index (VSI; %) = viscera weight (g) / final body weight (g) × 100
Hepatosomatic index (HSI; %) = liver weight (g) / final body mass (g) × 100
Water quality
Oxygen content, pH and temperature of the water were measured daily with a hand-held Hach HQ 40d multi (Hach Company, Loveland, CO, USA). Once a week ammonia-N, nitrite-N and nitrate-N were measured spectrophotometrically with test-kits from Hach Company and calculated as ammonia, nitrite and nitrate.
Sampling
Prior to each sampling occasion, all fish were starved for one day in order to ensure that digestive tracts have been cleared. Before the experimental feeding started, 10 fish from the initial stock were randomly sampled as a reference for proximate composition. At the end of the 7-week feeding trial, 10 fish per replicate (30 per treatment) were randomly sampled for determination of proximate composition and morphometric characteristics. Collections of morphometric data included body weight and fork length, and the visceral fat coverage estimated on a scale of 0 to 4, corresponding to 0-100% coverage, respectively. Further, the viscera were dissected and weighed before dissecting and weighing the liver. Afterwards all viscera, including the liver, were frozen together with the rest of the respective fish until further analysis. All fish intended for morphometric and proximate composition analysis were euthanized using 150 mg/l MS-222 buffered with 300 mg/l sodiumhydrogencarbonate, and then frozen at -18 °C until further analysis. Also at the end of the experiment, another 10 fish per replicate were starved for five days, electrically stunned, exsanguinated and kept on crushed ice for the organoleptic test the next day. Table 2. Feeding table adapted from the feed manufacturer
showing daily feeding allowance (as % of body weight per day).
Weight of fish (g) Water temperature (°C)
8 9 10 11 12
50-100 1.28 1.36 1.44 1.52 1.59
100-200 1.13 1.20 1.27 1.34 1.40
Chemical analysis
For chemical analyses, the fish sampled initially before the feeding trial started and at the end of the experiment were homogenised and then pooled for each replicate per treatment, resulting in one initial sample and six samples taken at the end of the experiment. For homogenisation, they were cut into small pieces while still frozen, autoclaved for 15 minutes at 121 °C and turraxed with an Ultra-Turrax T25 (IKA-Labortechnik, Staufen, Germany). The homogenate was frozen again and lyophilised subsequently using a model Beta 1-16 (Christ, Osterode am Harz, Germany) in order to determine the water contents of each sample before they were finely ground and subjected to further analyses. For amino (AA) and fatty acid (FA) determination, aliquots of the three replicated samples per treatment were again pooled resulting in one sample per treatment. Feed pellets of both feeds were ground into a fine powder prior to analysis.
Chemical analyses of CP, CL, crude fibre (CF) and ash (CA) was conducted for fish and feed samples according to standards defined by the Association of German Agricultural and Analytic Research Institutes (VDLUFA, 2017). NFE has been calculated by difference (100 – CP + CL + CA + CF). AA and FA determination have been conducted by chromatographical methods according to standard methods of the German Society for Fat Science (DGF, 2015). The FA concentrations are presented as fatty acid methyl esters.
Organoleptic test
For the organoleptic test the fish were filleted, the fillets cut into three equally large pieces, wrapped in aluminium-foil and steam-cooked without pressure for 8-10 minutes at 100 °C. The organoleptic test was conducted according to DIN EN ISO 5495. Fifteen untrained panellists were offered double blind testing samples of the filet for differences in odour, colour, texture and taste, each in 5 (texture in 6) different traits. The panellists then rated the different characteristics on a scale between 0 (does not apply) to 9 (applies fully).
Statistical analysis
All data are presented as mean ± standard deviation (n=3) if not indicated otherwise. Statistical analyses were performed using IBM SPSS vers. 21 (IBM Corporation, Armonk, NY, USA). Normal distribution of the data was assessed using Kolmogorov-Smirnov and homogeneity of variance was assessed using Levene tests. In case of normal distribution and homogeneity of variance, treatment means of the C and HIM fed fish were compared using t-tests with compartment as individual unit and three replicates per treatment, accordingly. In case criteria of
normal distribution or homogeneity of variance were not met non-parametric Mann-Whitney-U tests were applied. Alpha-levels were set to 0.05.
3. Results
Chemical analyses revealed differences in the proximate composition of the two different feeds. As compared to diet C, diet HIM contained higher levels of CP and CF and lower levels of CL and CA (Table 1). The AA profiles of the diets and the requirements of the essential AA or rainbow trout is presented in Table 3.
Diet C was deficient in threonine and isoleucine, diet HIM was deficient in methionine and both diets were almost equally deficient in lysine (Table 3). The fatty acid profiles of both diets are presented in Table 4. Diet HIM had a considerably higher overall level of saturated fatty acids (SFA) and a lower level of unsaturated fatty acids (UFA) in comparison to diet C. This is also reflected in the ratio of UFA to SFA which was considerably higher in diet C compared to diet HIM. The main differences in UFA content are caused by oleic acid, eicosaenoic acid and erucic acid, but also the level of the important
poly-Table 3. Whole amino acid profiles of the experimental diets (control; C, and Hermetia illucens meal; HIM) (g/100 g DM) and the requirements of essential amino acids for rainbow trout (g/100 g DM, NRC, 2011). Dietary amino acid concentrations not reaching the requirements are shown in bold. Values derived from pooled samples of the three replicates per treatment.
Amino acid Diet C Diet HIM Requirements1
Aspartic acid 2.46 2.80
Threonine 1.03 1.17 1.1
Serine 0.96 1.21
Glutamic acid 3.21 3.57
Proline 1.71 1.78
Glycine 1.99 2.34
Alanine 1.96 2.46
Cysteine 0.30 0.33
Valine 1.50 1.78 1.2
Methionine 0.70 0.66 0.7
Methionine + cysteine 1.00 0.99 1.1
Isoleucine 1.01 1.17 1.1
Leucine 2.23 2.36 1.5
Tyrosine 0.77 1.18
Phenylalanine 1.22 1.35 0.9
Phenylalanine + tyrosine 1.99 2.53 1.8
Histidine 0.96 1.32 0.8
Lysine 1.94 1.99 2.4
Arginine 1.50 1.66 1.5
1 Requirements according to NRC (2011).
[image:4.567.294.519.457.722.2]unsaturated fatty acids (PUFA) arachidonic acid (ARA), eicosapentaenoic acid (EPA) and docosahexaenoic acid (DHA) were reduced by one third in diet HIM compared to diet C. The SFA lauric acid was only present in diet HIM and contributed considerably to the low UFA:SFA ratio in diet HIM (Table 4).
Mortality, final body weight, growth (relative weight gain and specific growth rate), feed conversion, viscero- and hepatosomatic indices and intraperitoneal fat were comparable for fish of both groups (Table 5).
Protein utilisation, however, was significantly higher, even when corrected for assumed chitin content, in fish fed diet C compared to fish fed diet HIM, as indicated by PER and PPV (Table 5). Contrary to the protein utilisation, the apparent lipid utilisation (LER and LPV, Table 5) was significantly improved in fish fed diet HIM compared to fish fed diet C. Carcass composition revealed no significant differences in protein, lipid and ash content between treatments (Table 6).
Table 5. Growth and nutrient utilisation of fish fed with either control (C) or Hermetia (HIM) diets (data = mean ± standard deviation; n=3).
Parameter1 C fed fish HIM fed fish2
Initial body mass (g) 67.0±2.5 66.2±1.9 Final body mass (g) 125.3±4.8 125.5±4.4
PWG (%) 87.8±1.0 89.6±1.7
SGR (%/day) 1.43±0.05 1.45±0.05
FCR 0.80±0.07 0.81±0.04
PER 2.77±0.30 2.51±0.12*
PPV (%) 60.6±6.6 50.9±1.8* (52.4±1.8*)3
LER 8.39±0.90 9.77±0.47*
LPV (%) 47.5±7.3 60.2±4.5*
VSI (%) 10.1±0.8 10.5±0.2
HSI (%) 1.36±0.10 1.40±0.03
Mortality (%) 0.15±0.07 0.22±0.07 Intraperitoneal fat 1.40±0.26 1.43±0.15
1 FCR = feed conversion ratio; HSI = hepatosomatic index; LER = lipid efficiency
ratio; LPV = lipid productive value; PER = protein efficiency ratio; PPV = protein productive value; PWG = percentage weight gain; SGR = specific growth rate; VSI = viscerosomatic index.
[image:5.567.293.522.108.298.2]2* = significant difference (P<0.05). 3 Corrected for estimated chitin.
Table 6. Proximate composition of the fish at the beginning and after 7 weeks of feeding. Values = mean ± standard deviation (n=3 for the control diet and Hermetia illucens meal, and a single pooled sample of 10 fish for initial analysis).1
Initial C fed fish HIM fed fish
Moisture (%) 71.3 73.0±0.5 72.9±0.3 Crude protein (% FM) 10.8 16.2±0.9 15.2±0.3 Crude lipids (% FM) 6.73 6.30±0.36 6.46±0.22 Ash (% FM) nd 2.20±0.04 2.28±0.05 Gross energy (kJ/g FM) 7.93 6.95±0.18 6.92±0.11
[image:5.567.49.273.384.702.2]1 FM = fresh matter; nd = not determined.
Table 4. Fatty acid profiles of the two experimental diets (control; C, and Hermetia illucens meal; HIM) (g/100 g fatty acid methyl esters). Values derived from pooled samples of the three replicates per treatment.1
Fatty acid Trivial name Diet C Diet HIM
C12:0 lauric acid – 14.8
C14:0 myristic acid 4.30 5.70
C14:1 myristoleic acid 0.12 0.15 C15:0 pentadecyclic acid 0.35 0.30
C16:0 palmitic acid 14.0 13.5
C16:1 n-7 palmitoleic acid 4.60 3.91
C18:0 stearic acid 2.70 2.38
C18:1 n-9 oleic acid 28.6 25.7
C18:2 n-6 linoleic acid 10.9 10.3 C18:3 n-3 linolenic acid 2.75 2.28 C18:4 n-3 stearidonic acid 0.56 0.45
C20:0 arachidic acid 0.24 0.20
C20:1 n-9 eicosenoic acid 8.98 6.06 C20:4 n-6 arachidonic acid 1.59 1.06 C20:5 n-3 eicosapentaenoic acid 3.83 2.59
C22:0 behenic acid 0.22 0.15
C22:1 n-9 erucic acid 9.99 6.35
C22:5 n-3 sardine acid 0.98 0.68 C22:6 n-3 docosahexaenoic acid 4.55 3.06 C24:0 lignocerine acid 0.68 0.38
S SFA S SFA 22.5 37.4
S UFA S UFA 77.5 62.6
UFA:SFA 3.44 1.67
1 SFA = saturated fatty acids; UFA = unsaturated fatty acids.
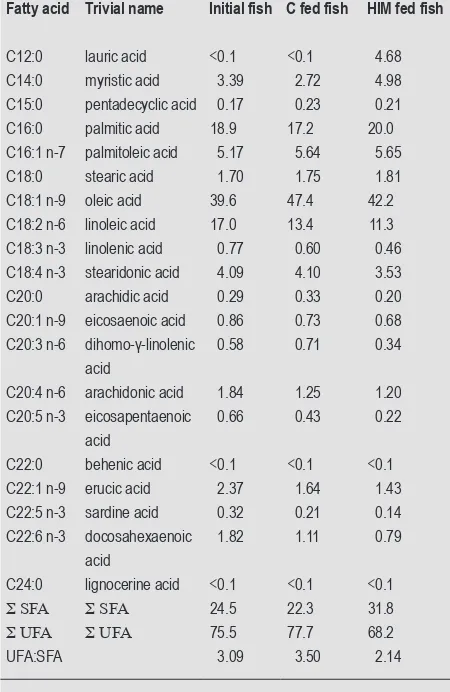
At the end of the experiment, fish fed with HIM had a lower content of UFA and a higher content of SFA compared to the initial fish and those fed with diet C. The relative increase in SFA of HIM fed fish, as compared to the initial fish, is caused by increasing levels of lauric (C12:0), myristic (C14:0) and palmitic (C16:0) acid contents (Table 7). In conjunction with a decrease of the content of linoleic acid (C18:2 n-6) also a reduction of the UFA:SFA ratio of HIM fed fish was observed over the experiment while the C fed fish showed an increase of UFA:SFA ratio (Table 7). The UFA:SFA ratio in C fed fish increased, as compared to the initial fish, mainly due to an increase in oleic acid and decreases of levels of myristic and palmitic acid. Levels of linoleic acid decreased in both treatments, though less pronounced in fish receiving diet C. Compared to initial fish, both treatments exhibited reductions in the levels of ARA, EPA and DHA, whereas those in the two latter FAs were more pronounced in HIM fed fish (Table 7).
The panellists in the organoleptic trial did not detect any differences in any of the evaluated traits of odour, texture or taste between fish originating from different feeding regimes. The sole difference perceived was a slightly darker
colour of filets (P=0.048) when fish were fed with HIM
(Figure 1).
4. Discussion
Both diets were readily accepted by the fish throughout the entire experiment and all feed was taken up within 5 minutes after feeding. The overall weight gain, final weight and SGRs after the seven week experiment did not differ between C and HIM fed fish (Table 5). Similarly the FCRs did not differ between both treatments, and, reaching values around 0.8, were well below the estimated global average FCR of 1.3 for trout in 2015 (Tacon and Metian, 2008). Previous studies incorporating HIM in fish diets reported partly conflicting results compared to our study. Rainbow trout fed with 15% HIM in the diet were reported to show no differences in growth performance and feed conversion but had a reduced lipid content. In the same study, inclusion of 30%, however, resulted in significantly reduced growth,
feed conversion and lipid content (St.-Hilaire et al., 2007).
Different results were obtained in a study of Sealey et al.
(2011) who found that ‘nutritionally enriched’ (due to feeding of fish offal to the insect larvae) HIM in levels up to 36% in rainbow trout diets did not result in statistically reduced growth. In the same study, however, non-‘enriched’ HIM, resulted in significantly negative effects even at 16%
inclusion (Sealey et al., 2011).
The growth during our experiment was comparable to that
reported by Sealey et al. (2011) who observed 93% weight
gain of fish fed with a diet containing 32% non-enriched HIM over eight weeks. Though growth rates in this range appear very low compared to those reported by St.-Hilaire et al. (2007) (530-621% relative weight gain over a 9-week period). The most important difference between those studies and our study was the feeding regime which was
restricted in our study while Sealey et al. (2011) and
St.-Hilaire et al. (2007) fed 2 and 3 times per day, respectively,
until apparent satiation. Our feeding levels were chosen to be comparatively low (Table 2) on purpose in order to have good feed conversion ratios rather than to optimise growth response. This is in accordance with organic regulations of Bio Suisse for Switzerland (Bio Suisse, 2015) as the total production period for organic trout must be a minimum of 18 months resulting in slow growth but high feed utilisation efficiency. Besides that, the temperatures reported by
St.-Hilaire et al. (2007) and Sealey et al. (2011) were 14.3 and
14.5 °C, respectively, while the average temperature in our study was only 10.0 °C. Furthermore the starting weights of the fish differed significantly between the studies (~25 g in
St.-Hilaire et al., 2007, 145 g in Sealey et al., 2011 and 66.5
[image:6.567.48.273.353.699.2]g, this study). The last but not least important difference Table 7. Fatty acids of the initial fish and the fish fed with the two
different experimental diets (control; C, and Hermetia illucens meal; HIM (g/100 g fatty acid methyl esters).1
Fatty acid Trivial name Initial fish C fed fish HIM fed fish
C12:0 lauric acid <0.1 <0.1 4.68 C14:0 myristic acid 3.39 2.72 4.98 C15:0 pentadecyclic acid 0.17 0.23 0.21 C16:0 palmitic acid 18.9 17.2 20.0 C16:1 n-7 palmitoleic acid 5.17 5.64 5.65 C18:0 stearic acid 1.70 1.75 1.81 C18:1 n-9 oleic acid 39.6 47.4 42.2 C18:2 n-6 linoleic acid 17.0 13.4 11.3 C18:3 n-3 linolenic acid 0.77 0.60 0.46 C18:4 n-3 stearidonic acid 4.09 4.10 3.53 C20:0 arachidic acid 0.29 0.33 0.20 C20:1 n-9 eicosaenoic acid 0.86 0.73 0.68 C20:3 n-6 dihomo-γ-linolenic
acid
0.58 0.71 0.34
C20:4 n-6 arachidonic acid 1.84 1.25 1.20 C20:5 n-3 eicosapentaenoic
acid
0.66 0.43 0.22
C22:0 behenic acid <0.1 <0.1 <0.1 C22:1 n-9 erucic acid 2.37 1.64 1.43 C22:5 n-3 sardine acid 0.32 0.21 0.14 C22:6 n-3 docosahexaenoic
acid
1.82 1.11 0.79
C24:0 lignocerine acid <0.1 <0.1 <0.1
S SFA S SFA 24.5 22.3 31.8
S UFA S UFA 75.5 77.7 68.2
UFA:SFA 3.09 3.50 2.14
1 SFA = saturated fatty acids; UFA = unsaturated fatty acids.
between the studies was the manufacturing of the feeds, which in our case was extrusion-cooked while compression-pelleting was implemented in the studies of St.-Hilaire et al. (2007) and Sealey et al. (2011). Extrusion generally increases the digestibility and absorption of macro- and micro-nutrients (Sørensen, 2012), thus, likely resulting in improved feed utilisation which may in turn diminish differences between C and HIM fed fish that have been observed elsewhere.
In Atlantic salmon (S. salar), Lock et al. (2015) reported
growth rates between 44-132% for fish fed different levels of two different HIM. They also found that the FCR of fish fed one type of HIM decreased with increasing HIM content, while a second type of HIM had significantly negative effects on growth and FCR only at 100% of fish meal replacement
(Lock et al., 2015). Insect meal inclusion had no impact on
FCR in our study but we observed a generally lower FCR which can partly be explained by the restricted feeding regime and the extrusion processing compared to St.-Hilaire et al. (2007), Sealey et al. (2011) and Lock et al. (2015) who reported higher FCRs of 1.0 to 1.5. However, due to the very low stocking density, a certain impact of natural
food items (e.g. Gammarus spp.) cannot be excluded, as
no stomach content analysis was conducted and the farm is certified organic. In our study, inclusion of HIM lead to a significantly reduced protein utilisation while the lipid utilisation was significantly improved. This pattern may have several reasons, among which the most plausible appears to be linked to protein and lipid digestibility, which has not been evaluated in our study. The apparent digestibility of HIM crude protein and crude lipid were 63.1
and 78.0%, respectively, in turbot (Kroeckel et al., 2012).
That was considerably lower than that typically observed for fishmeal (86-97%) (NRC, 2011). Contrary to the study with turbot, digestion of FA and AA in HIM containing diets was very high in Atlantic salmon (FA between 82.5 and 100%
and AA similar to control diets, i.e. 85-95%) (Lock et al.,
2015). The digestive system of rainbow trout is more closely related to that of Atlantic salmon, both being salmonids. Therefore it may be assumed that the digestibility of HIM
in our study is closer to the values obtained by Lock et al.
(2015) than to the value obtained by Kroeckel et al. (2012).
Lock et al. (2015) noted that especially C12:0, which is one
of the major FA in HIM (Ushakova et al., 2016), remained
highly digestible over all HIM inclusion levels. That could, at least partly, be responsible for the significantly improved 0.00
1.00 2.00 3.00 4.00 5.00 6.00 7.00 8.00
Control Hermetia
Colour-dark* Colour-grey
Colour-rosy Colour-white Odour-pungent Odour-musty Odour-neutral Odour-typical
Odour-pleasant Taste-musty
Taste-bitter
Taste-neutral
Taste-typical
Taste-pleasant
Texture-mushy
Texture-dry
Texture-gaping
Texture-flexible
Texture-juicy Texture-firm
[image:7.567.51.521.61.393.2]Colour-other
Figure 1. Results of the double-blinded organoleptic test. The higher the value, the more the panellists agreed with that characteristic. * = significant difference, Student’s t-test, P=0.048; n=15.
lipid utilisation in our experiment which may also be a sign of improved energy saving or excess dietary digestible energy but not necessarily for improved lipid utilisation. The significantly improved protein utilisation in fish fed diet C is possibly related to an improved digestible protein to digestible energy (DP:DE) ratio compared to fish fed diet HIM. According to NRC (2011) the optimal DP:DE ratio for rainbow trout is 21.6 g/MJ. Both diets in our study had unfavourably high DP:DE ratios (Table 1). It is generally acknowledged that increasing dietary digestible energy at constant protein content, to a certain point, leads to an improved protein utilisation, the so-called protein sparing
effect (Cho and Bureau, 2001; De Silva et al., 1990; Einen
and Roem, 1997; Steffens, 1981). In accordance with the Swiss organic regulation, allowing only up to 15% of lipids in the diet (Bio Suisse, 2015), both our diets contained very low lipid contents for a trout diet. That leads to an increased utilisation of proteins for energetic demands and less protein for somatic growth. However, the lipid level was 25 g/kg higher in diet C compared to diet HIM which results in a lower DP:DE ratio supporting the observed protein sparing effect in fish fed diet C and possibly leading to increased lipid or energy utilisation in diet HIM due to a very high DP:DE ratio. The protein content difference, on the other side, might not be as great as it seems because of the nitrogen content in chitin. The exoskeleton of insects,
also of H. illucens larvae, contains chitin with around
69 g/kg nitrogen on a molecular weight basis. Ignoring the chitin would apparently result in overestimating CP contents. In our study, diet HIM is higher in CP, which is partly explained by the high inclusion level of the HIM. In a study comparing different analytical methods to
determine the chitin content in crayfish meals, Lovell et
al. (1968) reported that the CF content is a good estimator
for chitin. A chitin content in H. illucens larvae of 21 g/kg
fresh matter corresponding to 33.9 g/kg DM was estimated by Finke (2013), which nearly matches the difference in CF between diet C (13 g/kg DM) and diet HIM (44 g/kg DM) in our study. Assuming that the difference in CF between diets C and HIM is related to chitin, the corrected protein content of diet HIM would be 477 g/kg DM instead of 491 g/kg DM. Accurate measurement of the chitin-content is necessary for future investigations as chitin may not only hamper precise estimates of protein contents but possibly triggers advantageous or disadvantageous side-effects like immunostimulation (Sakai, 1999) or, potentially acting as a non-starch polysaccharide, anti-nutritional effects (Sinha et al., 2011).
The protein utilisation in our study was exceptionally high (PPV around 50% for HIM and around 60% for C fed fish) compared to the PPV of other studies utilising
HIM meal (Atlantic salmon: around 40%, Lock et al.,
2015; turbot: between 27 and 37%, Kroeckel et al., 2012).
Given the unfavourably high DP:DE ratios, the high protein utilisation may point towards a very high protein
digestibility and thus high protein quality or is, similarly to the low FCRs, supporting a higher proportion of natural food than assumed. However, without further information on digestibility and true protein content, our data suggest that the protein of diet C was utilised significantly better compared to that of diet HIM due to a higher dietary energy to protein ratio content of the former, while opposing patterns were found for lipids.
The control diet contained comparatively higher levels of UFA than the HIM diet. Although the FA profiles of the fish could only be analysed in a single sample, they are qualitatively discussed here because they show a potential constraint of feeding HIM to fish. Cold- and freshwater fish including salmonids, can cover requirements of essential fatty acids (EFA) by biosynthesising physiologically important PUFA through chain-elongation of linolenic acid as a precursor (Tocher, 2010). The quantitative requirement for linolenic acid was described for rainbow trout as
0.7-1.0% of dietary dry matter by Castell et al. (1972).
However, for several fish species, including salmonids, n-3 PUFA (EPA and DHA) are more effective in meeting the EFA requirements than linolenic acid alone (Tocher, 2010). In the present study, none of the diets appeared to be deficient in EFA although diet HIM contained lower amounts of linolenic acid, EPA and DHA. Thus, our feeding trial suggests a reduction of all UFA, in particular of the n-3 fraction, when HIM is incorporated into fish diets in considerable proportions. This may point to a negative side-effect of HIM, as the high supply of n-3 FA from marine animals is an important issue in the nutritional importance
of fish (Astorg et al., 2004; Koussoroplis et al., 2008)
The estimated intraperitoneal fat content as well as HSI and VSI were not influenced by the different dietary fatty
acid profiles. Lock et al. (2015) argue on the contrary that
in Atlantic salmon HSI and VSI were higher in HIM fed fish because of increased hepatic and intraperitoneal fat content which they relate to the comparatively high content of C12:0 in HIMs and the better utilisation of this short chain FA compared to others.
Aside from the nutrient content and nutritional value of a new feed ingredient set to replace fishmeal, also its effects on product quality, i.e. fish filets, are of importance. Fat is largely responsible for taste in food and, therefore, a better knowledge on the organoleptic properties that different FA profiles may cause is critical. The degustation conducted in our trial revealed solely a significantly darker filet colour of fish fed with HIM compared to control fed fish, while the test panel perceived no significant differences for any of the other selected parameters of taste and odour. This is in accordance with other studies in which HIM fed rainbow
trout (Sealey et al., 2011) or Atlantic salmon (Lock et al.,
2015) have been tested for their organoleptic properties. This is particularly interesting since these studies reported
differences in FA profiles of the HIM fed fish compared to control fed fish that were similar to those detected here.
In conclusion, our on-farm experiment shows that a rainbow trout diet in which almost 50% of the fishmeal has been replaced by HIM performs similar compared to a commercial diet in terms of growth and feed conversion and does not negatively influence product quality. The protein utilisation, however, was decreased in the HIM containing diet and putative reasons deserve further research. In organic aqua feeds fishmeal levels are often, mainly because availability of other organic protein sources is limited, considerably higher (up to 50%) than in conventional feeds for salmonids (around 15%, Olsen and Hasan, 2012). Replacement of a substantial amount of that fishmeal component could reduce the fishmeal content in organic aqua feeds substantially but also improve sustainability of aquaculture feeds in general.
Despite occasionally divergent findings, the present study supports the feasibility of replacing fishmeal in practical aquaculture feeds by insect meal, derived from black soldier fly larvae. Fish of both treatments were growing equally well and showed no differences in feed conversion, chemical composition, morphometric parameters and organoleptic properties. Also, further research is needed in order to enhance the knowledge base on which factors are most important, such as feeding and procession history of the insects, inclusion levels of insect meal, feed production technologies and developmental stage of the fish, just to mention a few.
Acknowledgements
This research was funded by the Swiss Commission for Technology and Innovation (CTI) and COOP. We further thank Christoph Cohendet at New Valfish SA for providing on-farm infrastructure and support, Hofmann Nutrition AG for feed manufacturing and Barbara Gerber for technical assistance in preparing HIM. Two anonymous reviewers are acknowledged for their valuable comments.
References
Aquaculture Stewardship Council (ASC), 2012. Salmon standard, version 1.0. ASC, Utrecht, the Netherlands. Available at: http:// tinyurl.com/l6gh8o3.
Astorg, P., Arnault, N., Czernichow, S., Noisette, N., Galan, P. and Hercberg, S., 2004. Dietary intakes and food sources of n-6 and n-3 PUFA in French adult men and women. Lipids 39: 527-535. Barroso, F.G., De Haro, C., Sánchez-Muros, M.-J., Venegas, E.,
Martínez-Sánchez, A. and Pérez-Bañón, C., 2014. The potential of various insect species for use as food for fish. Aquaculture 422-423: 193-201.
Bio Suisse, 2015. Standards for the production, processing and marketing of ‘BUD’ products. Bio Suisse, Basel, Switzerland. Available at: http://tinyurl.com/m9jozdm.
Bondari, K. and Sheppard, D.C., 1981. Soldier fly larvae as feed in commercial fish production. Aquaculture 24: 103-109.
Bondari, K. and Sheppard, D.C., 1987. Soldier fly, Hermetia illucens L., larvae as feed for channel catfish, Ictalurus punctatus (Rafinesque), and blue tilapia, Oreochromis aureus (Steindachner). Aquaculture and Fisheries Management 18: 209-220.
Brett, J.R. and Groves, T.D.D., 1979. Physiological energetics. In: Hoar, W.S., Randall, D.J. and Brett, J.R. (eds.) Fish physiology, Vol. 8. Bioenergetics and growth. Academic Press, New York, NY, USA, pp. 279-352.
Cassidy, E.S., West, P.C., Gerber, J.S. and Foley, J.A., 2013. Redefining agricultural yields: from tonnes to people nourished per hectare. Environmental Research Letters 8: 034015.
Castell, J.D., Lee, D.J. and Sinnhuber, R.O., 1972. Essential fatty acids in the diet of rainbow trout (Salmo gairdneri): lipid metabolism and fatty acid composition. Journal of Nutrition 102: 93-100. Cho, C.Y. and Bureau, D.P., 2001. A review of diet formulation
strategies and feeding systems to reduce excretory and feed wastes in aquaculture. Aquaculture Research 32: 349-360.
Cressy, D., 2009. Future fish. Nature 458: 398-400.
Cullere, M., Tasoniero, G., Giaccone, V., Miotti-Scapin, R., Claeys, E., De Smet, S. and Dalle Zotte, A., 2016. Black soldier fly as dietary protein source for broiler quails: apparent digestibility, excreta microbial load, feed choice, performance, carcass and meat traits. Animal 10: 1923-1930.
De Silva, S., Gunasekera, R.M. and Shim, K.F., 1990. Interactions of varying dietary protein and lipid levels in young red tilapia: evidence of protein sparing. Aquaculture 95: 305-318.
Deutsch, L., Gräslund, S., Folke, C., Troell, M., Huitric, M., Kautsky, N. and Lebel, L., 2007. Feeding aquaculture growth through globalization: exploitation of marine ecosystems for fishmeal. Global Environmental Change 17: 238-249.
Deutsche Gesellschaft für Fettwissenschaft (DGF), 2015. Deutsche Einheitsmethoden zur Untersuchung von Fetten, Fettprodukten, Tensiden und verwandten Stoffen. DGF, Frankfurt, Germany. Einen, O. and Roem, A.J., 1997. Dietary protein/energy ratios for
Atlantic salmon in relation to fish size: growth, feed utilization and slaughter quality. Aquaculture Nutrition 3: 115-126.
European Commission (EC), 2009. Commission Regulation (EC) No 710/2009 of 5 August 2009 amending Regulation (EC) No 889/2008 laying down detailed rules for the implementation of Council Regulation (EC) No 834/2007, as regards laying down detailed rules on organic aquaculture animal and seaweed production. Official Journal of the European Union L 204: 15-34.
Finke, M.D., 2013. Complete ingredients of four species of feeder insects. Zoo Biology 32: 27-36.
Food and Agriculture Organisation (FAO), 2016. Fisheries department, fishery information, data and statistics unit. FISHSTAT J Version 2.1.0, Database Aquaculture Production 1950-2014. FAO, Rome, Italy.
Fréon, P., Sueiro, J.C., Iriarte, F., Evar, O.F.M., Landa, Y., Mittaine, J.-F. and Bouchon, M., 2014. Harvesting for food versus feed: a review of Peruvian fisheries in a global context. Reviews in Fish Biology and Fisheries 24: 381-398.
Gasco, L., Stas, M., Schiavone, A., Rotolo, L., De Marco, M., Dabbou, S., Renna, M., Malfatto, V., Lussiana, C., Katz, H., Zoccarato, I. and Gai, F., 2015. Use of black soldier fly (Hermetia illucens) meal in rainbow trout (Oncorhynchus mykiss) feeds. In: Abstracts of the Aquaculture Europe Meeting 2015, Rotterdam, the Netherlands. Available at: http://tinyurl.com/kew73tm.
Hale, O.M., 1973. Dried Hermetia illucens larvae (Stratiomyidae) as a feed additive for poultry. Journal of the Georgia Entomological Society 8: 16-20.
Hardy, R.W., 2010. Utilization of plant proteins in fish diets: effects of global demand and supplies of fishmeal. Aquaculture Research 41: 770-776.
Hem, S., Toure, S., Sagbla, C. and Legendre, M., 2008. Bioconversion of palm kernel meal for aquaculture: experiences from the forest region (Republic of Guinea). African Journal of Biotechnology 7: 1192-1198.
Henry, M., Gasco, L., Piccolo, G. and Fountoulaki, E., 2015. Review on the use of insects in the diet of farmed fish: past and future. Animal Feed Science and Technology 203: 1-22.
Koussoroplis, A.-M., Lemarchand, C., Bec, A., Desvilletes, C., Amblard, C., Fournier, C., Berny, P. and Bourdier, G., 2008. From aquatic to terrestrial food webs: decrease of the docosahexaenoic acid/linoleic acid ratio. Lipids 43: 461-466.
Kroeckel, S., Harjes, A.-G.E., Roth, I., Katz, H., Wuertz, S., Susenbeth, A. and Schulz, C., 2012. When a turbot catches a fly: evaluation of a pre-pupae-meal of the Black Soldier Fly (Hermetia illucens) as fishmeal substitute – Growth performance and chitin degradation in juvenile turbot (Psetta maxima). Aquaculture 364-365: 345-352. Leiber, F., Gelencsér, T., Stamer, A., Amsler, Z., Wohlfahrt, J., Früh, B. and Maurer, V., 2017. Insect and legume-based protein sources to replace soybean cake in an organic broiler diet: effects on growth performance and physical meat quality. Renewable Agriculture and Food Systems 32: 21-27.
Lock, E.J., Arsiwalla, T. and Waagbø, R., 2015. Insect larvae meal as an alternative source of nutrients in the diet of Atlantic salmon (Salmo salar) postsmolt. Aquaculture Nutrition 22: 1202-1213. Lovell, R.T., Lafleur, J.R. and Hoskins, F.H., 1968. Nutritional value of
freshwater crayfish waste meal. Journal of Agricultural and Food Chemistry 16: 204-207.
Makkar, H.P.S., Tran, G., Heuzé, V. and Ankers, P., 2014. State-of-the-art on use of insects as animal feed. Animal Feed Science and Technology 197: 1-33.
Maurer, V., Holinger, M., Amsler, Z., Früh, B., Wohlfahrt, J., Stamer, A. and Leiber, F., 2016. Replacement of soybean cake by Hermetia illucens meal in layer hens. Journal of Insects as Food and Feed 2: 83-90.
National Research Council (NRC), 2011. Nutrient requirements of fish and shrimp. NRC, National Academies Press, Washington, DC, USA.
Naturland, 2014. Naturland Richtlinien für die ökologische Aquakultur. Naturland, Gräfelfing, Germany. Available at: http://tinyurl.com/ ko933kg.
Naylor, R.L., Hardy, R.W., Bureau, D.P., Chiu, A., Elliott, M., Farrell, A.P., Forster, I., Gatlin, D.M., Goldburg, R.J., Hua, K. and Nichols, P.D., 2009. Feeding aquaculture in an era of finite resources. Proceedings of the National Academy of Sciences of the USA 106: 15103-15110.
Newton, G.L., Booram, C.V., Barker, R.W. and Hale, O.M., 1977. Dried
Hermetia illucens larvae meal as a supplement for swine. Journal of Animal Science 44: 395-400.
Olsen, R.L. and Hasan, M.R., 2012. A limited supply of fishmeal: impact on future increases in global aquaculture production. Trends in Food Science and Technology 27: 120-128.
Sakai, M., 1999. Current research status of fish immunostimulants. Aquaculture 172: 63-92.
Sánchez-Muros, M.-J., Barroso, F.G., Manzano-Agugliaro, F., 2014. Insect meal as renewable source of food for animal feeding: a review. Journal of Cleaner Production 65: 16-27.
Schader, C., Muller, A., El-Hage Scialabba, N., Hecht, J., Isensee, A., Erb, K.H., Smith, P., Makkar, H.P.S., Klocke, P., Leiber, F., Schwegler, P., Stolze M. and Niggli, U., 2015. Impacts of feeding less food-competing feedstuffs to livestock on global food system sustainability. Journal of the Royal Society Interface 12(113). Sealey, W.M., Gaylord, T.G., Barrows, F.T., Tomberlin, J.K., McGuire,
M.A., Ross, C. and St.-Hilaire, S., 2011. Sensory analysis of rainbow trout, Oncorhynchus mykiss, fed enriched soldier fly prepupae,
Hermetia illucens. Journal of the World Aquaculture Society 42: 34-45.
Sheppard, D.C., Newton, G.L., Thompson, S.A. and Savage, S., 1994. A value added manure management system using the black soldier fly. Bioresource Technology 50: 275-279.
Sinha, A.K., Kumar, V., Makkar, H.P.S., De Boeck, G. and Becker, K., 2011. Non-starch polysaccharides and their role in fish nutrition: a review. Food Chemistry 127: 1409-1426.
Soil Association, 2016. Soil Association organic aquaculture standards, version 1.1. Soil Association, Bristol, United Kingdom. Available at: http://tinyurl.com/krvl6g6.
Sørensen, M., 2012. A review of the effects of ingredient composition and processing conditions on the physical qualities of extruded high-energy fish feed as measured by prevailing methods. Aquaculture Nutrition 18: 233-248.
St.-Hilaire, S., Sheppard, C., Tomberlin, J.K., Irving, S., Newton, L., McGuire, M.A., Mosley, E.E., Hardy, R.W. and Sealey, W., 2007. Fly prepupae as a feedstuff for rainbow trout, Oncorhynchus mykiss. Journal of the World Aquaculture Society 38: 59-67.
Stadtlander, T. and Gerber, B., 2014. Nachhaltige Aquakultur – Kleine aber feine Aquakultur in der Schweiz. Aqua und Gas 5: 55-60. Steffens, W., 1981. Protein utilization by rainbow trout (Salmo
gairdneri) and carp (Cyprinus carpio): a brief review. Aquaculture 23: 337-345.
Tacon, A.G.J. and Metian, M., 2008. Global overview on the use of fish meal and fish oil in industrially compounded aquafeeds: trends and future prospects. Aquaculture 285: 146-158.
Tocher, D.R., 2010. Fatty acid requirements in ontogeny of marine and freshwater fish. Aquaculture Research 41: 717-732.
Ushakova, N.A., Brodskii, E.S., Kovalenko, A.A., Bastrakov, A.I., Kozlova, A.A. and Pavlov, D.S., 2016. Characteristics of lipid fractions of larvae of the black soldier fly Hermetia illucens. Doklady Biochemistry and Biophysics 468: 209-212.
Verband Deutscher Landwirtschaftlicher Untersuchungs- und Forschungsanstalten (VDLUFA), 2017. Band III – Die chemische Untersuchung von Futtermitteln. VDLUFA, Speyer, Germany.
Webster, C.D., Rawles, S.D., Koch, J.F., Thompson, J.R., Kobayashi, Y., Gannam, A.L., Twibell, R.G. and Hyde, N.M., 2015. Bio-Ag reutilization of distiller’s dried grains with solubles (DDGS) as a substrate for black soldier fly larvae, Hermetia illucens, along with poultry by-product meal and soybean meal, as total replacement of fishmeal in diets for Nile tilapia, Oreochromis niloticus. Aquaculture Nutrition 22: 976-988.