The characteristics of successful benchmarking implementation : guidelines for a national strategy for promoting benchmarking
144
0
0
Full text
(2) The Characteristics of Successful Benchmarking Implementation Guidelines for a national strategy for promoting benchmarking. A thesis presented in partial fulfilment of the requirements for the degree in Master of Philosophy in Science and Advanced Technology at Massey University, Manawatu, New Zealand. Ahmed Abbas 2014.
(3) ii.
(4) Abstract. The MPhil research project presented in this thesis forms the first part of an intended PhD research project. The purpose of the PhD will be to develop a framework to increase the uptake of benchmarking on a national level whilst the aim of the MPhil is to examine the state of benchmarking globally. More specifically, the study objective is to measure and understand the perceived effectiveness, awareness, current and future uptake of benchmarking. The study also explores best practice benchmarking characteristics such as duration of the projects, motivations of benchmarking projects and main benefits of benchmarking. An on-line questionnaire was used to collect data. The questionnaire was translated into five languages and promoted mainly by the Global Benchmarking Network, (GBN) a network of benchmarking centres representing 21 countries. The data was then analysed using SPSS statistical package. The questionnaire consists of seven sections: (1) Organisation’s profile, (2) Use of improvement technique, (3) General questions on benchmarking, (4) Best practice benchmarking projects planning phase, (5) Best practice benchmarking projects research and analysis phase, (6) Best practice benchmarking projects implementation phase, and finally (7) Best practice benchmarking projects evaluation phase. The analysis suggests that informal and performance benchmarking is being used by a majority of organisations while best practice benchmarking is lagging behind them. Benchmarking awareness, effectiveness and future uptake compares favourably with other popular improvement techniques.. iii.
(5) Table of Content. Abstract ....................................................................................................................... iii Table of Content .......................................................................................................... iv List of Figures .............................................................................................................. ix Chapter 1: Introduction to the Research........................................................................ 1 1.1. Introduction to the chapter .............................................................................. 1. 1.2. Background to the research ............................................................................ 1. 1.3. Aim and objectives of the research ................................................................. 2. 1.4. Scope of the research ..................................................................................... 3. 1.5. Importance of the research and outcomes ...................................................... 3. 1.6. Outline of the thesis ........................................................................................ 4. Chapter 2: Literature Review......................................................................................... 5 2.1. Introduction ..................................................................................................... 5. 2.2. The raise of benchmarking.............................................................................. 5. 2.3. Description of benchmarking........................................................................... 6. 2.4. Types and Pitfalls of Benchmarking ................................................................ 8. 2.5. Best Practice Benchmarking ......................................................................... 11. 2.6. Large Scale Benchmarking Initiatives ........................................................... 12. Chapter 3: Research Methodology .............................................................................. 15 3.1. Introduction ................................................................................................... 15. 3.2. Research Questions ..................................................................................... 15. 3.3. Data Sources ................................................................................................ 15. 3.4. Questionnaire Development.......................................................................... 17. 3.5. Questionnaire Structure and Questions ........................................................ 18. 3.6. Validity and Reliability ................................................................................... 19. 3.7. Questionnaire Delivery Methods and Distribution Channels .......................... 20. Chapter 4: Results ...................................................................................................... 21 4.1. Introduction ................................................................................................... 21. 4.2. Survey Results.............................................................................................. 21. 4.3. Survey Results Analysis ............................................................................... 21. 4.3.1. iv. Questionnaire Section 1 Organisation Profile ......................................... 21. 4.3.1.1. Question 1.1 Responses Distribution. ............................................. 21. 4.3.1.2. Question 1.2. What is your organisation’s major business activity? 24. 4.3.1.3. Question 1.3. Within which sector does your organisation operate? 25.
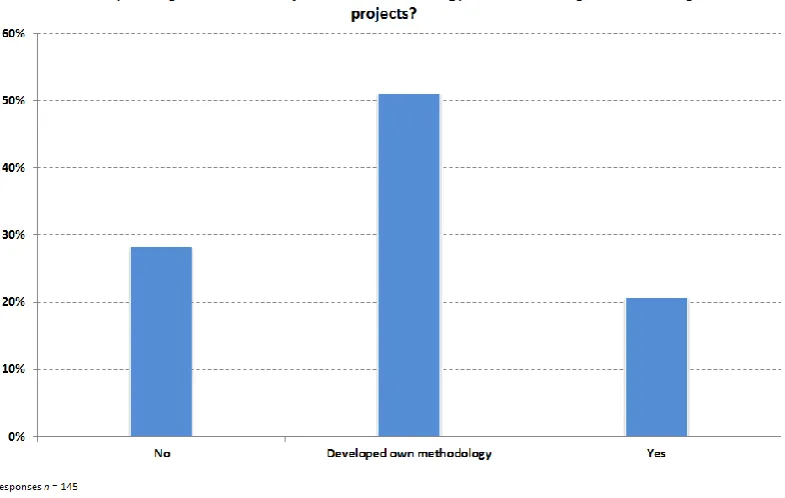
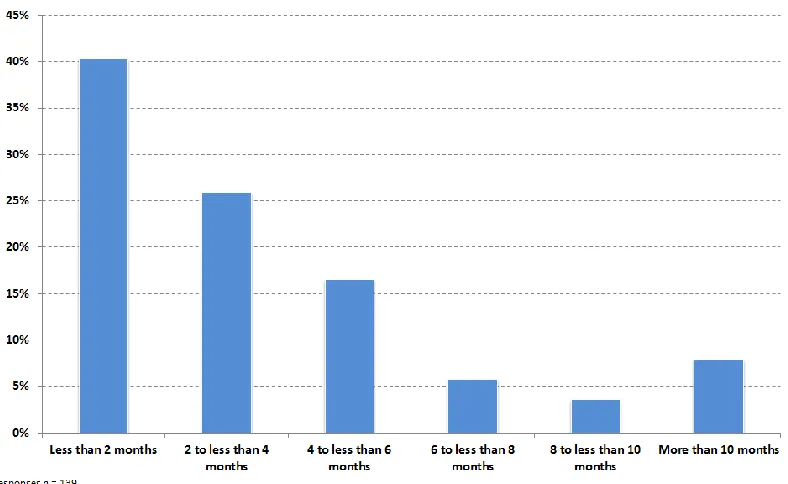
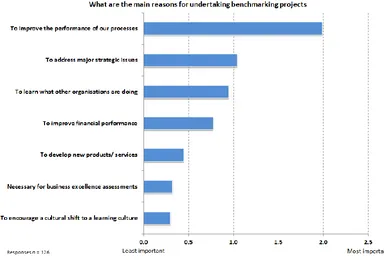
(6) 4.3.1.4. Question 1.4. For how many years has your organisation been. operating?26 4.3.2. Questionnaire section 2. Use of Improvement Techniques .................... 27. 4.3.2.1. Question 2.1. Improvement techniques implemented in your. organisation. ................................................................................................... 27 4.3.2.2. Question 2.2. What are the main reasons for not using performance. benchmarking or best practice benchmarking within your organisation? ......... 32 4.3.3. Questionnaire Section 3 General Questions on Benchmarking .............. 33. 4.3.3.1. Question. 3.1.. Benchmarking. Training,. Data. Collection. and. Dissemination of Results. ................................................................................ 33 4.3.3.2. Question 3.2. For each of the following performance areas, does your. organisation collect benchmarks (performance comparison data on other companies)? ................................................................................................... 35 4.3.3.3. Question 3.3. Which of the following services in benchmarking, if. supplied by a third party (an external organisation), would your organisation potentially use? ............................................................................................... 40 4.3.3.4. Question 3.4 Does your organisation currently use benchmarking. services provided by a third party? .................................................................. 41 4.3.3.5. Question 3.5. If there was a national or regional benchmarking award. to encourage organisations to undertake benchmarking projects, would your organisation be interested in applying or finding out more information about it? 42 4.3.4. Survey Section 4: Best Practice Benchmarking Projects - Planning....... 43. 4.3.4.1. Question 4.1. How many benchmarking projects do you conduct per. year (typically)? ............................................................................................... 43 4.3.4.2. Question 4.2. What is the size of a typical benchmarking team within. your organisation?........................................................................................... 44 4.3.4.3. Question 4.3. Does your organisation use a particular methodology for. undertaking benchmarking projects? ............................................................... 45 4.3.4.4. Question 4.4. How long does a benchmarking project normally take? 46. 4.3.4.5. Question 4.5. What are the main reasons for undertaking. benchmarking projects? .................................................................................. 47. v.
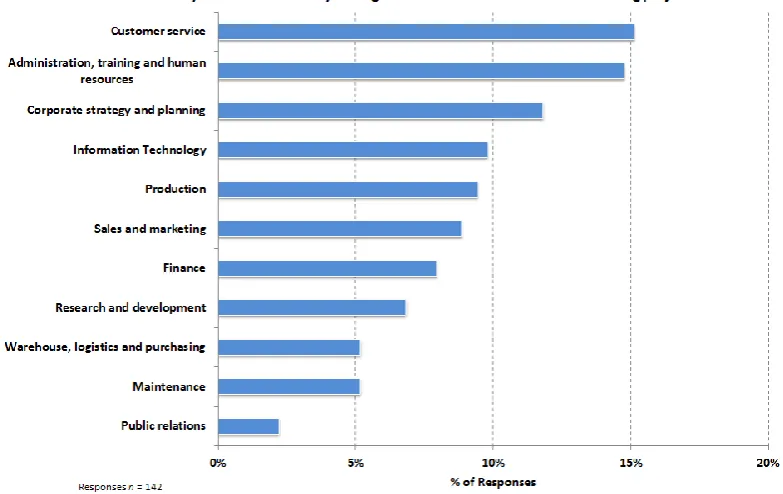
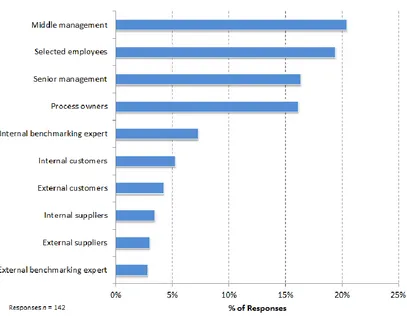
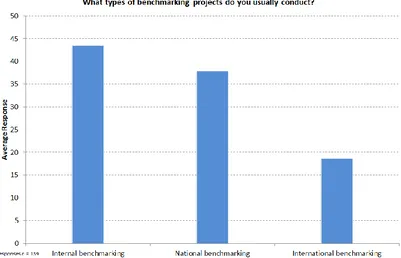
(7) 4.3.4.6. Question 4.6. In the last three years which areas of your organisation. have conducted benchmarking projects?......................................................... 48 4.3.4.7. Question 4.7. Our benchmarking project teams usually consist of. people from the following areas. ...................................................................... 49 4.3.4.8. Question 4.8. What types of benchmarking projects do you usually. conduct? 50 4.3.4.9 4.3.5. Question 4.9. When planning a benchmarking project. ................... 51. Section 5: Best Practice Benchmarking Projects - Research and Analysis 54. 4.3.5.1. Question 5.1. Which of the following methods does your organisation. use to collect benchmarking data and best practice information? .................... 54 4.3.6. Section 6: Best Practice Benchmarking Projects - Implementation ........ 55. 4.3.6.1. Question 6.1. How long does the implementation phase typically take? 55. 4.3.6.2. Question 6.2. What percentage of benchmarking projects result in. implementation? .............................................................................................. 56 4.3.7. Section 7: Evaluation ............................................................................. 57. 4.3.7.1. Question 7.1 At the end of a benchmarking project, do you measure. the improvements that have occurred? ............................................................ 57 4.3.7.2. Question 7.2. The outcomes (best practices and/or results achieved). from benchmarking projects are typically communicated by: ........................... 60 4.3.7.3. Question 7.3. The main benefits of benchmarking projects have been: 61. 4.3.7.4. Question 7.4. On average, what is the financial return (US$) from a. typical benchmarking project after one year of implementation? ...................... 62 4.3.7.5. Question 7.5. Approximately, what percentage of time is spent by your. organisation on each phase of the benchmarking process out of total time spent? 63 4.3.7.6. Question 7.6. According to your experience, how do the following. factors contribute to the success of a benchmarking project? .......................... 64 4.3.8. Cross Tabulation Results ....................................................................... 66. 4.3.8.1. Typical benchmarking team size in major effectiveness benefit. organisations ................................................................................................... 66. vi.
(8) 4.3.8.2. Frequency of providing best practice benchmarking training to the. employees in each sector ................................................................................ 67 4.3.8.3. Benchmarking methodology used in each sector ............................ 67. 4.3.8.4. Future use of benchmarking for each organisation size .................. 68. 4.3.8.5. Types of best practice benchmarking projects in each organisation. size. 69. 4.3.8.6. Employee-related data collection in each sector ............................. 70. 4.3.8.7. Customer-related data collection in each sector ............................. 71. 4.3.8.8. Financial-related data collection in each sector .............................. 72. 4.3.8.9. Process-related data collection in each sector ................................ 73. 4.3.8.10. Product-related data collection in each sector ................................ 74. 4.3.8.11. Main reasons for not using benchmarking in large organisations .... 75. 4.3.8.12. Main reasons for not using benchmarking in medium organisations 76. 4.3.8.13. Main reasons for not using benchmarking in small organisations ... 77. 4.3.8.14. Main reasons for not using benchmarking in micro organisations ... 78. 4.3.8.15. Main reasons for using benchmarking in each sector. .................... 79. Chapter 5: Discussion and Conclusion ....................................................................... 81 5.1. Introduction to the Chapter ........................................................................... 81. 5.2. Awareness and Uptake of Benchmarking ..................................................... 81. 5.3. Effectiveness of Benchmarking ..................................................................... 82. 5.4. Future Use of Benchmarking ........................................................................ 83. 5.5. Benchmarking and the Other Performance Improvement Tools .................... 84. 5.6. Best Practice Benchmarking ......................................................................... 84. 5.7. Conclusion .................................................................................................... 87. 5.8. Research Limitations .................................................................................... 88. 5.9. Future research ............................................................................................ 89. References ................................................................................................................. 90 Bibliography ................................................................................................................ 95 Appendix-I: Benchmarking Definitions ........................................................................ 99 Appendix-II: Global Benchmarking Network (GBN) members ................................... 100 Appendix-III: Questionnaire ...................................................................................... 103. vii.
(9) viii.
(10) List of Figures Figure 1. Research Plan ..................................................................................... 3 Figure 2. World responses distribution .............................................................. 22 Figure 3. Responses distribution by country ..................................................... 23 Figure 4. Responses distribution by organisation size ...................................... 24 Figure 5. Response distribution by business activity ......................................... 25 Figure 6. Responses distribution by sector ....................................................... 26 Figure 7. Number of years in operation ............................................................. 27 Figure 8. Awareness of business improvement techniques .............................. 28 Figure 9. Current use of business improvement techniques ............................. 29 Figure 10. Effectiveness of business improvement techniques ........................ 30 Figure 11. Future use of improvement techniques ............................................ 31 Figure 12. Reasons for not using benchmarking or best practice benchmarking .......................................................................................................................... 32 Figure 13. Benchmarking training for employees .............................................. 33 Figure 14. Collection and use of benchmarking data ........................................ 34 Figure 15. Disseminations of best practices ..................................................... 35 Figure 16. Collection of benchmarking data in employee-related area ............. 36 Figure 17. Collection of benchmarking data in financial-related areas .............. 37 Figure 18. Collection of benchmarking data in process-related areas .............. 38 Figure 19. Collection of benchmarking data in product or services related areas .......................................................................................................................... 39 Figure 20. Collection of benchmarking data in customer-related areas ............ 39 Figure 21. Most important services supplied by third party ............................... 41 Figure 22. Current use of benchmarking service by third party provider ........... 42 Figure 23. Level of interest in a benchmarking award ....................................... 42 Figure 24. Number of benchmarking project per year ....................................... 44 Figure 25. Size of typical benchmarking team .................................................. 45 Figure 26. Methodology used in benchmarking projects ................................... 46 Figure 27. Duration of benchmarking projects .................................................. 47 Figure 28. Main reasons for undertaking benchmarking ................................... 48 Figure 29. Benchmarking in organisation areas ................................................ 49 Figure 30. Benchmarking team structure .......................................................... 50. ix.
(11) Figure 31. Types of benchmarking projects ...................................................... 51 Figure 32. Project brief development ................................................................ 52 Figure 33. Calculating the financial aspects of the project ................................ 53 Figure 34. Adherence to code of conduct ......................................................... 54 Figure 35. Most popular data collection methods ............................................. 55 Figure 36. Implementation phase duration........................................................ 56 Figure 37. Percentage of benchmarking projects ending with implementation . 57 Figure 38. Evaluating improvements ................................................................ 58 Figure 39. Financial analysis at the end of benchmarking projects ................... 59 Figure 40. Evaluating benchmarking project process ....................................... 60 Figure 41. Methods of project outcomes communication .................................. 61 Figure 42. Main benefits of benchmarking projects .......................................... 62 Figure 43. Financial return of benchmarking projects ....................................... 63 Figure 44. Time allocation for each phase of benchmarking project ................. 64 Figure 45. Most important requirements for a successful benchmarking project .......................................................................................................................... 65 Figure 46. Typical benchmarking team size and benchmarking project benefit 66 Figure 47. Frequency of providing best practice training in each sector ........... 67 Figure 48. Use of benchmarking methodology in each organisation size ......... 68 Figure 49. Future use of best practice benchmarking in different organisation sizes.................................................................................................................. 69 Figure 50. Types of implemented benchmarking projects in different organisation sizes.................................................................................................................. 70 Figure 51. Percentage of collecting employee-related benchmarks in each sector .......................................................................................................................... 71 Figure 52.Percentage of collecting customer-related benchmarks in each sector .......................................................................................................................... 72 Figure 53. Percentage of collecting financial-related benchmarks in each sector .......................................................................................................................... 73 Figure 54. Percentage of collecting process-related benchmarks in each sector .......................................................................................................................... 74 Figure 55. Percentage of collecting product-related benchmarks in each sector .......................................................................................................................... 75 Figure 56. Main reasons for not using benchmarking in large organisations .... 76 x.
(12) Figure 57. Main reasons for not using benchmarking in medium organisations 77 Figure 58. Main reasons for not using benchmarking in small organisations .... 78 Figure 59. Main reasons for not using benchmarking in micro organisations ... 79 Figure 60. Main reasons for undertaking benchmarking projects in each sector .......................................................................................................................... 80. xi.
(13) xii.
(14) Global survey on business improvement and benchmarking. Chapter 1: Introduction to the Research. 1.1 Introduction to the chapter. This chapter explains the research background, aim and objectives, scope, and outline of the thesis.. 1.2 Background to the research. Benchmarking has become an area of interest in the past three decades for quality developers. It has been recognised as one of the tools for improving performance and increasing productivity. Any organisation wanting to adopt best practices for their processes or strategies can use benchmarking. To date, benchmarking exercises have been initiated by organisations that have identified the importance and capability of benchmarking in improving their performance. Other organisations that are unaware of benchmarking and its benefits are either not implementing benchmarking correctly or are far from starting any benchmarking project. There are national programmes sponsored by government departments and non-profit organisations to implement different programmes to enhance national productivity, innovation and competitiveness. Benchmarking, as a powerful learning tool, can play an important role in boosting the results of these programmes. Therefore, this research mainly aims to develop a national strategy or a framework to promote the use of benchmarking on a national level.. In spite of the increasing number of published works in benchmarking, the majority of the publications are a result of a practitioners’ efforts, which call for a need for a theoretical development in many areas of benchmarking (Dattakumar & Jagadeesh, 2003; Yasin, 2002); in particular, in developing a strategy to promote benchmarking on a national level. Therefore, research in this field is. 1.
(15) Global survey on business improvement and benchmarking. significant, in terms of bridging one of the gaps between theoretical work and implementation. A combination of qualitative and quantitative methods will be used to achieve the aim of this research, by using a questionnaire and interviews targeting the custodians of benchmarking programmes and questionnaires targeting organisations that participate in benchmarking programmes. Supporting statistical data and records as secondary data are presented in the methodology section. Upon completion of this research it is expected that this research will contribute to both academic and practitioner communities.. 1.3 Aim and objectives of the research. The main aim of the research is to develop a set of guidelines to help organisations that are responsible for national benchmarking programmes to increase the use of benchmarking within their country. In order to achieve this aim of the research, it is required that the following specific objectives are met: 1.. Evaluate the current status of benchmarking in terms of awareness, use, perception, effectiveness of benchmarking, and identify possible change in benchmarking uptake.. 2.. Identify the characteristics of current best practice benchmarking deployment.. 3.. To identify the benefits of developing a national benchmarking strategy. Since benchmarking is a learning tool, a national programme will have an impact on other programmes such as the Business Excellence Programme, and identifying the benefit/effect will help in integrating the national strategy with other national programmes.. 4.. To identify the key components of a national benchmarking strategy. A national strategy could be the number of initiative designed for different organisations; for example for the public sector, or large organisations or SMEs. It could be in form of technical assistance such as offering a benchmarking database, training programme or other types of assistance. Therefore, it is essential to identify the required components for a successful strategy.. 2.
(16) Global survey on business improvement and benchmarking. 5.. To identify best practices in the design and deployment of a national benchmarking strategy. It is important to take into consideration the different factors that influence the design and deployment of the strategy during design and deployment; this is to ensure the maximum efficiency and effectiveness. Due to the large scope of this research project, which is beyond the M.Phil. timeframe, it is unlikely all the objectives will be achieved. Therefore, the M.Phil research will cover the first four objectives only (Figure 1).. Evaluate the awareness and use of benchmarki ng. Identify possible change in benchmarki ng uptake. Evaluate perceptions of benchmarki ng effectivenes s. Identify the characteristi cs of current best practice benchmarki ng deployment. Identify the benefits of developing a national benchmarki ng strategy.. M.Phil. Identify the components of a national benchmarki ng strategy. Design and deployment of a national benchmarki ng strategy. Ph.D.. Figure 1. Research Plan. 1.4 Scope of the research. The scope of the research is described as follows: a. This research focuses on identifying the current status of benchmarking and the characteristics of a successful benchmarking. b. This research is intended for researchers and academics who are interested in quality and performance improvement, practitioners and consultants who advise and help organisations to improve their performance, and national custodian responsible for such programmes.. 1.5 Importance of the research and outcomes. For this research project, there are three key motivations:. 3.
(17) Global survey on business improvement and benchmarking. •. Lack of rigorous research on the international use and benefits of benchmarking and its role in stimulating economic development.. •. Lack of the theoretical development of promotion strategy of benchmarking within a nation.. •. The need for a theoretical study that combines the different types of benchmarking in one model or framework.. There are at least three potential outcomes for this research. First is the contribution to the research community by the theoretical examination of the practitioners’ work. Second, for practitioners in general and benchmarking clubs in particular, the results of the research will help them to understand the process of promoting benchmarking. Third, the results could be implemented, at least in New Zealand.. 1.6 Outline of the thesis. The following is the preliminary chapter outline of the thesis and the key content of each chapter. Chapter 1: Introduction, aims, objectives and scope. In this chapter, background of the research area will be presented. -. Chapter 2: Literature review of the previous work. In this chapter, a review of related literature will be presented to build a theoretical framework for the research.. -. Chapter 3: Research methodology. In this chapter, a description of the research method will be presented and why the selected methodology was found to be the most suitable, beside validity and reliability of the used instruments.. -. Chapter 4: Data analysis and results. In this chapter, analysis of gathered data and its relationship with the theory will presented.. -. Chapter 5: Discussion and Conclusions. In this chapter, discussion of the findings will be presented, along with author's opinions and areas of further research.. 4.
(18) Global survey on business improvement and benchmarking. Chapter 2: Literature Review 2.1 Introduction. This chapter defines benchmarking in terms of its modern origin, basic concept, the establishment of best practice benchmarking and nation-wide benchmarking initiatives.. 2.2 The raise of benchmarking. During the 20th century, organisations around the world adopted different tools, techniques and strategies in order to compete and survive. At present, the competition is greater than ever, primarily because of the accelerated growth in information technology, logistics and free trade agreements. For this reason, it is imperative that benchmarking becomes a fundamental part of the national quality culture of any country that intends to compete and survive in the globalisation era. The notions of benchmarking and best practice are not new. In 1911, Frederick Taylor highlighted the need to identify the maximum possible performance for each activity (Walgenbach & Hegele, 2001). However, the concept of benchmarking as currently understood is relatively new. The first systematic benchmarking exercise was conducted by Xerox in the late 1970s when it sent a team to learn good practices from Fuji-Xerox in Japan (Bogan & English, 1994; Boxwell, 1994; Mann, 2006). The reason for such trip was the belief that one organisation can learn from another, even from its competitors. The next stage of benchmarking development occurred in the late 1980s when the concept of “learning from outside the industry” was introduced through the sharing of information to another organisation from a different sector (Yasin, 2002). Further, in the 1990s, the focus of benchmarking expanded through the benchmarking of organisational strategies and acquiring knowledge globally. Between 1980s and 1990s, benchmarking became a popular tool among organisations. In the early 1990s, around 65% of the Fortune 1000 organisations chose benchmarking as the preferred management tool to gain competitive. 5.
(19) Global survey on business improvement and benchmarking. advantage (Hong, Hong, Roh, & Park, 2012; and Park, 2012). In France, 50% of 1000 French companies studied indicated that they had implemented benchmarking; furthermore, 80% of organisations considered benchmarking as an effective tool (Maire, Bronet, & Pillet, 2005). A study in the UK revealed that around 45% of 559 organisations studied were using benchmarking. The study also revealed other issues with benchmarking in the UK; for example, benchmarking implementation was found to be low in small organisations and the larger the organisation was, the more likely it would be using benchmarking. Furthermore, the benchmarking uptake was low in retailing and services and high in utilities and health (Hinton, Francis, & Holloway, 2000).. 2.3 Description of benchmarking The term “benchmarking” refers to a type of management approach characterised by implementing the “best practices found in similar industries or even in different industries in order to improve the performance of an organization” (Joo, Nixon, & Stoeberl, 2011). There are many other definitions of benchmarking, developed by benchmarking experts (see Appendix I), but all have roots in the definition of Robert Camp definition. Benchmarking, according to Camp (1989), who is regarded as the founder of best practice benchmarking, is the “search for industry best practices that will lead to superior performance”. This is the definition that the paper will use for this particular study.. According to Joo et al., (2011), benchmarking has at least four main goals, and these are the following: a. Identify key performance measures for each function of a business operation; b. Measure one’s own internal performance levels as well as those of the leading competitors; c. Compare performance levels and identify areas of comparative advantages and disadvantages; and d. Implement programmes to close a performance gap between internal operations and the leading competitors. 6.
(20) Global survey on business improvement and benchmarking. Benchmarking is a very popular tool in business. In a global study carried out by Bain & Company [famous consultancy firm], about the usage trends of 25 management tools worldwide, benchmarking came out the fourth most popular tool in the world and was placed as second most used tool in North America, Europe, the Middle East and Africa (Rigby & Bilodeau, 2013). This particular study also found out that in the past 13 years, the benchmarking approach was always among the top five most used management tools. Since this tool is the only approach that offers learning from the best using a systematic approach, benchmarking is recognised by business organisations as effective in improving business performance (Jarrar & Zairi, 2001). The application of benchmarking extends across different industries, these include the green operations of the automotive industry (Nunes & Bennett, 2010), the service quality in the utility industry (Chau, 2009), and even the sustainable processes in the pharmaceutical industry (Schneider, Wilson, & Rosenbeck, 2010). There are at least three reasons why companies make use of the benchmarking approach. First, it enables the company to see where it stands among the competition. As Min and Galle (1996) have mentioned, benchmarking is used to analyse the company’s own strengths and weaknesses and at the same time the comparative advantage of the competitors in the industry are likewise evaluated. The results of the analysis are then used by the company to develop its own strategic plan to achieve a far better position than its rivals. Second, benchmarking is recognised as effective in improving the performance of the company. A well-exercised benchmarking programme can bring major changes to the organisation at different levels, from optimising tasks and processes to enhancing the organisational strategy. Furthermore, benchmarking is a proven tool for attaining competitive and comparative positions by identifying the critical process and upgrading it to a world-class level through continuous search for best practice. It also has other potential advantages such as the efficient utilisation of resources, identifying effective goals and objectives, and setting measures of productivity. Finally, benchmarking is also strongly correlated with business excellence models; for example, out of 1000 points of Malcolm Baldrige National Quality Award (MBNQA) 550 points are influenced by benchmarking. In terms of 7.
(21) Global survey on business improvement and benchmarking. categories of assessment criteria, benchmarking affects all the categories (Spendolini, 1992), and such a heavy influence accelerated the global use of benchmarking because the MBNQA and similar models such as the EFQM are used as a foundation for excellence awards for more than 80 awards around the world including New Zealand and Australia (BPIR, 2013). However, despite being one of the best tools to gain a national competitive position in the global market through acquiring, sharing and applying knowledge, there is still a lack of studies on the effectiveness of benchmarking in the field of national strategies or programmes. A research gap exists in the aspect of promoting the different types of benchmarking and exploiting its potential for increasing national competitiveness.. 2.4 Types and Pitfalls of Benchmarking. Attempts to classify benchmarking into different categories have been made by various scholars and practitioners, but until now, there has been no single classification system of benchmarking. The absence of such a system will result in confusion over which type to select. It would be difficult, especially for inexperienced organisations, to identify which benchmarking type will give the maximum results at the lowest cost and effort. The succeeding sections present at least three ways in which benchmarking has been classified. Each scholar provides three categories for benchmarking. According to Codling (1995) there are three types of benchmarking: internal, external, and best practices. The definition of each is as follows: a. Internal: defined as benchmarking with partner within the same organisation; b. External: defined as benchmarking with partner from different organisation; and c. Best Practices: defined as benchmarking with the best-in-class, the main difficulty associated with this type is the identification of the best-in-class partner. The availability of best practices databases help organisations to overcome this problem.. 8.
(22) Global survey on business improvement and benchmarking. d. Alternatively, Bogan & English (1994) classified benchmarking into three groups. These are performance, process, and strategic. The description is as follows: e. Performance: is benchmarking the performance measures and product characteristics such as reliability, durability and cost. f. Process: the main focus of process benchmarking is benchmarking specific work processes such as recruitment process and shipping process. g. Strategic: is benchmarking the strategic direction of an organisation in comparison with a competitor. The third classification comes from Boxwell (1994) who subdivided benchmarking into competitive, cooperative or collaborative. Below are the descriptions for each category. •. Competitive: defined as benchmarking with competitor. This type of benchmarking is the most difficult type to conduct because competitors usually will not release any information for the benefit of a competitor.. •. Cooperative: a widely practised method of benchmarking due to the confidentiality of information both parties can keep. In cooperative benchmarking, both organisations can be from different sectors.. •. Collaborative: a group of organisations share information about a specific task. With the availability of best practices exchange databases this is the most popular type, and it is also used as a tool to raise the national competitiveness of an industry by implementing bestin-class practices.. The preceding sections have shown that each author classified benchmarking based on a certain viewpoint. Presented above are the existing three main groups of benchmarking. The first one classifies benchmarking based on the type of referenced partner (internal, external, best practice/global). The second group uses categories based on the level of implementation (performance, process, strategy). Lastly, the third group is comprised of categories based on the relationship between benchmarking parties (competitive, cooperative and collaborative).. 9.
(23) Global survey on business improvement and benchmarking. Some of these types are complex and in order to implement them, the help of an expert is needed; otherwise the benchmarking exercise will fail to accomplish its objectives. Therefore, clear identification and classification of benchmarking types can improve the quality of decisions taken to select certain benchmarking types. Furthermore, this gap has to be addressed at the development phase of the strategy because organisations are different in terms of benchmarking experience.. Benchmarking as a method is relatively new and it has known pitfalls and drawbacks in terms of concept and implementation. Thus, there is a need for further theoretical studies as well as practical implementation to gauge its outcomes. Yasin (2002) attributes the majority of developments and literatures being provided by practitioners. Therefore the pitfalls of benchmarking must also be considered during the development of the strategy, because the failure of benchmarking at the organisational level will have a negative impact on promoting benchmarking at the national level.. The major pitfalls for benchmarking are: a. Before starting any benchmarking project, organisation should form a working group of experts to make employees well aware of what is to be benchmarked and to solve any problems, as absence of this team may lead to a wrong implementation. b. Similar to other quality initiatives, one of the main barriers of implementation is top management commitment. c. Misconception about benchmarking and focusing on benchmarking as measurement “how much” rather than “how to”. d. Feasibility of conducting benchmarking exercise including cost, resources and involved against the outcomes. e. Identification of best practices can obstruct the benchmarking exercise, in particular where to find best practice, how to make sure that the identified best practice is the “best”. f. Benchmarking is not helpful if used to evaluate fundamentally different customer requirements, even for similar processes For 10.
(24) Global survey on business improvement and benchmarking. example, the cost of serving customers in a first class restaurant is much more than in a fast-food restaurant, and due to the different requirements of customers it is likely that the first class restaurant will not gain significant benefit from a fast-food restaurant.. 2.5 Best Practice Benchmarking. The main idea behind benchmarking is to identify better practices that could be of use if implemented in order to improve the performance. The best practices are normally obtained by comparing a practice or performance of an organisation with another one that is assumed to be performing well. Therefore, benchmarking teams obtain data from the benchmarking ‘partner’ and then use it in identifying changes required for improving the performance of their own organisation. This way, the organisation is able to achieve better practice or performance by identifying best practices and then adapting them.. There are different definitions for best practice benchmarking from different scholars, researchers and practitioners. It is also worth noting that although different scholars have defined benchmarking differently, all the definitions have captured the essential characteristics of best practice benchmarking. All the definitions have captured the most important aspect of benchmarking, which is to examine the processes or practices from the benchmarking partner that can be used to improve the organisation performance. Studies also reveal that most publicised management ‘text books’ on how to conduct benchmarking peaked in the late 1990s (Francis & Holloway, 2007). These include (Camp, 1995; Spendolini, 1992; Watson, 1993; Zairi, 1998), and for the non-profit sector, (Letts, Grossman, & Ryan, 1999). However, such books did establish a broad consensus in terms of what they believed best-practice benchmarking should involve in practice.. Studies also indicate that benchmarking originated in the manufacturing sector, but soon found applications in other sectors. It is also worth noting that benchmarking was first implemented in the private sector and then found its way to the public sector. This is reasonable, bearing in mind that private sectors are 11.
(25) Global survey on business improvement and benchmarking. obviously much derived by competitiveness than public sectors. Consequently, organisations in the private sector were the first to implement benchmarking practices in order to remain competitive. During the early days of best practice benchmarking, it was practiced as inter-firm comparisons. The comparison information was normally obtained by local groups of employers. For instance, Profit Impact of Marketing Strategies (PIMS) has been offering ‘benchmark’ data for member organisations within their own industries since the early 1990s (Merrifield, 1994). The first actual labelling of a performance-enhancing activity as ‘benchmarking’ in the Western industry is attributed to Xerox in 1983 (Jacobson & Hillkirk, 1986). Their portrayal of Xerox as an “American Samurai” reflects the escalation of interest in Japanese management techniques in the 1980s such as Kaizen (continuous performance improvement).. Studies also indicate that benchmarking in the early days was implemented by large organisations that were normally referred to as “blue collar” service organisations; these included engineering maintenance and transport, and laboratory-based activities such as pathology. Also, best practice benchmarking was adopted at a slower rate in ‘white collar’ service organisations such as retail organisations and financial services among others (Francis & Holloway, 2007). The idea behind benchmarking was to improve their services and reduce their costs at the same time (Mathaisel, Cathcart, & Comm, 2004).. 2.6 Large Scale Benchmarking Initiatives. Unfortunately, the literature that directly addresses national initiatives of benchmarking is lacking, which is one of the motivators for this study. Hence, this literature review focuses on lower levels of benchmarking adoption, such as sector-wide or industry programmes.. According to Panwar, Nepal, Jain, and Yadav (2013) researching the implementation of benchmarking concepts in the Indian automobile industry showed that good performance could be achieved rapidly and successfully if Indian auto companies significantly invested their time and efforts in adopting benchmarking. It is also worth noting that several empirical studies have been 12.
(26) Global survey on business improvement and benchmarking. carried out in developed as well as developing nations regarding the implementation of benchmarking concepts in various industrial sectors (Asrofah, Zailani, & Fernando, 2010; Mamata, Atul, & Upadhyay, 2011; Nemec, Merickova, & Ochrana, 2008; Vermeulen, 2003).. The Asrofah et al., (2010) study suggested that governments should intervene and sponsor benchmarking initiatives in order to improve national productivity, and governments could also utilise benchmarking as a tool to monitor and control quality. The study also found a positive link between government. intervention. and. benchmarking. effectiveness.. Therefore,. governments can play an important role in boosting the uptake and effectiveness of benchmarking by providing support to organisations wishing to apply benchmarking.. In Singapore, the government started number of initiatives to help Singapore organisations in undertaking benchmarking projects. For example, in 1993 the Productivity and Standards Board (PSB), in collaboration with FujiXerox, established Fuji-Xerox-PSB Benchmarking Centre. The primary role for the centre was to offer workshops, seminars and consulting services to Singapore business. In 1996, the PSB took the Fuji-Xerox-PSB initiative to the next level and started a new programme; the PSB launched the National Best Practice Programme (NBPP), which aimed to help local organisations to achieve business excellence level through benchmarking against world class performance levels.. The Brah, Ong, and Rao study (2000) on benchmarking in Singapore, which was conducted on Singapore Quality Class (SQC) Certified Organisation, shows that there is a strong positive correlation between effective implementation of benchmarking and training programmes and seminars organised by the NBPP. In addition, the study revealed that 92.3% of respondents who have used benchmarking for more than one year are showing a rising interest in adopting benchmarking management technique; this interest is even higher among SQC companies. Further analysis of organisations that are willing to do benchmarking projects but have not done so, shows that the main reason for not conducting. 13.
(27) Global survey on business improvement and benchmarking. benchmarking projects was lack of awareness and understanding of benchmarking concept. In the UK, recently there was a new benchmarking initiative in construction sector called UK Benchmarking Construction Policy. The main reason behind UK Benchmarking Construction Policy is to address the industry’s perceived problems of high cost, poor performance and client dissatisfaction (Rigby et al., 2013). Although the initiative was primarily data collection and sharing initiative, it was expected that there would be a performance improvement through identifying strengths and weaknesses, and the exchange of information between customers and suppliers. The results of the initiative were excellent: some contractors reported 77% reduction in defects, 15% reduction on housing costs, 40% improved productivity, and 90% average client satisfaction.. 14.
(28) Global survey on business improvement and benchmarking. Chapter 3: Research Methodology 3.1 Introduction. This chapter describes the different stages of research design and methodology used to achieve the research aim and objectives. It starts with research questions data, and then discusses data sources, collection methods, and validity and reliability of research tools.. 3.2 Research Questions. In order to accomplish the stated objectives (Objectives 1 to 4 which shown in section 1.3) there are three research questions: a. To what extent are the organisations using different types of benchmarking compared to other performance improvement techniques? b. What are the difficulties facing organisations that prevent adoption and implementation of benchmarking? c. What are the benefits of implementing benchmarking for organisations? The above-stated research questions are based on an initial literature review and discussions with experts. In order to answer the research questions, a combination of qualitative and quantitative methods were used. Also, there are two data sources for the research, primary and secondary sources.. 3.3 Data Sources. There were three data sources used to accomplish the objectives of this part of the research: 1. Literature review of benchmarking literatures.. 15.
(29) Global survey on business improvement and benchmarking. 2. Survey study for organisations to complete and to be distributed by. benchmarking clubs and national quality organisations. The objective of this questionnaire is to answer the research questions.. 3. In addition to the above, structured interviews with representatives from. benchmarking clubs and benchmarking experts were conducted in order to gain a deeper understanding about benchmarking and national benchmarking strategies in their countries. The data from the interviews will not be shown within this thesis; the analysis and results of this will be carried out in the Ph.D. research. At this stage it was conducted primarily to utilise the face-to-face meeting with benchmarking experts overseas.. The. primary. aim. of. combining. two. research. methodologies. qualitative/quantitative is to minimise the shortcomings of each approach. The quantitative (survey) method was used because it can collect data from large samples. The construction of the survey was done carefully in terms of selecting the scaling method such as Thurstone, Likert and Guttman, questions that were asked and the wording of questions, and ensuring validity and reliability of the survey. Whereas qualitative (Interviews) was used because the quantitative method is more of a summarising than an exploring tool (Trochim, 2006), another tool had to be used to gain deeper answers for both the research questions. The most suitable tool for our sample was found to be interviews, but there was an extra cost associated with such benefits, in terms of funds and time need to conduct the interviews.. The research scope is the national benchmarking clubs and networks around the world. Initially, this was the Global Benchmarking Network (GBN) whose members agreed to participate in the research. The Global Benchmarking Network is an organisation consisting of 28 members from 21 countries (23 members at time of data collection) sharing an interest in promoting benchmarking. The full list of GBN members is listed in Appendix-II. Excluding Japan and France, representatives from all G8 countries are members in the GBN. Within the members there are developed countries such 16.
(30) Global survey on business improvement and benchmarking. as the United States, United Kingdom and Germany, and developing countries such India, Malaysia and United Arab Emirates. Although GBN members constitute 55.6% of the world’s GDP and 33.1% of the world’s population, in addition to the diversity of the group that offers the opportunity to examine the effect of different factors, there are some shortcomings for this selection. For example, Japan, which is a pioneer nation in benchmarking and best practices, is not a GBN member. Also, in some countries English language is not popular, this had an impact on survey distribution and completion rates. Another disadvantage of scope is the geographical location of the participants, which makes data gathering more difficult in terms of cost and time needed for follow-up. To overcome these disadvantages, a web-based smart survey was developed in order to increase the response rate because there is no need for the respondents to fill a form and submit it by mail, so relatively, answering the survey will not cost respondents anything. For the follow-up interview, GBN members could be interviewed during the annual GBN meeting. The author has obtained the permission to attend a meeting which was held in Dubai on 3rd and 4th of December 2007 and has been attending their annual meetings since then.. 3.4 Questionnaire Development. In order to collect as much data as possible, the research tool used in this research was a questionnaire. The first draft of the questionnaire was presented in the annual general meeting (AGM) of the Global Benchmarking Network (GBN). There were eight country representatives attending the meeting, including Dr. Robert Camp, the honorary president of the GBN and who wrote one of the earliest books on benchmarking. At least four of the members are Ph.D. holders and the rest are benchmarking professionals with long experience in benchmarking. The purpose behind presenting the questionnaire to the GBN members was to obtain their feedback and suggestions. The questionnaire was reviewed in a workshop during the AGM. The reviewers provided improvement suggestions and new questions. The suggested changes and additions were made and the final draft sent again to all GBN 17.
(31) Global survey on business improvement and benchmarking. members for any other comments. Another batch of comments was received and implemented. After incorporating all suggestions, the final questionnaire was issued and sent again for all GBN members in order to obtain their support for distribution of the questionnaire to their contacts database. Furthermore, the questionnaire was translated into German, Chinese, Russian, Hungarian and Arabic in order to make it easier to answer and to ensure wider coverage. The GBN members helped in translating the questionnaire.. 3.5 Questionnaire Structure and Questions. The questionnaire was designed to cover different types of benchmarking experience, whether the organisation is a beginners or advanced. Even if the organisation does not do any benchmarking, there will be questions relevant to them. The first part of the questionnaire aims to explore the position of best practice benchmarking, performance benchmarking and informal benchmarking among 20 popular improvement tools. Definitions were provided for all the techniques to ensure that the respondents had the same understanding of each technique. The second part of the questionnaire (section two) aims to explore performance benchmarking in more detail, such as frequency of benchmarking training and services supplied by a third party. The third part of the questionnaire (sections three to seven) aims to explore the status of best practice benchmarking and how organisations are performing in each stage of their benchmarking projects. To make it easier for respondents to answer the questions, the questionnaire was divided into seven sections. Each section covers a main topic: •. Section 1 - Organisation’s Profile: The purpose of this section is to collect demographic data about the organisation, such as sector, size, business activity and number of years in operation.. •. Section 2 - Use of Improvement Techniques: The purpose of this section is to collect data about level of awareness, level of usage,. 18.
(32) Global survey on business improvement and benchmarking. effectiveness and future usage for 20 popular improvement techniques. •. Section 3 - General Questions on Benchmarking: The purpose of this section is to collect data about performance benchmarking projects in general. Only organisations using performance benchmarking or best practice benchmarking are required to answer this section.. •. Section 4 - Best Practice Benchmarking Projects - Planning: The purpose of this section is to collect data about the planning phase of best practice benchmarking such as involvement of employees in benchmarking projects and area/process of benchmarking. Only organisations conducting best practice benchmarking are required to answer this section and the following section.. •. Section 5 - Best Practice Benchmarking Projects - Research and Analysis: The purpose of this section is to collect data about research, data collection, and analysis phase. In particular, it collects data about benchmarking data sources.. •. Section 6 - Best Practice Benchmarking Projects - Implementation: The purpose of this section is to collect data about the different aspects of implementation phase, such as time taken to implement the project.. •. Section 7 - Best Practice Benchmarking Projects - Evaluation: the purpose of this section is to collect data about the benchmarking project evaluation phase and how organisations measure success of the project.. 3.6 Validity and Reliability. Due to the rigorous process used to develop and review the questionnaire, the data is considered to be valid and reliable. The following are the main steps of the questionnaire development that enabled validity and reliability: •. Clear definitions for each type of benchmarking and the 20 improvement techniques were provided to ensure clarity for understanding the questions.. •. The final draft of the questionnaire, which was developed by the researcher, was presented at the GBN's annual meeting for review. A 19.
(33) Global survey on business improvement and benchmarking. team. with. extensive. benchmarking. knowledge. reviewed. the. questionnaire in a workshop and provided input on its design. •. The questionnaire version that incorporated suggestions of the review team at GBN's annual meeting was sent to the 21 GBN's members for further review. The final version was issued after three months of several enhancement and tweaking inputs from GBN members and academics.. •. The non-English versions of the questionnaire were translated by native speakers with experience in benchmarking. The translated versions were translated back into English by an electronic solution to make sure that the translation is correct.. 3.7 Questionnaire Delivery Methods and Distribution Channels. After nearly three months of revising the final draft with GBN members, the final questionnaire was published in six languages using two methods of delivery. The first and main method was the use of an online survey solution (SurveyMonkey). A set of automatic rules was used in the electronic copy to guide responders in answering the questions that were relevant to them only and to prevent misunderstanding. The second method was by using MS Word versions were provided for respondents with limited access to the Internet. There were two main distribution channels for the questionnaire. The first was through Business Performance Improvement Resource (BPIR.com) members, which is a membership-based website for users interested in benchmarking and business improvements. The website has members around the world from different sectors and sizes. The second method was through GBN members; each member sent the questionnaire to his or her contacts database. In order to increase response rate, periodical reminders were sent to contacts to encourage them to answer and complete the questionnaire. Collectively, the questionnaire invitation went to thousands of contacts from around the world through BPIR.com and the GBN members. It is not possible to calculate precisely the number of invitations sent due to the multiple channels of distributions. 20.
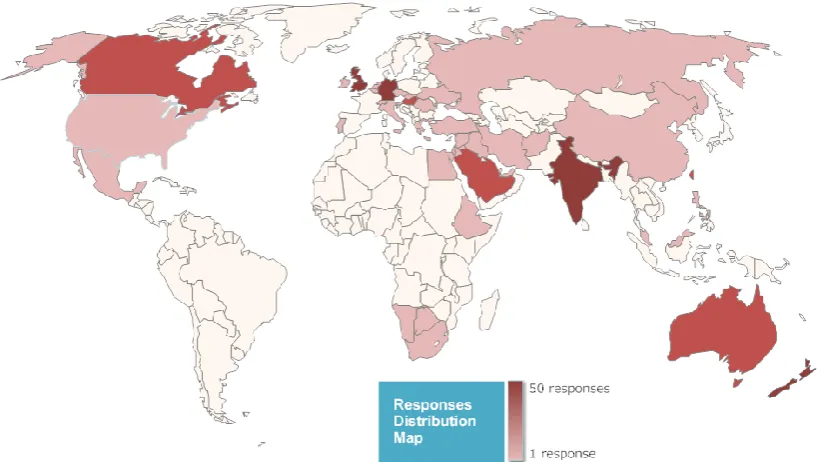
(34) Global survey on business improvement and benchmarking. Chapter 4: Results 4.1 Introduction. Although it was not possible to conduct the study in each and every country globally, data was collected from all regions globally. Therefore the study qualifies to be a representative study of global survey on business improvement from an international point of view. In other words, the data collection process was well distributed in obtaining findings that represent a global picture on benchmarking and business improvement. The global map shown on figure 2 indicates that the study is conducted on an international perspective.. 4.2 Survey Results. The results of more than 450 responses received from 44 countries around the world revealed many interesting findings about improvements techniques, benchmarking in general and phases of Best Practice Benchmarking in particular. Due to the lack of GBN members in South America and Africa, the researcher relied on other sources to get responses, such as the international contacts of GBN members, members of BPIR.com, and posting blogs about the study.. 4.3 Survey Results Analysis. This section is the results of survey results analysis; the analysis was done using SPSS and MS Excel.. 4.3.1 Questionnaire Section 1 Organisation Profile. 4.3.1.1. Question 1.1 Responses Distribution.. 21.
(35) Global survey on business improvement and benchmarking. Figure 2. World responses distribution. The Figure above represents a diagrammatic presentation of how responses were obtained from various respondents from different parts of the world. The global map shows the different countries where responses were obtained. The respondents’ countries are shaded with varied colour intensities to show the concentration of the responses. The countries shaded with more intense colours gave more responses than those with light colour intensities. The distribution of responses ranges from 1 to 50, depending on the colour intensity. Countries that are not shaded produced no responses for the study.. The map indicates that most of the responses came from UK, New Zealand, Australia, Germany, Canada, India and the Middle East. Other countries from different parts of the world did not give many responses, as indicated by the light colour. In summary, there is a reasonable distribution of respondents from all regions globally. This gives the study good coverage for the developed and emerging countries.. 22.
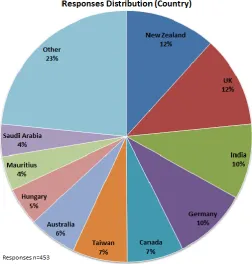
(36) Global survey on business improvement and benchmarking. Figure 3. Responses distribution by country. As indicated in the chart above, most of the responses came from New Zealand and UK with 12% each, then India and Germany with 10% each, Taiwan and Canada with 7% each, Australia 6%, Hungary 5%, and Saudi Arabia and Mauritius with 4% each. Other countries produced 23% of the total responses of the study, this include US, Singapore, UAE, China and other. The total responses were 453 valid responses.. 23.
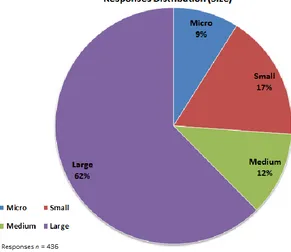
(37) Global survey on business improvement and benchmarking. Figure 4. Responses distribution by organisation size. Out of the 453 responses there were 436 responses with organisations’ data. Of these, 9% were completed by micro-sized organisations (one to nine employees), 17% were completed by small-sized organisations (10 to 49 employees), 12% were completed by medium-sized organisations (50 to 250 employees), and 62% were completed by large organisations (more than 250 employees).. 4.3.1.2. Question 1.2. What is your organisation’s major business activity?. In order to know if there is a co-relation between the benchmarking performance of sectors, it was important to ensure that respondents have mentioned the major business activities of their organisation. This will show which organisations have better implementation for benchmarking as a tool to improve their performances. Around 65% of responses were from five sectors (manufacturing organisations, personal and other services, government administration and defence, education, and health and community services) (Figure 5). 24.
(38) Global survey on business improvement and benchmarking. Figure 5. Response distribution by business activity. 4.3.1.3. Question 1.3. Within which sector does your organisation operate?. Another important factor to consider when looking for high benchmarking uptake is if there are any differences between sectors. The majority of responses we obtained were from private sectors with 63%, followed by public sector with 27% and finally, non-profit with 10% of total responses (Figure 6).. 25.
(39) Global survey on business improvement and benchmarking. Figure 6. Responses distribution by sector. 4.3.1.4. Question 1.4. For how many years has your organisation been operating?. It was also essential to consider how long the organisations participating in the study have been in business. This was important in order to determine if there is any correlation between the number of years in operation and other findings, such as the preferred business improvement technique, benchmarking uptake and results.. 26.
(40) Global survey on business improvement and benchmarking. Figure 7. Number of years in operation. The largest category was 54% of responses which came from organisations that have been operational for more than 20 years. The average number of years in operation for the other categories less than 20 years is around 11%. It is therefore true that most of the responses were from organisations that have good experience and are well established (Figure 7).. 4.3.2 Questionnaire section 2. Use of Improvement Techniques. 4.3.2.1. Question 2.1. Improvement techniques implemented in your organisation.. Level of awareness for moderate and high use of improvement techniques.. Figure 8 shows the popularity of different improvement techniques in terms of knowledge or awareness. Respondents were asked to rate their level of. 27.
(41) Global survey on business improvement and benchmarking. awareness for each one of the 20 improvement techniques. Eighty-six percent of respondents said that they have moderate or high levels of knowledge about customer (client) surveys, followed by 83% for SWOT analysis, and 82% for mission and vision statement. Informal benchmarking was sixth with 75%, the performance benchmarking was just above the 65% Mean, and Best practice benchmarking was just below the mean with 60%.. Figure 8. Awareness of business improvement techniques. Level of usage of improvement techniques.. 28.
(42) Global survey on business improvement and benchmarking. In this question, respondents were required to highlight the improvement techniques currently in use in their organisations during the time of the study. It is worth noting that some of the highly rated improvement techniques in awareness in the previous question were not widely used. Also, the informal benchmark (which is the sixth in awareness) came fourth in usage. On the other hand, best practice benchmarking, which came in at number 12 in awareness, is number 15 in usage and below the mean by 10%. This means that there are other factors. hindering. organisations. from. implementing. the. best. practice. benchmarking other than knowledge or expertise (Figure 9).. Figure 9. Current use of business improvement techniques. 29.
(43) Global survey on business improvement and benchmarking. Since we have measured the level of awareness and usage, it is important to know how effective benchmarking is. The chart below shows the average for “moderate” and “major” level of effectiveness. It was evident from the findings that Quality Management System, Improvement Teams and Customer Client surveys are perceived as the most effective improvement techniques, which is shown by high percentage (80%, 77% and 77% respectively) among the responses. Informal benchmarking, performance benchmarking and best practice benchmarking scored lower results (Figure 10).. Figure 10. Effectiveness of business improvement techniques. Respondents were also required to state if they expect to use any of the 20 improvement techniques in the coming three years from when the responses were collected. The idea here was to understand what would be the 30.
(44) Global survey on business improvement and benchmarking. benchmarking uptake compared to the other major improvement techniques in the next three years. From the chart below, it is evident that though many of the business improvement techniques were used in most of the organisations, most of them will not be in use in the coming three years. Regarding benchmarking, Performance benchmarking and informal benchmarking were first and second, and best practice benchmarking came fourth. A mean of 48% future use of different business improvement techniques which was below average, shows that most of the organisations that were involved in the study were not willing to continue implementing improvement techniques that they were using in their business organisations (Figure 11).. Figure 11. Future use of improvement techniques. 31.
(45) Global survey on business improvement and benchmarking. 4.3.2.2. Question 2.2. What are the main reasons for not using performance benchmarking or best practice benchmarking within your organisation?. At the end of section one the respondents were asked to state the top three reasons for not using benchmarking. In this question we asked respondents to rate three reasons for not using performance benchmarking or best practice benchmarking in descending order according to their importance. In the analysis of this question, the reasons selected as number one were given three points, two points for reasons selected as number two, and one point for reasons selected as number three. Figure 12 below shows the average points for each reason. It is evident from the responses collected that organisations that participated in the study had technical reasons in the top reasons as to why they never used benchmarking. The most important three reasons were lack of resources, lack of benchmarking partners, and lack of technical knowledge on how to do benchmarking.. Figure 12. Reasons for not using benchmarking or best practice benchmarking 32.
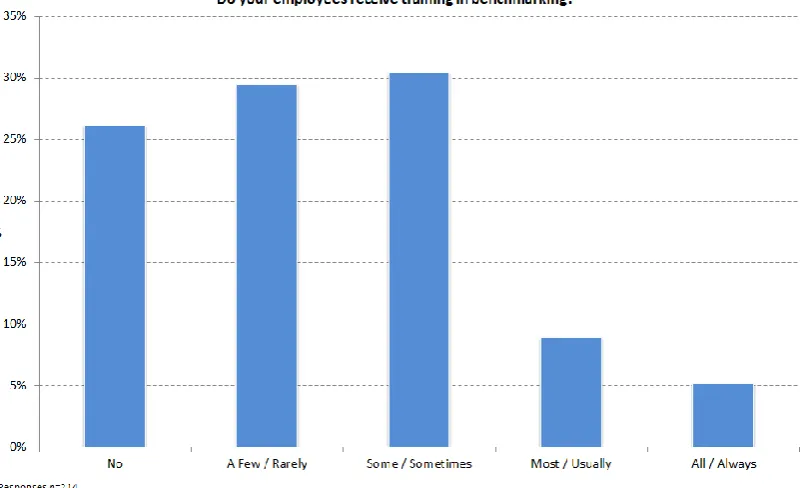
(46) Global survey on business improvement and benchmarking. 4.3.3 Questionnaire Section 3 General Questions on Benchmarking. In order to understand more about benchmarking and how it is implemented, which is the key issue in the study, respondents were required to state how benchmarking was used in their respective organisations. Questions about use of benchmarking were introduced to respondents and they were required to give their opinion by marking different options provided in the survey.. 4.3.3.1. Question 3.1. Benchmarking Training, Data Collection and Dissemination of Results.. Figure 13. Benchmarking training for employees. The above graph shows responses from different employees who participated in the study on how employees were trained in benchmarking. The graph shows that on average, some organisations do not train their employees on benchmarking; this constituted about 26% of the response collected. Twentynine percent of respondents pointed out that training in benchmarking is rare, while only 14% of organisations “usually” and “always” train their employee in 33.
(47) Global survey on business improvement and benchmarking. benchmarking. Therefore, without proper training in benchmarking, it is most likely that the benchmarking projects will not be effective.. There was also need to find out what employees do on their own about benchmarking as they carry out their day-to-day responsibilities. The graph in Figure 13 has clearly shown that most of the employees who participated in the study had not received any training about benchmarking. It was therefore important to find out what employees do about benchmarking. Respondents were asked to state if employees collect and use benchmarking information. The findings of the study were recorded in a graphical form, as shown below.. Figure 14. Collection and use of benchmarking data. It is evident from the above graph that employees sometimes collect and use data on benchmarking. About 45% of the employees who participated in the study agreed to have collected and used benchmarking information. Only 6% indicated that they have never collected any benchmarking information. About 21% indicated that they do it “rarely”. This shows that employees do collect and use information on benchmarking on their own, regardless of the fact that they receive little training on the same from their organisations. 34.
(48) Global survey on business improvement and benchmarking. Figure 15. Disseminations of best practices. Figure 15 shows what organisations are doing regarding dissemination of best practices that resulted from the benchmarking projects. Approximately 42% of organisations do “always” and “usually” communicate the best practice that has been identified to their employees, 17% do not communicate it or do it “rarely”, while 31% of organisations communicate the best practices sometimes.. 4.3.3.2. Question 3.2. For each of the following performance areas, does your organisation collect benchmarks (performance comparison data on other companies)?. We also wanted to know what area is the most important for organisations in collecting benchmarks data from. Therefore, respondents were required to state if their collected data on areas is related to employees, financial processes, services and products.. 35.
(49) Global survey on business improvement and benchmarking. Figure 16. Collection of benchmarking data in employee-related area. The above graph shows the responses on whether the organisations collected any benchmarks related to employees. The graph shows relatively equal distributed responses on how much organisations collected benchmarks on issues related to employees. Most of the respondents pointed out that their organisations collect benchmarks on matters related to employees. In fact, only about 16% of the respondents said that their organisations do not collect any benchmarks related to employees.. 36.
(50) Global survey on business improvement and benchmarking. Figure 17. Collection of benchmarking data in financial-related areas. For benchmarks related to financial issues, respondents indicated that their organisations collect benchmarks from other businesses for comparison purposes. The graph shows an increasing trend for financial area benchmarks; over 85% of the respondents agreed that their organisations collected benchmarks on financial matters and only about 14% of the respondents stated that their organisations do not collect any benchmarks on financial-related areas. Thirty-one percent of the organisations collect benchmarks regularly for all important measures and the data is regularly reviewed and acted upon (Figure 17).. 37.
(51) Global survey on business improvement and benchmarking. Figure 18. Collection of benchmarking data in process-related areas. Respondents were also required to give their views on the collection and usage of benchmarks in their organisations for process-related areas. The graph above shows that the majority of respondents indicated that their organisations collect process-related benchmarks. Twenty percent said that they collect benchmarks regularly for all important measures and the data is regularly reviewed and acted upon, while 25% said that they collect the process-related benchmarks regularly. Fourteen percent said they do not collect benchmarks in process-related areas. (Figure 18). 38.
(52) Global survey on business improvement and benchmarking. Figure 19. Collection of benchmarking data in product or services related areas. The fourth area to ask the respondents about was benchmarks related to product or services. Only 8% said that they do not collect any benchmarks related to product or service, while more than 50% said that they do collect benchmarks regularly for all important measures, and 25% regularly review and act upon the benchmarks they have collected (Figure 19).. Figure 20. Collection of benchmarking data in customer-related areas. 39.
Figure
+7
Related documents
According to the CERRA annual supply and demand report in 2013-14 school year “across all school levels, special education teachers accounted for the greatest number of hires in
[r]
Grassroots’ lobbying and financing political campaigns or parties ( the US experience…. ) has to be forbidden for companies , and lobbyists ( only for private individuals as
Table 5 displays some basic demographic information for each Illinois LATA. It reveals that there is considerable variation in LATA demographics within Illinois. Not surprisingly,
Exposure of cellular system to chemical agents, free radicals and radiations brings carcinogenesis in them which further result in disruption of important biochemical reactions
In this work, the authors have applied this tool to analyse the lighting of an indoor environment by two points of view: the way in which the light is distributed in a room
Ohw*v wxuq qrz wr wkh wzr rwkhu w|shv ri lpsxovh uhvsrqvhv/ zklfk wdnh h{solflwo| dffrxqw ri wkh fruuhodwlrq ehwzhhq lqqrydwlrqv1 Wkh pdlq glhuhqfh ehwzhhq wkh wzr dssurdfkhv lv
Dur- ing the implementation, we slightly modified WikiMiner and TAGME: in WikiMiner we decided to rank the entities using a linear combination of commonness, link probability,
