Submitted in fulfilment of the requirements for the Degree of Doctor of Philosophy University of Tasmania (March, 2011).
Ecological
Implications
of Exurban
Development
The effects of people,
pets and paddocks on
avian and mammalian
wildlife
ii
Declaration of originality and authority of access
This thesis is submitted in fulfilment of the requirements for the Degree of Doctor of Philosophy at the School of Geography and Environmental Studies, University of Tasmania (March, 2011). It contains no material which has been accepted for the award of any other Degree or Diploma in any tertiary institution, and to the best of my knowledge and belief, contains no material previously published or written by another person, except where due reference is made in the text of the thesis, nor does the thesis contain any material that infringes copyright.
This thesis may be made available for loan and limited copying in accordance with the Copyright Act 1968.
Signed
iii
Abstract
Broad-acre subdivisions on the fringe of cities constitute a relatively novel and rapidly increasing form of urban development known as exurbia. Despite the potentially significant effects exurban development can have on nature, no study has documented its effects on the distinct faunal communities of Australia. Within two exurban regions of Hobart, Tasmania, Australia, birds were sampled within discrete exurban habitats, exurban forest, modified forest, gardens, and paddocks, and corresponding wildland forests. Flightless mammals were surveyed by spotlight in the same environments. Landowners gave their opinions on a variety of nature-related issues. Their ownership of domestic mesopredators, participation in activities that might affect wildlife, and
iv Attitudinal group was also associated with the distribution of some garden types, but not with landscape characteristics. Exurbanite attitudinal type had very little influence on the frequency or distribution of wild mammals observed by spotlight, but nature lovers were more likely to report observations of some species. Independent of attitudinal groups, the most detrimental landowner activity was pet ownership. Any detrimental effects of exurban domestic cat populations were unapparent due to the non-uniform distribution of cat owners and the presence of feral cats. Properties with dogs, however, were distributed more uniformly, and were avoided spatially and temporally by several species of mammal, including species that dog owners had not observed as prey. Within an isolated peninsula exurban region, the spatial avoidance of exurbia resulted in low numbers of those mammal species with large home range requirements. One species of bandicoot, however, was more common where houses were relatively dense. Overall, two very fecund mammal species, including a threatened native bandicoot, were more abundant in exurbia than in wildlands. For mammal
conservation, houses may best be clustered in areas where access to wildland remnants is limited. This will slightly diminish the mammalian species diversity where residents live, but may be preferable to dispersed housing developments, which support greater species diversity than clustered developments, but will also distribute the effects of domestic mesopredators over a greater proportion of the landscape. Heterogeneous exurban landscapes are not necessarily detrimental for avifaunal conservation, as long as they include areas of undisturbed native vegetation, either in remnants or on exurban
v
Acknowledgements
I would like to thank my family, my friends and my supervisors, all of whom have never failed to provide love and support.
vi
Table of Contents
DECLARATION OF ORIGINALITY AND AUTHORITY OF ACCESS ... II ABSTRACT ... III ACKNOWLEDGMENTS ... V TABLE OF CONTENTS ... VI LIST OF FIGURES AND TABLES ... VIII
CHAPTER 1 - INTRODUCTION ... 11
CHAPTER 2 - STUDY AREA - EXURBAN HOBART ... 19
Natural vegetation ... 23
Habitat classifications ... 25
CHAPTER 3 - AVIFAUNAL RESPONSES TO EXURBANISATION ... 32
Introduction ... 32
Methods ... 39
Results ... 46
Discussion ... 72
Conclusion ... 81
CHAPTER 4 - THE INFLUENCE OF EXURBIA ON FLIGHTLESS MAMMAL DISTRIBUTION ... 82
Introduction ... 82
Methods ... 89
Results ... 100
Discussion ... 114
Conclusion ... 121
CHAPTER 5 - INTERACTIONS BETWEEN EXURBAN PEOPLE, PETS AND WILDLIFE ...123
vii
Methods ... 128
Results ... 138
Discussion ... 154
Conclusion ... 163
CHAPTER 6 - FUTURE DIRECTIONS FOR EXURBAN PLANNING AND RESEARCH ...164
REFERENCES ... 168
APPENDIX A - INDEPENDENT VARIABLES TESTED IN EXURBAN BIRD ANALYSES ...189
APPENDIX B - RELATIONSHIPS BETWEEN INDEPENDENT VARIABLES (KINGBOROUGH BIRDS) ...192
APPENDIX C - RELATIONSHIPS BETWEEN INDEPENDENT VARIABLES (SOUTH ARM BIRDS)...194
APPENDIX D - BIRD SPECIES RECORDED IN EXURBIA AND WILDLANDS ...196
APPENDIX E - TAXONOMY AND LIFE HISTORY TRAITS OF ALL BIRD SPECIES RECORDED ...200
APPENDIX F - ACTIVE BIRD NESTS RECORDED IN EXURBIA AND WILDLANDS ...206
APPENDIX G - SITE CHARACTERISTICS RELATED TO BIRD OCCURRENCE (KINGBOROUGH) ...208
APPENDIX H - SITE CHARACTERISTICS RELATED TO BIRD OCCURRENCE (SOUTH ARM)...213
APPENDIX I - PREDICTIVE BIRD SPECIES ABUNDANCE MODELS (KINGBOROUGH) ...219
APPENDIX J - SIGNIFICANCE OF VARIABLES WITHIN KINGBOROUGH PREDICTIVE MODELS ...222
APPENDIX K - PREDICTIVE BIRD SPECIES ABUNDANCE MODELS (SOUTH ARM) ...223
APPENDIX L - SIGNIFICANCE OF VARIABLES WITHIN SOUTH ARM PREDICTIVE MODELS ...226
APPENDIX M - RELATIONSHIPS BETWEEN INDEPENDENT VARIABLES (KINGBOROUGH MAMMALS) ....227
APPENDIX N - RELATIONSHIPS BETWEEN INDEPENDENT VARIABLES (SOUTH ARM MAMMALS) ...228
APPENDIX O - SPOTLIGHT SURVEY DURATION TEST ...229
APPENDIX P - LANDOWNER QUESTIONNAIRE ...231
APPENDIX Q - VARIATION IN THE SURVEY RESPONSES OF EXURBANITE GROUPS ...247
APPENDIX R - VARIATION IN THE WILDLIFE OBSERVED ON THE PROPERTIES OF GROUPS OF PEOPLE ...250
viii
List of Figures and Tables
FIGURE 1:SOUTH ARM 2004 ... 21
FIGURE 2:A REPRESENTATIVE SECTION OF KINGBOROUGH IN 2004 ... 22
FIGURE 3:A REPRESENTATIVE SAMPLE OF SOME OF THE FOREST TYPES FOUND WITHIN EXURBIA ... 24
FIGURE 4:TYPES OF FOREST MODIFICATION IN EXURBIA ... 26
FIGURE 5:EXURBAN PADDOCKS ... 28
FIGURE 6:VARIATION IN THE COMPOSITION OF KINGBOROUGH BIRD PLOTS ... 47
FIGURE 7:VARIATION IN THE COMPOSITION OF SOUTH ARM BIRD PLOTS ... 48
FIGURE 8:THREE-DIMENSIONAL DISTRIBUTION OF THE BIRD SPECIES ASSEMBLAGES OF HABITATS. ... 52
FIGURE 9:THE DISTRIBUTION OF NOISY MINERS AT SOUTH ARM SITES ... 55
FIGURE 10:THREE-DIMENSIONAL DISTRIBUTION OF THE BIRD ASSEMBLAGES OF HABITATS WITH AND WITHOUT MINERS ... 58
FIGURE 11: DISTRIBUTION OF THE BIRD ASSEMBLAGES OF SITES SORTED BY FREQUENCY OF OCCURRENCE OF NOISY MINERS ... 59
FIGURE 12:BIRD SPECIES RICHNESS AND ABUNDANCE FOR FOREST, GARDEN AND PADDOCK HABITATS ... 60
FIGURE 13:BIRDS SPECIES RICHNESS AND ABUNDANCE IN WILDANDS AND INDIVIDUAL EXURBAN HABITATS ... 70
FIGURE 14:MEAN 'HAPPINESS TO SHARE PROPERTY WITH' SCORES FOR FAUNAL SPECIES ... 140
FIGURE 15:VARIATION IN GROUP OPINION REGARDING STATEMENTS RELATING TO TREES ... 140
FIGURE 16:DISTRIBUTION OF EXURBAN PEOPLES’ CUMULATIVE SURVEY RESPONSES IN 3-DIMENSIONAL ORDINATION SPACE. . 141
TABLE 1:ANALYSIS OF SIMILARITY OF THE BIRD SPECIES ASSEMBLAGES OF EXURBAN REGIONS AND WILDLANDS ... 49
TABLE 2:ANALYSIS OF SIMILARITY BETWEEN THE BIRD ASSEMBLAGES OF WILDLANDS AND INDIVIDUAL EXURBAN HABITATS ... 50
TABLE 3:ANALYSIS OF SIMILARITY BETWEEN THE BIRD SPECIES ASSEMBLAGES OF EXURBAN HABITATS WITHIN A REGION... 50
TABLE 4:ANALYSIS OF SIMILARITY BETWEEN THE BIRD SPECIES ASSEMBLAGES OF INDIVIDUAL HABITATS BETWEEN REGIONS ... 51
TABLE 5: SPECIES THAT CONTRIBUTE TO THE INTERSITE SIMILARITY WITHIN HABITATS AND MEAN DISSIMILARITY BETWEEN PAIRED HABITATS BETWEEN AND WITHIN REGIONS ... 53
ix
TABLE 7:SPECIES THAT DIFFERED SIGNIFICANTLY IN THEIR PERCENTAGE FREQUENCIES OF OCCURRENCE BETWEEN KINGBOROUGH
HABITATS ... 61
TABLE 8:SPECIES THAT DIFFERED SIGNIFICANTLY IN THEIR PERCENTAGE FREQUENCIES OF OCCURRENCE BETWEEN SOUTH ARM HABITATS ... 62
TABLE 9:EXURBAN HABITAT SPECIALISTS. ... 63
TABLE 10:SPECIES RECORDED EXCLUSIVELY IN ONE HABITAT TYPE ... 64
TABLE 11:EXURBAN PLOT CHARACTERISTICS SIGNIFICANTLY RELATED TO THE OCCURRENCE OF SPECIES IN KINGBOROUGH. ... 65
TABLE 12:EXURBAN SITE CHARACTERISTICS SIGNIFICANTLY RELATED TO THE OCCURRENCE OF SPECIES IN SOUTH ARM SITES .... 66
TABLE 13:INDEPENDENT VARIABLES SIGNIFICANTLY CORRELATED TO THE ABUNDANCES OF POTENTIAL GENERALISTS WITHIN EXURBAN SITES, INCLUDING THE VARIABLES THAT COMPRISE THE PREDICTIVE MODELS AND THEIR PREDICTIVE POWER. ... 67
TABLE 14:SPECIES THAT HAVE SIGNIFICANTLY DIFFERENT PERCENTAGE FREQUENCY OF OCCURRENCE IN WILDLANDS AND KINGBOROUGH EXURBAN FOREST ... 69
TABLE 15:SPECIES THAT SIGNIFICANTLY DIFFER IN FREQUENCY OF OCCURRENCE BETWEEN WILDLANDS AND KINGBOROUGH EXURBAN MODIFIED FOREST ... 71
TABLE 16SPECIES THAT SIGNIFICANTLY DIFFER IN FREQUENCY OF OCCURRENCE BETWEEN WILDLANDS AND SOUTH ARM EXURBAN FOREST ... 71
TABLE 17:SPECIES THAT SIGNIFICANTLY DIFFER IN FREQUENCY OF OCCURRENCE BETWEEN WILDLANDS AND SOUTH ARM EXURBAN MODIFIED FOREST. ... 72
TABLE 18:VARIATION IN SPOTLIGHTING EFFORT BETWEEN HABITAT TYPES ... 94
TABLE 19:SPECIES THAT WERE INCLUDED ON THE LIST PROVIDED TO EXURBAN LANDOWNERS. ... 95
TABLE 20:PERCENTAGE DISTRIBUTION OF MAMMALIAN SPECIES AND GROUPS ACROSS EXURBAN PROPERTIES ... 101
TABLE 21:SPECIES FREQUENCIES OF OCCURRENCE (SS) IN EACH EXURBAN REGION AND THE CORRESPONDING WILDLANDS ... 104
TABLE 22:LIFE HISTORY AND ECOLOGICAL CHARACTERISTICS POTENTIALLY AFFECTING SPECIES ADAPTABILITY TO EXURBANISATION. ... 105
TABLE 23:EAR VALUES AND RANKINGS, AND SPECIES TRAIT RANKINGS, FOR KINGBOROUGH SPECIES THAT QUALIFIED FOR EAR ANALYSIS. ... 107
x
TABLE 25:PROPERTY CHARACTERISTICS WITHIN EACH EXURBAN REGION ... 109 TABLE 26:SIGNIFICANT RELATIONSHIPS BETWEEN MAMMAL TAXA AND EXURBAN GARDEN TYPES AND ARTEFACTS WITHIN THE
KINGBOROUGH (LIGHT GREY COLUMNS) AND SOUTH ARM (DARK GREY COLUMNS) REGIONS. ... 110 TABLE 27:SIGNIFICANT RELATIONSHIPS BETWEEN MAMMAL TAXA AND EXURBAN LAND COVER TYPES, SUBSTRATE, AND PROPERTY
SIZE AND LOCATION. ... 111
TABLE 28:VARIATION IN THE COMPOSITION OF PROPERTIES OWNED BY EACH OF THE PEOPLE ASSEMBLAGES ... 145 TABLE 29:PROPORTION OF GROUPS WITH SOCIOECONOMIC AND DEMOGRAPHIC CHARACTERISTICS ... 148
TABLE 30:SIGNIFICANT RELATIONSHIPS BETWEEN MAMMAL SPECIES AND EXURBAN LIVESTOCK AND EXURBANITE LAND
MANAGEMENT PRACTICES... 150 TABLE 31:PERCENTAGE OF PET OWNERS THAT REPORTED SPECIES AND LIFE FORMS AS PREY OF THEIR PETS ... 151 TABLE 32:SIGNIFICANT RELATIONSHIPS BETWEEN MAMMAL REPORTS AND OBSERVATIONS AND ASPECTS OF DOMESTIC
11
Chapter 1
Introduction
From the 1970s, a significant proportion of Australia’s residents moved from urban to rural areas, creating a rural population turnaround (Hugo, 1994; Walmsley et al., 1998; Curry et al., 2001). Although the turnaround may have slowed in some regions (Hugo, 1994), the areas beyond the fringes of Australian cities are still zones of relatively high population growth (Australian Bureau of Statistics, 2010). Similar population shifts have occurred in China (Tian et al., 2007) and in the United States (Brown et al., 2005). As a result of shifting populations, large areas formerly covered with wildlands or agricultural lands are now occupied by low density residential developments (Knight, 1999; Maestas et al., 2002; Brown et al., 2005; Tian et al., 2007) known collectively as exurbia (Marzluff et al., 2001).
Introduction
12 requires more land per capita than urban and suburban zones, and thus potentially exposes a greater proportion of the landscape to the detrimental effects of
urbanisation, leading to uncertainty over whether houses in fringe developments should be clustered or dispersed (Nilon et al., 1995; Odell and Knight, 2001; Lenth et al., 2006). In addition, due to socioeconomics (Tian et al., 2007), and the attraction
of natural amenities (Walmsley et al., 1998; Hansen et al., 2002; Rasker and Hansen, 2002; Holmes, 2006), exurban developments can expand, and be distributed, non-uniformly across the landscape (Hansen et al., 2005; Tian et al., 2007; Wade and Theobald, 2010), resulting in coincidence with sensitive ecosystems (Gonzalez-Abraham et al., 2007) or local breeding hotspots (Hansen and Rotella, 2002). Thus, there is a potential for exurban developments to reduce the viability of wildlife populations in adjacent reserves (Hansen and Rotella, 2002).
The combination of rapid landuse transition and substantial potential implications for biodiversity, makes studies of exurban nature a high priority for nature conservation (Theobald, 2004). Despite this, exurban ecologies remain critically understudied, with ecologists focussing more on non-urban landscapes (Collins et al., 2000; Miller and Hobbs, 2002; Adams, 2005). Studies of exurban nature are largely limited to a small number of North American studies on invertebrates (Bock et al., 2006b; Bock et al., 2007), mammals (Vogel, 1989;
Harrison, 1997; Harrison, 1998; Odell and Knight, 2001; Maestas et al., 2003; Bock et al., 2006a; Bock et al., 2006c; Lenth et al., 2006; Storm et al., 2007), avifauna (Odell
Introduction
13 Lenth et al., 2006). The urban ecological literature is replete with studies of biota, avifauna in particular, along gradients of urbanisation or landuse intensity
(McDonnell and Hahs, 2008). However, due to the varied terminology used to describe levels of urbanisation, and the failure of many studies to follow standard definitions of, or elucidate the measures used to quantify, levels of urbanisation (Marzluff et al., 2001; McDonnell and Hahs, 2008), it is difficult to conclusively determine which studies include exurban sites. Certainly at least one Euro-Canadian (Clergeau et al., 1998) and three American (Nilon et al., 1995; Hansen and Rotella, 2002; Haskell et al., 2006) studies of avifauna, and one Australian study of plants (Williams et al., 2005), include exurban sites. In addition to these ecological
observations, some studies have documented the attitudes and opinions of exurban residents on matters of nature conservation (Harrison, 1998; Woolcott Research, 2002; Storm et al., 2007).
Most of the observational studies above were conducted in treeless rangelands and compared elements of biodiversity to both housing density and grazing
intensity, because of the ‘cows vs. condos’ debate (Knight et al., 1995). This is a situation not entirely relevant to Tasmania, where treeless exurban vegetation is predominately comprised of exotic plants, due to widespread conversion of native grassy ecosystems following European colonisation (Kirkpatrick et al., 1988). Nonetheless, these studies have documented some significant ecological
Introduction
14 Exurbanisation can cause shifts in species dominance within taxa (Vogel, 1989), sometimes resulting in greater abundances of dietary generalists (Bock et al., 2007) and birds that are cavity nesters, granivores, and / or aggressive edge species (Nilon et al., 1995; Odell and Knight, 2001; Bock et al., 2008), all of which can result from
urbanisation in general (Pickett et al., 2001; Adams, 2005; Chace and Walsh, 2006). Species exhibit varied responses to exurban housing proximity (Vogel, 1989; Harrison, 1997; Harrison, 1998; Odell and Knight, 2001; Bock et al., 2006a), but the majority of species studied appear to decline in number with increasing exurban housing density (Vogel, 1989; Odell and Knight, 2001; Bock et al., 2008), as many species do along more extensive gradients of urbanisation (Adams, 2005; Chace and Walsh, 2006).
Because a greater proportion of natural vegetation remains within exurban landscapes, they could be expected to be less homogenising than urban areas, resulting in strong regional variations in biotic responses. Indeed, the effects of exurbanisation can vary between ecosystems. Within naturally treeless habitats, exurbanisation can benefit species that utilise trees for nesting (Maestas et al., 2003) or shade (Bock et al., 2007), are dependent on dense shrub cover (Bock et al.,
Introduction
15 Similarly, shrub or ground nesting birds suffer from exurbanisation of arid rangelands (Maestas et al., 2003), but not from exurbanisation of forest habitats (Haskell et al., 2006).
Variable responses to exurbanisation could be a result of more than resource distribution in the exurban matrix. The influence of detrimental processes, such as pesticide use and avian predation, are also potentially significant (Bock et al., 2007), and are likely to vary between habitats. High predation rates in open grassland habitats could be primarily responsible for the predominance of multivoltine
butterflies in such habitats (Bock et al., 2007), because fecund species are capable of maintaining viable population sizes whilst suffering high levels of mortality (Pimm et al., 1988). Because the effects of exurban development can vary between
ecosystems, regional comparisons of exurban ecology are needed in order to determine the types of ecosystems that are particularly vulnerable (Hansen et al., 2005).
Exurbanisation can have significant effects on mammalian predator
Introduction
16 mesopredators are known to do (Coman and Brunner, 1972; Barratt, 1997b); and to have greater variation in home range sizes (Harrison, 1997), which suggests a non-uniform distribution of resources and / or competing domestic predators within exurbia.
Rates of plant extinction have been found to be lower in exurbia than in more urbanised areas (Williams et al., 2005). Native forb richness can actually increase with exurbanisation, because some species benefit from exurban disturbance regimes (Bock et al., 2006b; Bock et al., 2007), just as a variety of ephemeral species are known to occupy disturbance niches in numerous anthropogenic habitats (Kirkpatrick, 2007). However, exurban areas can also have significantly more exotic, and less native, species of plants than stock ranches (Maestas et al., 2003),
suggesting that native plants can benefit from stock that preferentially graze exotics. There are demonstrably substantial ecological implications of exurban
development, but not all implications are necessarily detrimental to biodiversity, or at least certain lifeforms. Exurban residents are largely positive towards wildlife and matters of nature conservation (Harrison, 1998; Woolcott Research, 2002), and have a strong awareness of potentially detrimental consequences of urbanisation, such as: the application of pesticides, the lack of suitable habitat, and the presence of
Introduction
17 and threatened species can survive in, and colonise, urban areas (Kirkpatrick et al., 1988; Dufty, 1994a; Ashworth, 1998; Pyke and White, 2001; Low, 2003; Kirkpatrick, 2007; Sorace and Gustin, 2010), and that private landowners want to do more for nature conservation, exurbia may provide significant opportunities for biodiversity conservation.
There are several questions that need to be addressed. How do the avifaunal and mammalian assemblages of Australian exurban landscapes compare to those that would have occupied the sclerophyll forests prior to development? Domestic mesopredators are evidently prevalent in exurbia – are they significantly influencing the distribution of exurban fauna? Can pet control mitigate their impacts? Can landowners affect exurban fauna through processes such as garden chemical application and habitat alteration? Do exurban ecologies vary between
sclerophyllous forest ecosystems at opposite ends of a precipitation gradient? How can exurban development be made more ecologically sustainable?
Thus, the present study will investigate the responses of flightless mammal and avifaunal communities to exurban development on the fringe of Hobart, Tasmania, Australia. As this is the first study of exurban wildlife ecology in the southern hemisphere, the null hypothesis is that exurban subdivision in Australia does not affect flightless mammal and avifaunal communities. It will provide comprehensive data on the distribution of fauna throughout exurban Hobart, and nature
Introduction
18
Thesis structure
Chapter two describes the exurban study area, including: the extent of land clearance and forest perforation; the major natural and anthropogenic vegetation communities; the location of representative wildland control sites; and the
methodology used in attaining permission to survey exurban properties. Chapter three documents variation in bird species assemblages due to exurbanisation, including the influences of habitat modification and variation, the presence of aggressive edge species, and the process of homogenisation.
Chapter four compares flightless mammal assemblages in exurbia to those in wildlands. The influence of exurban property and landscape characteristics are tested, and species adaptability to the exurban landscape is correlated with life history traits.
Chapter five explores sociological diversity among exurbanites and tests the influence of group attitudes and independent human activities on the distribution of wild exurban mammals.
19
Chapter 2
Study area - Exurban Hobart
The two areas chosen for study contain a large proportion of the exurban fringe of the city of Hobart, Tasmania, Australia. Area one is comprised of the neighbouring suburbs of Sandford and Clifton Beach on the South Arm Peninsula (hereafter referred to as ‘South Arm’), and area two the contiguous areas of Leslie Vale, Longley, Neika and Sandfly (hereafter referred to as ‘Kingborough’). South Arm is situated east of Hobart and receives between 300 and 600 mm of precipitation per annum. Kingborough is located south of Hobart, adjacent to, and partially
encompassing the slopes of, Mount Wellington. Mean precipitation in the area ranges between 800-1100 mm per annum.
Respectively, South Arm and Kingborough are located within the local
Exurban Hobart
20 constraints, and results in water and reserved lands being juxtaposed with both metropolitan and exurban regions.
South Arm constitutes an area of 5674 ha, of which, 1399.5 ha is covered by 728 residential properties at suburban or exurban densities. All the suburban properties within South Arm are located within two discrete clusters, a classic example of how the level of urbanisation is not linearly correlated with distance from city centre (Alberti et al., 2001). If the two discrete suburban zones are excluded, 1358.8 ha of South Arm is exurban and is comprised of 542 residential properties with a mean area of 2.51 ha.
Of the non-urban land in South Arm, of which there are 4274.5 ha,
approximately 1084 ha constitute forested wildland remnants, most of which are in two 300+ ha patches. Less than 50 ha of the wildland remnants are isolated by land clearance; the remainder are isolated not by land clearance, but by forested exurban properties. Thus, tree cover connectivity remains high, but heavily perforated and parcellated. In total, 37 % of South Arm remains forested, with close to 49 % of this occupied by exurban development (Figure 1). South Arm is isolated from extensive wildlands (> 500 ha) by suburban density development and the sea.
Exurban Hobart
[image:21.595.89.498.69.693.2]Exurban Hobart
23 Within the exurban study area, landowners residing on blocks between 2-4 hectares in size were approached through door knocking, and permission sought to
conduct field work on their property. While the sample of properties could not be
random, because of refusal and absences of owners when requesting access, there was
a high willingness among owners to allow data collection on their property. This
resulted in permission being granted to conduct work on an array of properties
representative of the local exurban landscape, ranging from completely cleared
properties, to houses embedded within forest. In total, the owners of 89 exurban
properties gave consent for research to be conducted, and stated their willingness to
complete the questionnaire.
Natural vegetation
Natural vegetation in both the South Arm and Kingborough areas predominately consists of forests dominated by Eucalyptus species. Because factors such as soil water-flow and solar radiation can influence forest community composition as much as precipitation (Kirkpatrick and Nunez, 1980), some forest types occur in both regions (Figure 3). However, the precipitation gradient is evident in the
Exurban Hobart
24 of scleromorphic and broad-leaved small trees and tall shrubs, as typically
[image:24.595.92.501.183.651.2]accompanies broad-leaved eucalypts in high rainfall regions (Kirkpatrick et al., 1994). South Arm forests have open understoreys variously dominated by scleromorphic shrubs or tussock graminoids.
Figure 3: A representative sample of some of the forest types found within exurban Kingborough and South
Arm. Top line: silver peppermint forests restricted to South Arm; Middle line: forest types found in both
Exurban Hobart
25
Habitat classifications
Throughout the thesis, a number of terrestrial and one aquatic habitat are referred to regularly. These are defined below. Because exurbia is a heterogeneous
landscape, wildlands is the only habitat type in which data collection sites were necessarily embedded within homogeneous areas. In addition, the scale at which an area is considered can influence its classification. Bird survey sites were 625 m2 and only the vegetation within that area necessarily conformed to the definitions below (see Chapter 3 for more details).
Wildlands
Wildlands refer to areas of undeveloped natural vegetation in large remnants (> 400 ha). Importantly, these are not wildland remnants within exurbia, like those
mentioned above, but are wildlands located away from any urban influence, and thus broadly representing the situation before forests were fragmented and
perforated. Wildland study sites corresponding to exurban forest types were located within: Coningham Nature Recreation Area, Meehan Range State Recreation Area, Wellington Park, and Woodvine Nature Reserve. Data collection within wildlands was conducted no less than 250 m from the forest edge, and a minimum of 500 m from any dwelling.
Exurban forest
Exurban Hobart
26 Modified forest
[image:26.595.91.506.336.652.2]Modified forests constitute exurban forests that have had between 25 and 100 % of their understorey vegetation modified structurally by clearance or ongoing periodic suppression (slashing, stock grazing). This understorey modification can result in the exposure of surface soil or the establishment of a grassy sward (Figure 4). Tree clearing is often evident, but not extensive, and often results in the broadening of the crowns of the remaining trees. Thus, canopy cover is comparable to that in corresponding wildland and exurban forests, but sometimes constitutes fewer individual trees, which further contributes to the openness of the understorey.
Figure 4: Types of forest modification in exurbia. Top line, left to right: exurban forest; modified forest in
foreground grading into exurban forest in the background. Bottom line, left to right: modified forest with
Exurban Hobart
27 Grassy woodland
Grassy woodlands are comprised of scattered indigenous trees (10 % coverage) from the genera Eucalyptus, Acacia and Allocasuarina, over a grassy sward.
Saltmarsh
Treeless vegetation dominated by succulent chenopods and aizoans.
Dune grassland
Treeless sand dune vegetation dominated by tussocks of Ammophila arenaria.
Paddocks
Paddocks are exurban sites largely devoid of woody vegetation (< 5 % total cover) (Figure 5). Paddocks have a dominant stratum < 60 cm in height comprised
predominately of self-sustaining grasses and herbs. Paddocks were subdivided into two classes, based largely on maintenance and the presence of non-grassy
graminoids.
Pasture paddock:regularly grazed or mowed paddocks with grassy swards typically less than 30 cm in height.
Rank grass / tussocky paddock:infrequently suppressed grassy thickets interspersed with clumps of rigid monocots from genera such as Lomandra, Gahnia and Juncus.
Gardens and lawn
Exurban Hobart
[image:28.595.91.496.99.407.2]28 Gardens are non-natural exurban sites created by the deliberate planting of ornamental and / or productive species of plants. Exurban gardens are generally located adjacent to a homestead. Bird survey sites within garden habitats often included an area of maintained lawn, but garden plants covered > 25 % of the survey area.
Figure 5: Exurban paddocks. Top line: pasture paddocks in foreground grading into grassy woodlands. Bottom
line, left to right: pasture paddock foreground, windbreak in middle-ground, hill in background includes
exurban forest on right, and modified forest on left; rank grass and tussocky paddock with forest in
Exurban Hobart
29 Thirteen garden types are found in the city of Hobart (Daniels, 2005; Daniels and Kirkpatrick, 2006a). For the present study the 13 garden types were grouped into five classes.
Mixed minimal input gardens: A mostly exotic garden community with intermediate levels of shrub and forb cover, and very low percentage of tree cover. Indicator species include Pittosporum spp. and Photinia glabra, Cotoneaster spp., Crocosmia crocosmiiflora and Lunaria annua. Native species are generally shrubs from the
genera Callistemon and Grevillea.
Showy flower gardens: A largely exotic, speciose, herbaceous garden type. Infrequently includes small evergreen trees, but uniformly includes spectacular flowering perennials and annuals. Indicator species include: Alonsoa warscewiczii, Chrysanthemum grandiflorum, Coleonema pulchrum, Gazania spp., Drosanthemum
candens, Cotyledon orbiculata, Festuca glauca, Heuchera spp., Mimulus spp.,
Cymbalaria muralis, Kalanchoe spp. and Lithodora diffusa.
Native gardens: A species rich Australian native garden with very few deciduous trees, high levels of native tree cover, and large proportions of shrub cover. Indicator species include: Baloskion tetraphyllus, Correa alba, Correa reflexa, Leptospermum scoparium, Prostanthera spp., Kunzea ambigua, Leptospermum lanigerum, local
Eucalyptus spp. and Pomaderris spp.
Productive gardens: An exotic garden type comprised predominantly of productive fruit bearing species and culinary herbs. Indicators species include Solanum
Exurban Hobart
30 Woodland gardens: A diverse garden type with high levels of deciduous tree cover and a complex exotic understorey that is occasionally complemented with
productive plants such as tomatoes, brassicas, and globe artichokes. Indicator species include Acanthus mollis, Cyclamen spp., Acer spp., Magnolia spp., Philadelphus spp. and Garrya elliptica.
As well as the garden types also found in suburban Hobart, the exurban fringe contains anthropogenic habitats that do not occur in suburbia: orchards and shelter-belts.
Orchard: A collection of variously spaced large shrubs / small trees that produce a
harvest of edible fruits or nuts. Exurban orchards generally include species of the genera Malus and Prunus, and less frequently include Cydonia oblonga, Ficus carica and Pyrus communis, but plantings including many more species could also be classified as orchards (e.g. Castanea sativa, Morus spp., Olea europea). Apart from the occasional companion plant, orchard understoreys are largely devoid of non-grassy species, and are frequently mulched to deter understorey vascular vegetation growth (as well as to maintain moisture). This impoverished understorey separates orchards from the productive garden types outlined above, which can include the full complement of fruit-bearing species found in orchards.
Exurban Hobart
31 Dams
The terrestrial exurban landscape is perforated with numerous anthropogenic water-bodies variously referred to as ‘ponds’ or ‘dams’. Although pond is probably the most appropriate terminology, as exurban water-bodies are essentially small lakes, rather than impoundments, or impediments to water flow, they are referred to as dams throughout the entire thesis, as this is the name used by local people, and also avoids confusion with the occasional tiny water-bodies placed within gardens to attract frogs, which are universally referred to as ponds. Throughout the thesis, any water-body referred to as a dam conforms to the following definition: an earth-based anthropogenically created depression that periodically, or permanently, holds water and has a width or diameter in excess of 2 m and a down-slope earth wall between 0 cm and 2 m high. Dams that remained permanently dry throughout the course of the study were not included in any dam analyses.
Chapter 3
Avifaunal responses to exurbanisation
Introduction
Altered faunal and floral species composition are a logical consequence of urbanisation and exurbanisation (Odell and Knight, 2001; Maestas et al., 2002; Adams, 2005; Bock et al., 2006a; McKinney, 2006; Bock et al., 2008). Urban areas typically support species-poor avifaunal communities (Marzluff, 2001; Chace and Walsh, 2006). However, exurban bird species communities can be at least as rich (Nilon et al., 1995), or richer than, wildland communities (Bock et al., 2008), and, in some cases, can even harbour more species of conservation concern (Haskell et al., 2006). Exurban landscapes are typically heterogeneous (Nilon et al., 1995; Hansen and Rotella, 2002; Haskell et al., 2006; Bock et al., 2008). High biodiversity results from habitat heterogeneity at a variety of spatial scales (Law and Dickman, 1998; Pickett et al., 2001; Benton et al., 2003; Marzluff, 2005; Mayfield and Daily, 2005). Thus, exurban heterogeneity is thought to enable disturbance-sensitive and
disturbance-adapted species to co-exist (Odell and Knight, 2001; Lenth et al., 2006), which results in a diverse avifauna and non-uniform bird species assemblages across the wildlands – exurban interface (Haskell et al., 2006).
Exurban avifauna
33 heterogeneity is controlled for, at least at the local scale, exurban bird communities in the USA are still generally discrete from wildland communities. Broadly, these exurban habitats harbour fewer forest migrants (Nilon et al., 1995; Merenlender et al., 2009) and songbirds (Odell and Knight, 2001), and higher abundances of certain
nest predators or parasites (Nilon et al., 1995; Hansen and Rotella, 2002), than representative wildlands.
Avifaunas within Australian exurban landscapes have not been studied. Exurbanisation could affect Australian avifauna differently than American avifauna, because biotic responses to exurbanisation vary between ecoregions (Hansen et al., 2005; Bock et al., 2007) and Neotropical migrants are particularly vulnerable to forest fragmentation (Ambuel and Temple, 1983; Lynch and Whigham, 1984; Blake, 1991). Comparisons with suburban Australia, however, reveal similar shifts in species composition as those observed in exurban USA, such that Australian suburban bird communities are distinct from those observed in wildlands (Munyenyembe et al., 1989; Parsons et al., 2003) and in forest remnants within an urban matrix (Jones, 1981; Catterall et al., 1989; Wood, 1996; White et al., 2005; Iijima, 2009).
Exurban avifauna
34 assemblages significantly different to those observed in wildlands. Specifically, Australian suburban bird communities have proportionally fewer small-bodied insectivores and nectivores, more exotics, and more medium-to-large-bodied generalists and nectivores (Jones, 1981; Green, 1986; Wood, 1996; Sewell and Catterall, 1998; Parsons et al., 2003; White et al., 2005).
Some large-bodied Australian-native synanthropes, the noisy miner in particular, are interspecifically aggressive, which potentially confounds the
identification of causal relationships between urbanisation and bird communities. Noisy miners, which consistently co-occur with other edge species, such as
Australian magpies, rosellas, grey butcherbirds and lorikeets (Catterall, 2004), alter the composition of bird species communities even in non-urban habitats by
aggressively excluding smaller-bodied species from their territory (Dow, 1977; Grey et al., 1997; Grey et al., 1998; MacDonald and Kirkpatrick, 2003; Maron, 2009) and
predating their nests (Piper and Catterall, 2004).
Exurban avifauna
35 Natural habitat for noisy miners and their cohort is dry open eucalypt
woodland, because it is more difficult to exclude other species from structurally complex vegetation (Dow, 1977; Maron, 2009). They also favour forest remnants with high perimeter-to-area ratios (Catterall et al., 1997; MacDonald and Kirkpatrick, 2003; Catterall, 2004). Typically, miners occupy urban habitats when suburban vegetation physiognomically resembles natural habitat, such as grassy suburbs with a largely retained indigenous canopy (Sewell and Catterall, 1998), or when suburbs are proximal to the coast and / or small remnants of natural habitat (Green, 1986; Parsons et al., 2003; Parsons and Major, 2004; White et al., 2005; Daniels and Kirkpatrick, 2006b). In addition, anecdotal evidence suggests that perforation of dry woodland habitat for residential housing creates points of invasion for miners (Dow, 1977). This is supported by the finding that picnic area perforations are occupied by noisy miners and their cohort (Piper and Catterall, 2006). Thus, the coastal location, the extent of forest perforation, and the dry open vegetation, make South Arm inherently suitable for edge species. As a result, bird assemblages in South Arm were predicted to be distinct from wildland assemblages.
Edge species were expected to be present at significantly lower densities in the relatively dense inland forests of exurban Kingborough. The implications of
exurbanisation on avifauna are less apparent in areas without edge species.
Exurban avifauna
36 pardalotes, satin flycatchers, yellow-throated honeyeater and the Tasmanian
scrubwren (Jones, 1981; Green, 1986; Ford and Barrett, 1995; Wood, 1996; Catterall et al., 1998; Catterall, 2004; White et al., 2005; Piper and Catterall, 2006; Iijima,
2009). It is generally accepted that urban areas lack the necessary complex understorey vegetation to support these species (Garden et al., 2006).
Exurbanisation is suspected to have less impact on biodiversity than traditional forms of urban development (Marzluff, 2001), because exurbia intrinsically differs from suburbia in the extent of remaining natural habitat and lower housing density, which enables disturbance-sensitive species to occupy exurbia (Odell and Knight, 2001; Bock et al., 2008). Nevertheless, the threshold of some species’ sensitivity to urban-associated disturbance and habitat alteration may be below even exurban levels, and thus, even in the absence of edge species, they may be out-competed by typical anthropophiles, resulting in lower species richness, greater bird abundance, and an assemblage of adaptable generalists, consistent with classic urban avifaunas (Beissinger and Osborne, 1982; Green, 1986; Catterall et al., 1989; Jokimaki and Suhonen, 1993; Clergeau et al., 1998; Melles et al., 2003).
An additional aspect of the changes to bird species composition that result from urbanisation, is bird community homogenisation between sites within habitats, between habitats within regions, and between habitats across regions.
Exurban avifauna
37 similarity between the communities of wildland or remnant sites (Parsons et al., 2003; White et al., 2005). Within suburbia, similarity between sites has been found to be highest in streetscapes with exotic vegetation, lower in recently developed streets largely devoid of woody vegetation, and lowest in streets with native vegetation (White et al., 2005). If this pattern is evident within exurbia, intersite similarity can be expected to be highest in gardens, lower in paddocks, and lowest in forest habitats.
While landscape characteristics determine the general location of noisy miner territories (Parsons and Major, 2004; Daniels and Kirkpatrick, 2006b; Parsons et al., 2006), within their territory, bird species assemblages can be uniform, despite typical variance in urban vegetation (Parsons et al., 2003). This suggests that miners patrol, and practice interspecific aggression in, local patches of sub-optimal habitat. Thus, bird species assemblages within South Arm habitats were expected to be more homogeneous than in Kingborough, and, potentially uniform, irrespective of habitat.
Exurban avifauna
38 similarity values. Thus, if managed habitats are more similar than non-managed habitats, gardens will be expected to have higher levels of regional similarity than paddocks, exurban forests, and wildlands.
The trend in regional similarity may reflect the proximal causes of avifaunal homogenisation. High regional similarity in gardens may suggest that the level of exposure to human activity is the proximal cause of homogenisation, due to garden proximity to houses. If the alteration of vegetation physiognomy is the proximal cause of avifaunal homogenisation, then regional similarities could be expected to increase along a gradient from wildlands and exurban forests through to paddocks, with modified forest and gardens potentially overlapping due to variable structural complexity in gardens in particular. If changes to the species composition of
vegetation are the proximal cause of regional homogenisation, then regional
similarities may not be evident at all within the current exurban study area, because the composition of exurban forests and paddocks are largely dependent on
environmental conditions, and exurban gardens in the South Arm region, despite being maintained to some extent, largely consist of drought hardy gardens (Kirkpatrick et al., 2007).
Exurban avifauna
39 assemblages and more homogeneous than regional exurban counterparts? (2) In a region without aggressive edge species, does exurbanisation alter forests to such an extent that anthropophiles displace urban-sensitive species, resulting in a typical urban avifauna, or does the low housing density and high tree cover in exurban estates enable wildland bird species assemblages to persist? (3) If bird species communities change in response to exurbanisation, are some species extirpated from the exurban landscape? (4) Does the exurban landscape contain non-uniform bird species assemblages that vary in accordance with habitat variation? (5) Are certain guilds of species particularly sensitive to exurbanisation or restricted to certain exurban habitats? (6) Are regional similarities higher in gardens than lesser-managed habitats? (7) Do levels of similarity between sites within habitats conform to patterns previously observed in suburban regions?
Methods
Bird survey sites and sampling
Exurban avifauna
40 because square shapes better fitted the shapes of exurban gardens and paddocks. Relatively small sized sampling plots (625 m2) were used as a way to ameliorate variations in bird detection probability between sites with varied structural complexity.
In addition to standardising through fixed-area, bird sampling was also
standardised through fixed-effort. Between the dates of 08/06/06, and 21/08/08, a total of seven 20-minute point count surveys were conducted at each site. Each site was surveyed four times during the morning period (dawn – 11 am), three times during the afternoon period (2:30 pm – dusk), twice during the southern hemisphere spring months (September – November), twice during the summer months
(December – February), once during the autumn months (March – May), and twice during the winter months (June – August). Bird surveys were not carried out in rain, or when wind was sufficient enough to be a potential hindrance to accurate
identification (Ratkowsky and Ratkowsky, 1979).
Exurban avifauna
41 to this procedure were occasions when it was unmistakable that an individual in the site was different to a prior recorded individual, such as when a prior recorded individual was still visible outside of the survey limits, or was morphologically distinctive due to sexual or age-related dimorphism.
The precise location from which the observer conducted the point count varied between sites, but remained constant within sites over time. Ideally the observer location maximised site visibility and minimised observer conspicuousness. In densely vegetated sites this tended to be a location immediately adjacent to, or within, the survey area, whereas in sparsely vegetated sites, the location was generally a short distance (20 m) away from the plot, preferably next to something that afforded the observer some level of concealment.
Active bird nests were noted when encountered, at any stage throughout the project, within the entire exurban study area or within any relevant vegetation community in the wildland locations. For each nest, bird species, nest plant species or structure, and nest location, were recorded.
Site vegetation and locale
Within each of the bird survey plots, the following site variables were documented:
Vascular plant species richness – all observable species were noted once
during summer (southern hemisphere) 2006 / 2007 and then ephemeral or geophyticspecies were added if encountered at other times, giving a
Exurban avifauna
42
The tallest plant, as well as the mean height of the tallest stratum with ≥ 20 %
cover was scored in the categories: 0 - 30 cm; 30 cm – 2 m; 2 m – 4 m; 4 – 8 m; 8 – 40 m.
Percentage cover of: evergreen trees (woody evergreen plants over 8 m in
height); deciduous trees (deciduous plants > 8 m in height); small trees (woody plants between 4 and 8 m in height) large shrubs (woody plants over 2 and less than 4 m in height); small shrubs (woody plants less than 2 m in height); grass; forbs; ferns and non-grassy graminoids collectively; artificial surfacing (concrete, small buildings, swimming pools, etc.); were recorded by visual estimation into the categories: 0 – 5 %, 5 – 10 %, 10 – 25 %, 25 – 50 %, 50 – 75 %, 75 – 100 %.
The presence of bird baths, chicken yards, domestic livestock, fencing and
supplementary food.
Substrate.
The habitat heterogeneity of the local matrix surrounding each bird survey plot was quantified by visually estimating the percentage of the surrounding area (to a distance of 100 m from the edge of the survey plot) covered by: forest (exurban and / or wildland), modified forest, trees (irrespective of understorey), and paddocks. Percentage covers for these surrounding habitats were estimated into the
Exurban avifauna
43 coastal habitat, which was mostly comprised of dune grassland, but also included beaches, rocks, and the ocean.
Other local and landscape variables were derived from topographic maps and aerial photos. These were: the distance to the nearest house; the number of houses with a 200 m radius from the centre of the site; the size of the forest patch in which forest sites were located; the size of the paddock patch in which paddocks were located; the distance to a wildland remnant > 100 ha in area.
Data analysis
Community ordination, classification and comparison
Differences in the bird species assemblages of habitats within and between regions were tested by analyses of similarity (ANOSIM) using Bray-Curtis similarity and 10 000 permutations in DECODA (Minchin, 2001). Communities were considered to be discrete if P = < 0.05 in a pairwise comparison, with r indicating the level of
separation. To support the ANOSIM tests, sites were also ordinated using non-metric multi-dimensional scaling with the default options in DECODA. The ordination
Exurban avifauna
44 Gorley, 2000). All of the above tests used untransformed bird frequency of
occurrence (per site) data.
Independent variables
All data derived from the assessments of bird survey site vegetation and locations were converted to binomial class variables for analysis. The only exception to this was plant species richness, which remained continuous. Binary variables enabled the use of broad habitat categories that could be assessed by eye in the field. In many cases the distribution of data for independent variables that were recorded as continuous were heaped into a small number of classes anyway, meaning that data classes had to be conflated in order to increase sample size. Each independent variable is listed and defined in Appendix A.
Unfortunately, as much of the data relating to exurban management
techniques was attained from the print survey (Chapter 5), it could only be applied to property level analyses, rather than the site level analyses in this chapter. This
includes variables relating to domestic predator activity and management. Domestic predators were recorded within bird survey sites during observations, but
quantitative measures of predator presence could not be included in analyses, because often the cats and dogs were only in the site area because they followed the observer there.
Response variable relationships
Exurban avifauna
45 plot attributes and the likelihood of individual bird species being recorded at a given site in at least one of the seven surveys, Pearson’s Chi-square or Fisher’s Exact Probability Test were used for attributes treated as class variables and One-Way ANOVA for continuous variables. In all cases a level of P < 0.05 was taken to denote a significant relationship.
Response variable predictors
Correlations between plot attributes and individual bird species abundances, as well as total, native and exotic bird abundance, and total, native and exotic bird species richness were tested using One-Way ANOVA for class variables and Pearson’s Product Moment Correlation for continuous variables. As an exploratory process, each variable significantly correlated with any given bird species or bird group was entered into a best subsets regression analysis in Minitab. A best subsets analysis produces regressions models using between 1 and x independent variables (with x equalling the total number of independent variables entered into the best subsets analysis) and indicates the two most explanatory regression models possible using each number of independent variables between 1 and x (i.e. the total number of regression models that result from each best subset analysis = 2x). These models were tested using general linear modelling, with continuous variables as covariates. The model with the highest adjusted R2 was accepted if all components of the model were significant and the residuals had a normal (or at least approximately normal) distribution, as shown in histogram. If this was not the case, the next most
Exurban avifauna
46 satisfied these requirements (i.e. univariate models were considered redundant in light of other univariate analyses, and were thus disregarded).
Correlated independent variables
The relationships between all independent variables were explored using Pearson’s x2, Fishers Exact Probability Test, and One-Way ANOVA (Appendix B, Appendix C).
Results
Habitat variation
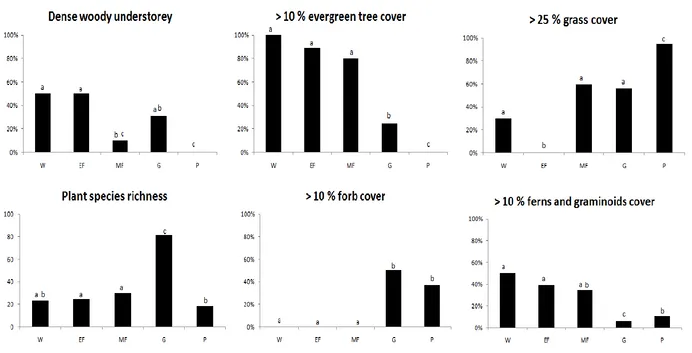
Canopy cover, understorey density, grass, forb and graminoid cover, and plant species richness, best defined the habitat types in each region (Figure 6, Figure 7).
Avifaunal variation
Figure 6: Mean plot plant species richness and the percentage of wildland (W), exurban forest (EF), modified forest (MF), garden (G) and paddock (P) plots in Kingborough that met the
Figure 7: Mean plot plant species richness and the percentage of wildland (W), exurban forest (EF), modified forest (MF), garden (G) and paddock (P) plots in South Arm that met the
Exurban avifauna
49 The four exotic exurban specialists were the European goldfinch, common blackbird, common starling and house sparrow. The latter three were all recorded nesting in exurbia. Exotic species were not recorded nesting in native plants or wildlands. More nests were located in gardens than any other exurban habitat. Tasmanian native trees were the most common nest sites within exurbia and overall.
Overall, the bird species assemblages that inhabited each exurban region did not significantly differ from the wildland assemblages, even with the inclusion of exotic species and despite the presence of edge species (Table 1). However, such a broad comparison is misleading, as exurban habitats were not sampled in direct proportion to their total exurban distribution.
All species Native species only
R P R P
Wildlands – Exurban Kingborough 0.0907 0.1700 0.0797 0.2026 Wildlands – Exurban South Arm 0.0596 0.2007 0.0609 0.2056
When treated singly, gardens and paddocks harboured bird communities that were discrete from those in wildlands (Table 2). However, the differences between the bird species communities in wildlands and exurban and modified forests
remained not significant, but only marginally so for modified forests. Thus, wildland assemblages can inhabit an urban matrix, but forest disturbance must be minimal.
Within each region, the bird species assemblages of modified forest and
Exurban avifauna
50 significantly different, suggesting a level of homogenisation due to the presence of noisy miners.
All species Native species only
Region and paired habitats R P R P
Kingborough
Wildlands – Exurban forest 0.0049 0.4350 -0.0015 0.4648 Wildlands – Modified forest 0.1535 0.0551 0.1465 0.0587 Wildlands – Gardens 0.5267 0.0000 0.4908 0.0000 Wildlands – Paddocks 0.4170 0.0000 0.3636 0.0000
South Arm
Wildlands – Exurban forest 0.0909 0.1156 0.0918 0.1142 Wildlands – Modified forest 0.1114 0.0822 0.1120 0.0755 Wildlands – Gardens 0.3916 0.0001 0.3182 0.0018 Wildlands – Paddocks 0.3388 0.0004 0.3230 0.0004
All species Native species only
Region and paired habitats R P R P
Kingborough
Exurban forest – Modified forest 0.0098 0.3434 0.0035 0.4172 Exurban forest – Gardens 0.3370 0.0000 0.2958 0.0000 Exurban forest – Paddocks 0.4595 0.0000 0.4416 0.0000 Modified forest – Gardens 0.1362 0.0029 0.1295 0.0029 Modified forest – Paddocks 0.3526 0.0000 0.3503 0.0000
Gardens – Paddocks 0.3788 0.0000 0.3847 0.0000
South Arm
Exurban forest – Modified forest 0.0084 0.3052 0.0065 0.3304 Exurban forest – Gardens 0.2659 0.0006 0.2179 0.0020 Exurban forest – Paddocks 0.3398 0.0001 0.3250 0.0000 Modified forest – Gardens 0.0917 0.0421 0.0505 0.1083 Modified forest – Paddocks 0.2410 0.0000 0.2360 0.0004
Gardens – Paddocks 0.1515 0.0063 0.1247 0.0117
[image:50.595.85.492.413.639.2]There were no significant regional similarities in the bird communities within any given habitat type (Table 4). Thus, the study area on the whole, exurbia and wildlands inclusive, can be considered to be comprised of three distinct bird species Table 2: Analysis of similarity between the bird species assemblages of wildlands and individual exurban
habitats within each region
Exurban avifauna
51 assemblages, forest birds, which inhabit wildlands, exurban forest and modified forest, garden birds, and paddock birds, with the composition of each also varying between regions (Figure 8).
All species Native species only
R P R P
Wildlands 0.1179 0.0366 0.1179 0.0366
Exurban forest 0.1964 0.0003 0.1926 0.0001
Modified forest 0.1831 0.0004 0.1797 0.0001
Gardens 0.2877 0.0000 0.3126 0.0000
Paddocks 0.0886 0.0350 0.0843 0.0424
Regional dissimilarity in the bird species composition of habitats was highest in paddocks, lower in forests, and lowest in gardens (Table 5). The superb fairy-wren was the only species to make a large contribution (> 5 %) to the total regional
dissimilarity within every habitat type. In all habitats it was more frequently recorded in the Kingborough region. Brown thornbills and New Holland honeyeaters
contributed to > 5 % of the regional dissimilarity in two habitat types each, and were uniformly more frequently recorded in Kingborough. Noisy miners, scarlet robins and little wattlebirds made large contributions to regional dissimilarities on account of their relatively high frequencies of occurrence in South Arm.
Exurban avifauna
[image:52.595.85.437.66.694.2]Intersite similarity (% contribution) a Inter-regional habitat
dissimilarity (% contribution) a b
Regional interhabitat dissimilarity (% contribution) a b
KF KG KP SF SG SP KFvSF KGvSG KPvSP KFvKG KFvKP KGvKP SFvSG SFvSP SGvSP
Brown thornbill 16.42 13.54 5.89 K 5.78 K 5.29 F 6.84 F 4.72 G
Black-headed honeyeater 4.13 S
Common blackbird 5.42 K 5.39 G 6.07 G
Crescent honeyeater 4.26 F
Grey fantail 11.56 5.02 K 4.32 F 5.59 F
House sparrow 7.18 S 5.09 G 6.24 G 6.28 G 7.66 G
Little wattle bird 11.91 6.24 S 7.28 G 8.73 G
Masked lapwing 8.34 K 3.86 P
[image:53.842.64.814.169.497.2]New Holland honeyeater 5.93 K 9.40 K 10.05 G 6.49 F 12.93 G 5.91 G 5.48 G
Table 5: The percentage contribution of species that contribute to the top 40% of mean intersite similarity within habitats and mean dissimilarity between paired habitats between and
Intersite similarity (% contribution) a Inter-regional habitat
dissimilarity (% contribution) a b
Regional interhabitat dissimilarity (% contribution) a b
KF KG KP SF SG SP KFvSF KGvSG KPvSP KFvKG KFvKP KGvKP SFvSG SFvSP SGvSP
Noisy miner 8.32 16.64 5.50 S 5.05 S 8.11 G 8.37 F 8.17 G
Scarlet robin 4.00 S 5.65 S 5.05 F
Spotted pardalote 9.75 4.51 F
Striated pardalote 10.95 4.70 F
Superb fairy-wren 11.02 30.04 34.23 15.02 5.69 K 9.69 K 12.66 K 10.62 G 7.83 P 12.32 G 6.98 G 6.42 P 8.83 G
Welcome swallow 32.29 8.02 S 5.11 P 4.82 G
Yellow-throated honeyeater 9.76 17.00 6.66 S 5.51 F 6.34 F 7.82 F
Total 30.14 41..91 23.44 24.27 25.98 17.74 77.06 74.48 82.02 70.96 82.91 77.35 81.29 87.81 83.58
a
K = Kingborough; S = South Arm; F = Forests; G = Gardens; P = Paddocks
b
Exurban avifauna
[image:55.595.100.469.98.632.2]55 Figure 9: The distribution of noisy miners at South Arm sites in relation to forest (shaded) and house
Exurban avifauna
56 in which miners were present are considered, then all South Arm exurban habitats harbour bird assemblages discrete from the wildlands assemblage (Table 6). The presence of noisy miners also influences the differences between the bird communities of different exurban habitats. Within their exurban territory noisy miners homogenised bird species assemblages across all habitats except paddocks (Table 6, Figure 10). Sites in which miners were recorded frequently (> 14 %
frequency of occurrence) had strikingly similar bird species compositions (Figure 11).
All species
Region and paired habitats R P
South Arm
Wildlands – Exurban forest 0.8941 0.0009 Wildlands – Modified forest 0.6498 0.0000
Wildlands – Gardens 0.5662 0.0000
Wildlands – Paddocks 0.8350 0.0001
Exurban forest – Modified forest -0.1362 0.7734 Exurban forest – Gardens 0.2025 0.0838 Exurban forest – Paddocks 0.6726 0.0049 Modified forest – Gardens 0.0484 0.2233 Modified forest – Paddocks 0.3816 0.0048
Gardens – Paddocks 0.2525 0.0276
Despite regional bird community dissimilarity, there were similar regional patterns of bird species richness and abundance across habitats, even with the inclusion of miner sites (Figure 12). In each region, total species richness was highest in gardens, but not significantly higher than in forests. Native species richness
peaked in forests, but was not significantly higher than in gardens. Exotic species richness peaked in gardens, but was not significantly higher than in paddocks. Total bird abundance was significantly higher in gardens than either forests or paddocks.
Table 6: Analysis of similarity between the bird species assemblages of
wildlands and South Arm sites with noisy miners, as well as analysis of
Exurban avifauna
57 Native bird abundance also peaked in gardens, but was not significantly higher than in native bird abundance in forests.
In each region, levels of intersite similarity within habitats were highest in gardens, lower in forests, and lowest in paddocks (Table 5). In terms of regional interhabitat dissimilarity, paddocks and forests were more dissimilar to each other than forests and gardens, or gardens and paddocks (Table 5). Forests and gardens were less dissimilar than any other pair of habitats. Levels of intersite similarity within habitats, and interhabitat similarity within a region, were uniformly lower in South Arm, due to the contrast between sites with and without noisy miners in that region (Table 5). Abundant and widely distributed species such as the superb fairy-wren made large contributions to the overall levels of intersite similarity, and habitat dissimilarities. However, species that made large similarity contributions to only one habitat type characterise habitats best (Table 5). Kingborough forests were thus characterised by high frequencies of crescent honeyeaters, grey fantails and yellow-throated honeyeaters. Kingborough gardens were typified by high frequencies of common blackbirds, silvereyes and New Holland honeyeaters, and Kingborough paddocks by the presence of masked lapwings.
Despite the regional dominance of noisy miners, South Arm forests on the whole typically had a number of small native birds, such as brown thornbills, scarlet robins, striated pardalotes, spotted pardalotes, and yellow-throated honeyeaters; however, only the latter three contributed at least as much as the noisy miner to the overall intersite similarity within South Arm forests (Table 5).
Exurban avifauna
58 Figure 10: Three-dimensional distribution of the bird species assemblages of South Arm
habitats with and without miners. 1 = forests with miners; 2 = forests without miners; 3 =
gardens with miners; 4 = gardens without miners; 5 = paddocks with miners; 6 = paddocks
Exurban avifauna
59 Figure 11: Three-dimensional distribution of the bird species assemblages of South Arm sites,
Figure 12: Mean site A) species richness, and B) abundance for forest (F), garden (G) and paddock (P) habitats in 1) Kingborough and 2) South Arm. Crosshairs indicate mean. Shared
letters indicate that means values do not significantly differ. Boxes contain 25 % of the observations on either side of the median, which is the middle horizontal line. Whiskers indicate
Exurban avifauna
61 Thus, bird species can be classified by the exurban habitats that they most frequent. Several species differed significantly in their frequencies of occurrence between habitats within regions (Table 7, Table 8). Some species displayed the same preference in each region, making them classic habitat specialists, and some species displayed a significant habitat preference in one region only, making them regional specialists. Species that displayed significant habitat preferences are thus classified into three classes: forest specialists, garden specialists, and paddock specialists, and each class has a subset of regional specialists (Table 9).
Forest Garden Paddock x2 P
Black-headed honeyeater 11.08 5.88 0.89 12.808 0.002
Brown thornbill 22.74 15.97 8.04 12.749 0.002
Common blackbird 7.00 25.21 6.25 33.663 0.000
Crescent honeyeater 12.83 15.13 0.00 17.335 0.000 Eastern spinebill 8.45 12.61 0.89 11.401 0.003
European goldfinch 2.62 8.40 1.79 9.757 0.008
Golden whistler 5.54 2.52 0.00 7.730 0.021
Green rosella 5.83 9.24 0.89 7.750 0.021
Grey fantail 18.95 13.45 3.57 16.050 0.000
House sparrow 0.58 23.53 8.04 73.795 0.000
Masked lapwing 0.58 0.00 8.93 31.934 0.000
New Holland honeyeater 17.20 47.90 10.71 58.830 0.000
Satin flycatcher 2.92 0.00 0.00 6.854 0.032
Silvereye 9.62 15.97 1.79 13.659 0.001
Spotted pardalote 7.00 4.20 0.89 6.670 0.036
Striated pardalote 8.45 2.52 0.00 14.125 0.001 Strong-billed honeyeater 6.41 4.20 0.00 7.833 0.020 Superb fairy-wren 20.41 57.14 21.43 62.023 0.000 Tasmanian scrubwren 9.91 1.68 0.89 17.043 0.000 Tasmanian thornbill 7.29 5.04 0.00 8.817 0.012
Welcome swallow 3.50 15.13 8.04 19.200 0.000
[image:61.595.84.491.371.711.2]Yellow-rumped thornbill 0.29 1.68 3.57 7.805 0.020 Yellow-throated honeyeater 16.33 11.76 3.57 12.402 0.002 Table 7: Species that differed significantly in their percentage frequencies of occurrence between Kingborough
habitats. Bold values indicate the habitat in which each species had the highest percentage frequency of
Exurban avifauna
62 Forest Garden Paddock x2 P
Australian magpie 2.68 7.14 1.50 6.994 0.030
Black-headed honeyeater 11.61 3.57 0.00 20.940 0.000
Common blackbird 0.01 16.96 0.75 66.140 0.000
Common greenfinch 0.00 3.57 2.26 7.610 0.022
Common starling 0.60 8.04 3.76 18.016 0.000
Eastern rosella 3.27 5.36 0.00 6.483 0.039
Golden whistler 4.17 0.000 1.50 6.452 0.040
Green rosella 7.14 11.61 0.00 14.671 0.001
Grey fantail 10.42 3.57 4.51 8.033 0.018
House sparrow 1.19 29.46 5.26 97.249 0.000
Little wattlebird 3.57 30.36 3.01 83.499 0.000
Masked lapwing 0.00 0.89 6.77 26.357 0.000
New Holland honeyeater 13.10 18.75 1.50 19.635 0.000
Noisy miner 14.88 17.86 5.26 10.225 0.006
Spotted pardalote 13.10 7.14 0.75 18.167 0.000 Striated pardalote 12.20 7.14 0.75 16.887 0.000 Superb fairy-wren 12.50 31.25 13.53 23.363 0.000 Tasmanian native-hen 0.00 4.46 7.52 23.372 0.000
Welcome swallow 4.46 12.78 4.49 12.906 0.002
Yellow-throated honeyeater 21.73 8.93 3.01 30.983 0.000
[image:62.595.83.490.122.418.2]Eleven species were forest or regional forest specialists. All of these forest species were small native insectivores. Sixteen species were garden or regional garden specialists. Garden species were also mostly small, but included five medium or large species. Garden species comprised a greater mix of feeding guilds. Only three of the garden species are primarily insectivores. Four are omnivores, four are nectivores, and five are granivores. Some species were too rare to be analysed for variation in habitat use, but can tentatively be considered habitat specialists as they were restricted to a single habitat type (Table 10). Fifty-percent of forest restricted species were insectivores and 28.5 % were medium to large carnivores.
Table 8: Species that differed significantly in their percentage frequencies of occurrence between South Arm