Tasmanian Institute of Agriculture
Effect of soil moisture availability and nitrogen
source on nitrogen-use efficiency in cereals
By
Eseeri Kisaakye
BSc. Agric. (Hons), (Makerere University, Kampala, Uganda); MSc. Crop Improvement,
(The University of Nottingham, United Kingdom)
Submitted in fulfilment of the requirements for the
Doctor of Philosophy (Agriculture)
Declarations
This thesis contains no material which has been accepted for a degree or diploma by the
University or any other institution and to the best of my knowledge contains no material
previously published or written by any other person, except where duly acknowledged in
the thesis.
Signature:
Eseeri Kisaakye
University of Tasmania
October, 2017
Authority of Access
This thesis may be made available for loan and limited copying and communication in
accordance with the Copyright Act 1968.
Signature:
Eseeri Kisaakye
University of Tasmania
Acknowledgements
My sincere gratitude goes to Associate Professor Tina Acuña, my Primary Supervisor, for
her guidance, knowledge, support and friendship, which she humbly and patiently gave me
throughout the course of my PhD research. I thank my Co-Supervisor, Dr Peter Johnson,
for his expertise, guidance and advice during my field experiments. Appreciation also goes
to my Co-Supervisor, Professor Sergey Shabala for his knowledge and guidance during
my laboratory studies and trusted level of efficiency, which was both reassuring and
inspiring.
I greatly appreciate the University of Tasmania for offering me the tuition fee scholarship
and the Grains Research and Development Corporation (GRDC) for the research funds
provided. To Phil Andrews of the Horticultural Research Centre, Tasmanian Institute of
Agriculture (TIA), University of Tasmania (UTAS), Brett Davey, Rob Howard and
Rebecca Fish of the Tasmanian Institute of Agriculture, Mount Pleasant, Dr Lana Shabala
of the Plant Physiology Laboratory, TIA, UTAS, Dr Alieta Eyles of the ARC Training
Centre for Innovative Horticultural Products, UTAS and Dr Cai Shengguan of Western
Sydney University, I am very grateful for the technical support provided. To Drs John
Roger Otto and Dinah Borus, many thanks for the unwavering friendship and support.
I am grateful to the Cressy Research and Demonstration Station, for allowing me to carry
out my field experiments at their Burlington Road site. I also acknowledge AgVita
Analytical in Devonport, Tasmania for analysing the soil samples and the Central Science
Laboratory (CSL) of the University of Tasmania for analysing the plant samples for
Special gratitude goes to my parents (Godfrey Kaaya and Justine Nakitto Kaaya) and
siblings (Mary Buttibwa, Joseph Ssempebwa, Milly Mirembe, Victoria Musasizi, Justine
Mwesigwa, John Mutegesi, Ruth Muwanguzi and Margaret Kuteesa), for their continuous
encouragement and support during my studies.
Finally, and most importantly, I would like to thank my husband (James Elvis Mbiru),
Abstract
Cereal nitrogen-use efficiency (NUE) in developed and developing countries stands at 42
and 29% respectively. In Australia wheat NUE stands at 41% with the remaining 59%
potentially contributing to environmental and health concerns. Processes such as ammonia
volatilization, nitrification, leaching, erosion, runoff and denitrification account for 92% of
nitrogen (N) loss from the plant-soil system. Achieving synchrony between N supply and
crop demand is key to optimizing trade-offs among yield, profit and environmental
protection in both large- and small-scale farming systems. Using enhanced-efficiency
fertilisers such as controlled-release fertilisers (CRFs) may be one option to obtain a
marked improvement in NUE in cereals. While soil moisture plays a significant role in
plant growth and development, excessive soil moisture can cause significant yield losses.
Waterlogging is a major abiotic constraint to cereal production in the high rainfall zones of
Australia, particularly in areas with duplex soils. Understanding how we can improve
cereal yield and NUE particularly under waterlogged conditions could help increase crop
productivity.
This research sought to address three key research questions namely: (a) can timing of N
application and source of applied N alleviate the adverse effects of waterlogging on wheat
and barley growth and physiology; (b) can CRFs improve wheat yield, NUE and their
components under waterlogged conditions; and (c) is the uptake of NH4+ along the root
axis of selected wheat and barley varieties under hypoxia significantly higher than NO3-?
These questions were answered through studies under glasshouse and field conditions as
well as laboratory experiments.
Under glasshouse conditions, identified waterlogging sensitive wheat (cv. Mackellar) and
waterlogged for 35 days and allowed to recover for another 35 days. During the study, leaf
chlorophyll content and chlorophyll fluorescence were recorded on a weekly basis. Tiller
number, green leaf area, above-ground dry matter (AGDM) and root DM were determined
after waterlogging and recovery. In the field, the experiment was designed as a split-plot
with irrigation regime and N fertiliser application as main-plot and subplot factors with
three replicates. The irrigation regime included: rainfed, irrigated and waterlogged while N
fertiliser application had nil N, single-applied urea, split-applied urea and CRF treatments.
Nitrogen fertiliser was applied at a rate of 90 kg N/ha and piezometers were randomly
installed to monitor the depth of the water table. Wheat growth and yield attributes
including leaf area, leaf area index (LAI), tiller number, ear number, grain yield, AGDM,
thousand grain weight (TGW) and harvest index (HI) were determined at specific growth
stages namely: stem elongation (GS32), anthesis (GS61) and maturity (GS92). NUE, its
components: nitrogen uptake efficiency (NupE) and nitrogen utilisation efficiency (NutE),
N harvest index (NHI) and grain protein content (GPC) were also determined. Mapping
the uptake of NH4+, NO3- and H+ under hypoxia involved measurement of steady-state net
fluxes of NH4+, NO3- and H+ ions of wheat cv. Revenue and barley cv. Naso Nijo main
roots at different positions along the root axis using non-invasive microelectrode ion flux
estimation (MIFE) technique.
Under glasshouse conditions, the results showed that N fertiliser application improves leaf
chlorophyll content, tiller number, green leaf area, AGDM and root DM during
waterlogging and recovery. Differences between N treatments were evident with the CRF
having the highest amount of AGDM for both selected wheat and barley varieties.
Conventional urea on the other hand, improved wheat and barley growth at the start of
waterlogging and significantly during recovery as the remaining urea was top-dressed.
irrigation regime and N fertiliser application for tiller number (P = 0.013) and leaf area (P
= 0.014) at GS32. The AGDM per plant was significantly affected by irrigation regime (P
= 0.001) and N fertiliser application (P = 0.012) while AGDM per unit area was
significantly affected by the irrigation regime only (P = 0.001). At GS61, the irrigation
regime (P = 0.001) and N fertiliser application (P < 0.05) had a significant effect on the
tiller number, ear number and AGDM per plant. There was no significant interaction
between the irrigation regime and N fertiliser application (P > 0.05). At maturity, yield
attributes including tiller number, ear number and grain yield were significantly affected
by irrigation regime (P = 0.001) and N fertiliser application (P < 0.05). The CRF had the
highest grain yield for all irrigation regimes with 9.2 t/ha, 9.4 t/ha and 6.8 t/ha for the
rainfed, irrigated and waterlogged, respectively. The urea treatments had an average of 8
t/ha for both the rainfed and irrigated, and 5.3 t/ha for the waterlogged. NUE was
significantly affected by irrigation regime (P = 0.001) and N fertiliser application (P =
0.036). The waterlogged plants had the lowest NUE for all corresponding N treatments
under the rainfed and irrigated regimes. The CRF had the highest NUE for all irrigation
regimes. Under waterlogged conditions, the CRF improved NUE by 17% and 27% more
than single- and split- applied urea, respectively. No significant variations were observed
between N treatments for components of NUE, NHI or GPC for the rainfed and
waterlogged treatments. Laboratory studies showed that the uptake and efflux of NH4+ and
NO3- ions in wheat and barley varied significantly (P = 0.001) between different positions
along the root axis at 20 µM and 1 mM NH4NO3 during normoxia and hypoxia. Hypoxia
increased the uptake of NH4+ and NO3- for both wheat and barley and there was a
preference for NH4+ over NO3-. Genotypic differences between wheat and barley were
evident, with wheat having the highest uptake of both NH4+ and NO3- for the control and
It was concluded that N fertiliser application could alleviate the adverse effects of
waterlogging in cereals. Applying full amount of the required fertiliser at sowing helps
plants to withstand the adverse effects of transient and intermittent waterlogging through
enhanced vegetative growth. Top-dressing urea after waterlogging and the termination of
waterlogging to allow recovery enhances plant growth and development. Using CRFs may
improve cereal growth and NUE though there might be no significant yield advantage over
conventional urea to warrant investment. The findings also highlight the dynamic process
of N uptake during hypoxia, which is characterised by significant variations over relatively
short distances and periods of time. Hypoxic conditions also seem to trigger mechanisms
Refereed Conference Papers
Kisaakye, E, Acuña, TB, Johnson, P & Shabala, S 2014, 'Effect of water availability and nitrogen source on wheat growth and nitrogen-use efficiency', in Proceedings of the 8th Annual Graduate Research Conference, Sharing Excellence in Research (SEiR), 4th - 5th September, University of Tasmania, Sandy Bay, Australia.
Kisaakye, E, Acuña, TB, Johnson, P & Shabala, S 2015a, 'Can nitrogen fertilizer
application alleviate the adverse effects of waterlogging in wheat?', in Proceedings of the 9th International Wheat Conference, 20th - 25th September, The Four Seasons Hotel, Sydney, Australia.
Kisaakye, E, Acuña, TB, Johnson, P & Shabala, S 2015b, 'Effect of water availability and nitrogen source on wheat growth and nitrogen-use efficiency', in Proceedings of the 17th Australian Society of Agronomy Conference, 20th - 24th September, Wrest Point
Convention Centre, Hobart, Australia, pp. 1-4.
Kisaakye, E, Acuña, TB, Johnson, P & Shabala, S 2017, 'Improving wheat growth and nitrogen-use efficiency under waterlogged conditions', in Proceedings of the 18th
Table of Contents
Declarations ... i
Authority of Access ... i
Acknowledgements ... ii
Abstract ... iv
Refereed Conference Papers ... viii
Table of Contents ... ix
List of Figures ... xii
List of Tables ... xvi
List of Abbreviations ... xvi
Chapter One: General Introduction ... 1
1.1 Introduction ... 1
1.2 Thesis structure ... 6
Chapter Two: Literature Review ... 8
2.1 Introduction ... 8
2.2 Tasmanian climate ... 9
2.3 Cereal production in Tasmania ... 9
2.4 Nitrogen dynamics ... 9
2.4.1 Role of nitrogen fertiliser in cereal production ... 12
2.4.2 Timing and application of nitrogen fertilisers ... 13
2.4.3 Use of slow/controlled-release fertilisers in cereal production ... 16
2.5 Duplex soils ... 20
2.5.1 Waterlogging of duplex soils ... 21
2.5.2 Effect of waterlogging on cereal production ... 23
2.5.2.1 Effect of waterlogging on plant growth and development ... 24
2.5.2.2 Effect of waterlogging on NUE ... 28
2.5.3 Strategies to alleviate the adverse effects of waterlogging ... 31
2.6 Kinetics of nitrogen uptake in plants ... 35
2.6.1 Kinetics of NH4+ uptake in plants ... 36
2.6.2 Kinetics of NO3- uptake in plants ... 41
2.6.2.1 Molecular mechanisms mediating NO3- uptake in plants ... 42
2.7 Nitrogen uptake under hypoxia ... 46
2.7.1 Ammonium uptake under hypoxia ... 47
2.7.2 Nitrate uptake under hypoxia ... 47
2.7.3 The inhibitory effect of NH4+ on NO3- uptake in plants ... 48
2.8 Conclusions ... 50
Chapter Three: Can nitrogen fertiliser application alleviate the adverse effects of waterlogging in cereals? ... 53
3.1 Abstract ... 53
3.2 Introduction ... 54
3.3 Materials and methods ... 56
3.3.1 Location of the experiments ... 56
3.3.2 Experiment 1 ... 56
3.3.3 Experiment 2 ... 59
3.3.4 Data analysis ... 62
3.4 Results ... 62
3.4.1 Experiment 1 ... 62
3.4.2Experiment 2 ... 69
3.5 Discussion ... 80
3.6 Conclusion ... 82
Chapter Four: Effect of soil moisture availability and nitrogen source on wheat growth and nitrogen-use efficiency ... 84
4.1 Abstract ... 84
4.2 Introduction ... 85
4.3 Materials and methods ... 87
4.4 Results ... 93
4.5 Discussion ... 105
4.6 Conclusion ... 110
Chapter Five: Mapping ammonium (NH4+) and nitrate (NO3-) uptake under hypoxia in cereals ... 111
5.3 Materials and methods ... 114
5.3.1 Plant material and growth conditions ... 114
5.3.2 Experimental protocol for ion flux measurements under normoxia (control) .. 114
5.3.3 Ion flux measurements under hypoxia... 116
5.3.4 Data analysis ... 117
5.4 Results ... 117
5.4.1 Uptake of NH4+, NO3- and H+ ions in wheat cv. Revenue ... 117
5.4.1.1 Ammonium (NH4+) ... 117
5.4.1.2 Nitrate (NO3-) ... 119
5.4.1.3 Proton (H+) ... 120
5.4.2 Uptake of NH4+, NO3- and H+ ions in barley cv. Naso Nijo ... 121
5.4.2.1 Ammonium (NH4+) ... 121
5.4.2.2 Nitrate (NO3-) ... 123
5.4.2.2 Proton (H+) ... 124
5.5 Discussion ... 126
5.6 Conclusion ... 129
Chapter Six: General Discussion ... 130
6.1 Nitrogen uptake under hypoxic conditions ... 130
6.2 Role of N fertiliser application in ameliorating the adverse effects of waterlogging ... 131
6.3 Economic analysis of fertiliser use in broadacre cropping under different irrigation regimes ... 133
6.4 Conclusions and recommendations ... 135
List of Figures
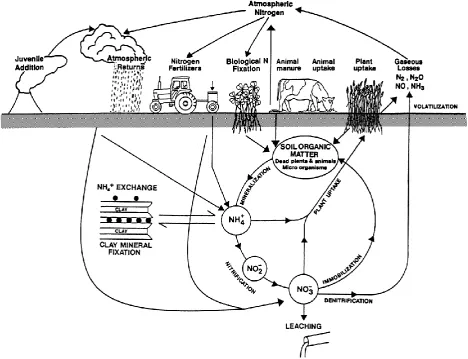
Figure 2.1: Nitrogen dynamics in the soil-plant system.Source: Di and Cameron
(2002). ... 12
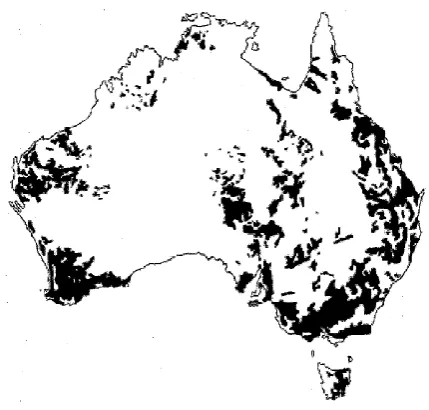
Figure 2.2: Distribution of duplex soils in Australia. Adapted from Chittleborough
(1992). ... 21
Figure 2.3: Distribution of Sodosols in Tasmania. Adapted from Cotching et al.
(2009). ... 21
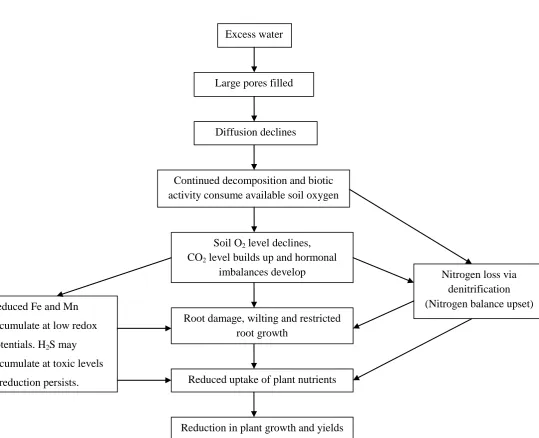
Figure 2.4: Summary of processes leading to reduction in plant growth and yields due
to waterlogging. Adapted from Evans et al. (1999). ... 28
Figure 2.5: Schematic diagram showing morphological and metabolic adaptive traits
for waterlogging in wheat. Adapted from Hossain and Uddin (2011), where SS:
sucrose synthase, ROL: Radial Oxygen Loss. ... 35
Figure 2.6: Phylogenetic tree of ammonium transporters of the AMT/MEP gene family
in yeast (Saccharomyces cerevisiae [Sc]) and plants (Arabidopsis thaliana [At],
Lycopersicon esculentum [Le], Oryza sativa [Os], Brassica napus [Bn] and
Nepenthes alata [Na]). Adapted from Ludewig et al. (2007); von Wirén et al.
(2000). ... 40
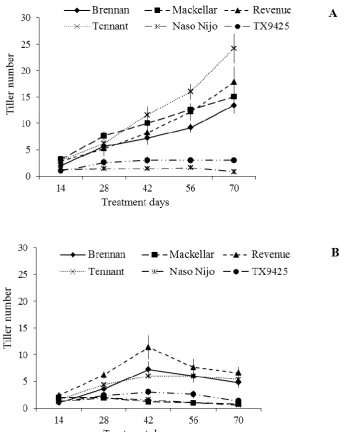
Figure 3.1: Tiller number of the different wheat and barley varieties for the control
(A) and waterlogged (B) treatments. Bars indicate the s.e. (n = 5). ... 64
Figure 3.2: Number of green leaves for the different wheat and barley varieties for the
Figure 3.3: Leaf chlorophyll content for the different wheat and barley varieties for the
control (A) and waterlogged (B) treatments. Bars indicate the s.e. (n = 5). ... 67
Figure 3.4: Number of dead leaves for the different wheat and barley varieties for the
control (A) and waterlogged (B) treatments. Bars indicate the s.e. (n = 5). ... 68
Figure 3.5: Above-ground DM of the different wheat and barley varieties at final
harvest. Bars indicate the s.e. (n = 5). ... 69
Figure 3.6: Leaf chlorophyll content of wheat cv. Mackellar under waterlogging and
recovery. Bars indicate the s.e. (n = 5). ... 71
Figure 3.7: Leaf chlorophyll content of barley cv. Naso Nijo under waterlogging and
recovery. Bars indicate the s.e. (n = 5). ... 71
Figure 3.8: Tiller number of wheat cv. Mackellar and barley cv. Naso Nijo under
waterlogging (A) and recovery (B). Bars indicate the s.e. (n = 5). ... 73
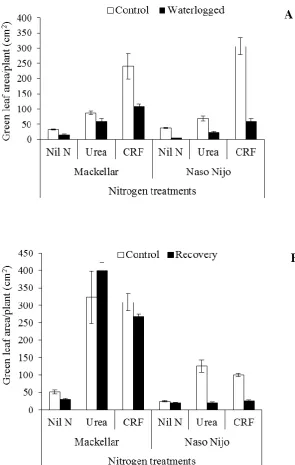
Figure 3.9: Green leaf area of wheat cv. Mackellar and barley cv. Naso Nijo under
waterlogging (A) and recovery (B). Bars indicate the s.e. (n = 5). ... 75
Figure 3.10: Above-ground DM of wheat cv. Mackellar and barley cv. Naso Nijo
under waterlogging (A) and recovery (B). Bars indicate the s.e. (n = 5). ... 77
Figure 3.11: Root DM of wheat cv. Mackellar and barley cv. Naso Nijo under
waterlogging. Bars indicate the s.e. (n = 5). ... 79
Figure 4.1: Rainfall and temperature at Cressy Research and Demonstration Station
Figure 4.2: Depth of water from the surface during waterlogging. Bars indicate s.e. (n
= 3). ... 93
Figure 4.3: Average tiller number per plant for the different nitrogen treatments under
different irrigation regimes at GS32 at Cressy Research and Demonstration Station
in 2014 (P = 0.013). Bars indicate s.e. (n = 3). ... 95
Figure 4.4: Average tiller number per m2 for the different nitrogen treatments under
different irrigation regimes at GS32 at Cressy Research and Demonstration Station
in 2014 (P = 0.013). Bars indicate s.e. (n = 3). ... 95
Figure 4.5: Average leaf area per plant for the different nitrogen treatments under
different irrigation regimes at GS32 at Cressy Research and Demonstration Station
in 2014 (P = 0.014). Bars indicate s.e. (n = 3). ... 96
Figure 4.6: Average LAI for the different nitrogen treatments under different irrigation
regimes at GS32 at Cressy Research and Demonstration Station in 2014 (P =
0.014). Bars indicate s.e. (n = 3). ... 96
Figure 4.7: AGDM per unit area for the different nitrogen treatments under different
irrigation regimes at anthesis (GS61) at Cressy Research and Demonstration
Station in 2014 (P = 0.03). Bars indicate s.e. (n = 3). ... 99
Figure 4.8: Harvest index (HI) for the different nitrogen treatments under different
irrigation regimes at maturity (GS92) at Cressy Research and Demonstration
Figure 4.9: Thousand grain weight (TGW) for the different nitrogen treatments under
different irrigation regimes at maturity (GS92) at Cressy Research and
Demonstration Station in 2014 (P = 0.03). Bars indicate s.e. (n = 3). ... 104
Figure 5.1: NH4+ uptake in wheat cv. Revenue under normoxia and hypoxia. Bars
indicate s.e. (n = 5 individual plants). Note that in some cases, the bars are smaller
than the symbols. ... 118
Figure 5.2: NO3- uptake in wheat cv. Revenue under normoxia and hypoxia. Bars
indicate s.e. (n = 5 individual plants). Note that in some cases, the bars are smaller
than the symbols. ... 120
Figure 5.3: H+ uptake in wheat cv. Revenue under normoxia and hypoxia. Bars
indicate s.e. (n = 5 individual plants). Note that in some cases, the bars are smaller
than the symbols. ... 121
Figure 5.4: NH4+ uptake in barley cv. Naso Nijo under normoxia and hypoxia. Bars
indicate s.e. (n = 5 individual plants). Note that in some cases, the bars are smaller
than the symbols. ... 122
Figure 5.5: NO3- uptake in barley cv. Naso Nijo under normoxia and hypoxia. Bars
indicate s.e. (n = 5 individual plants). Note that in some cases, the bars are smaller
than the symbols. ... 124
Figure 5.6: H+ uptake in barley cv. Naso Nijo under normoxia and hypoxia. Bars
indicate s.e. (n = 5 individual plants). Note that in some cases, the bars are smaller
List of Tables
Table 2. 1: NRT1 family of nitrate transporters... 45
Table 2. 2: NRT2 family of nitrate transporters... 46
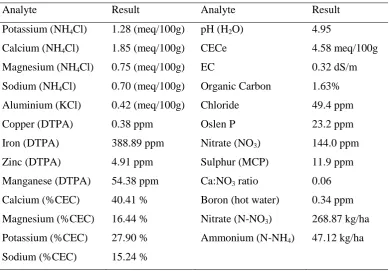
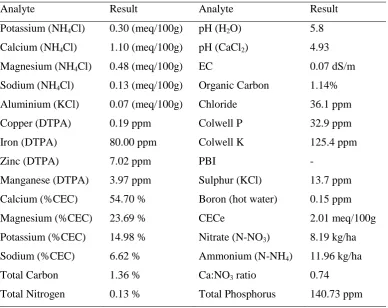
Table 3. 1: Soil nutrient composition for Experiment 1 ... 57
Table 3. 2: Soil mix nutrient composition for Experiment 2... 60
Table 3. 3: Applied N treatments (kg fertiliser ha-1) ... 61
Table 4. 1: Experimental site soil nutrient composition ... 89
Table 4. 2: Summary of the ANOVA probability values for the different growth attributes assessed during stem elongation (GS32) ... 94
Table 4. 3: Average AGDM for different irrigation regimes and nitrogen treatments at stem elongation (GS32) at Cressy Research and Demonstration Station in 2014 . 97 Table 4. 4: Summary of the ANOVA probability values for the different growth attributes assessed at anthesis (GS61) ... 98
Table 4. 6: Yield attributes and NUE for different irrigation regimes and nitrogen
treatments at maturity (GS92) at Cressy Research and Demonstration Station in
2014 ... 101
Table 4. 7: Interactions between irrigation regime and nitrogen fertilser application for
yield attributes and NUE at maturity (GS92) at Cressy Research and
Demonstration Station in 2014 ... 101
Table 4. 8: NUE components, GPC and gross margins on fertiliser use for different
irrigation regimes and nitrogen treatments at maturity (GS92) at Cressy research
and Demonstration Station in 2014 ... 103
Table 4. 9: Interactions (P > 0.05) between irrigation regime and nitrogen fertiliser
application for NUE components and GPC at maturity (GS92) at Cressy Research
and Demonstration Station in 2014 ... 103
Table 4. 10: Summary of the ANOVA probability values for the different yield
attributes, NUE components, GPC and gross margins assessed at maturity (GS92)
... 105
Table 6. 1: Gross margins (AU$/ha) on fertiliser use under different irrigation regimes
... 134
List of Abbreviations
[ ]: Concentration
AGDM: Above Ground Dry Matter
AMT/MEP: Ammonium transporter/methylammonium permease
ANOVA: Analysis of Variance
ARC: Australian Research Council
ATP or ATPs: Adenosine Triphosphate
B: Boron
C: Carbon
C: N: Carbon: Nitrogen ratio
Ca (OH) 2: Calcium Hydroxide
Ca: Calcium
Ca: Mg: Calcium: Magnesium ratio
Ca: NO3: Calcium: Nitrate ratio
CaCl2: Calcium Chloride
CaCO3: Calcium Carbonate
cHATS: Constitutive High Affinity Transport System
CEC: Cation Exchange Capacity
CECe/ECEC: Effective Cation Exchange Capacity
CRF: Controlled Release Fertiliser
CRFs: Controlled Release Fertilisers
CSL: Central Science Laboratory
CO(NH2)2: Urea
cv.: Cultivar
DM: Dry Matter
DTPA: Pentetic acid or diethylenetriaminepentaacetic acid
EA: Elemental Analyser
EC: Electrical Conductivity
EEFs: Enhanced-Efficiency Fertilisers
ETS: Electron Transport System
FC: Field Capacity
Fe: Iron
GHG: Green House Gas
GOGAT: GS/glutamine-2-oxoglutarate aminotransferase
GPC: Grain Protein Content
GS: Growth Stage
GWP: Global Warming Potential
H+: Proton
H2S: Hydrogen Sulfide
H3BO3: Boric Acid
HATS: High Affinity Transport System
HI: Harvest Index
HRC: Horticultural Research Centre
HRZ: High Rainfall Zone
iHATS: Inducible High Affinity Transport System
Inc.: Incorporated
K: Potassium
KCl: Potassium Chloride
Km: Michaelis-Menten kinetics
LA: Leaf Area
LAI: Leaf Area Index
LATS: Low Affinity Transport System
LIX: Liquid Ion Exchanger
LSD: Least Significant Difference
Ltd: Limited
MCP: Mono-Calcium Phosphate
Meq: Milliequivalents
Mg: Magnesium
MgSO4: Magnesium Sulphate
MIFE: Microelectrode Ion Flux Estimation
Mn: Manganese
mRNA: messenger Ribonucleic Acid
N: Nitrogen
N2O: Nitrous Oxide
NH4+: Ammonium ion
NH4Cl: Ammonium Chloride
NHI: Nitrogen Harvest Index
NiR: Nitrite Reductase
NO3-: Nitrate ion
NPF: Peptide Transporter
NR: Nitrate Reductase
NUE: Nitrogen Use Efficiency
NupE: Nitrogen Uptake Efficiency
NutE: Nitrogen Utilisation Efficiency
P: Phosphorous
P: Probability
PBI: Phosphorous Buffering Index
PGRs: Plant Growth Regulators
PMF: Proton Motive Force
PO43-: Phosphate ion
PTY: Proprietary
PVC: Polyvinyl chloride
Q10: Temperature Coefficient
RNA: Ribonucleic Acid
S: Sulphur
SNS: Soil Nitrogen Supply
SOM: Soil Organic Matter
SPAD: Soil and Plant Analyses Development
SR/CR: Slow-release/Controlled-release
TGW: Thousand Grain Weight
TIA: Tasmanian Institute of Agriculture
USA: United States of America
Chapter One: General Introduction
1.1 Introduction
With the global population projected at 9 billion by 2050 (Beddington 2010), increasing
food production to feed the increasing population equitably and sustainably (Morison et al.
2008) is one of the current debates (Hirel et al. 2007). Even so, the increasing population
and food demand is expected to rise along with the production of mineral fertilisers
(Lubkowski & Grzmil 2007), as increasing fertiliser demand drives supply (FAO 2008).
Recent trends in fertiliser costs are increasing the cost of food production (Rane et al.
2011). So far the doubling of agricultural production worldwide over the past four decades
has been associated with a 7-fold increase in the use of nitrogen (N) fertilisers (Hirel et al.
2007). In the long term, an estimated 50-70% increase in cereal grain production to feed
the projected 9.3 billion people by 2050 is expected to increase N use by the same
magnitude (Ladha et al. 2005). Moreover, in the near future, an anticipated 38% increase
in global cereal demand by 2025 can only be met by a 30% increase in N use in cereals
(Dobermann & Cassman 2005), which may not be possible with the current technology.
The global N consumption has now crossed 100 million tons (Mt) (Rane et al. 2011),
while the worldwide use of N in agriculture has increased to about 80 million t yr-1 (Olfs et
al. 2005), of which cereals account for about 55% (17.3% for wheat) (Heffer 2009).
Australia accounted for 0.9% (858,000t) of the world’s N consumption between 2006 and
2008, 30.7% (263,000t) of which was used in wheat production (Heffer 2009). This
consumption was expected to grow by 1.9% from 2010 to 2014 (FAO 2010) increasing N
Unfortunately, the global nitrogen-use efficiency (NUE) for cereals is ~33% with an
unaccounted 67% representing a US$15.9 billion annual loss of N fertiliser (Raun &
Johnson 1999). Cereal NUE in developed and developing countries stands at 42% and
29%, respectively (Raun & Johnson 1999). In Australia wheat NUE stands at 41% with the
remaining 59% potentially contributing to environmental and health concerns (Chen et al.
2008). A 2.4-2.7-fold increase in N driven eutrophication of ground and surface waters has
been predicted by 2050 should the conversion of ~109 hectares of natural ecosystems for
agricultural production occur (Tilman et al. 2001). This eutrophication may cause
unprecedented ecosystem simplification, loss of ecosystem services and species
extinctions (Giles 2005; Mathers et al. 2007; Tilman et al. 2001). Human health concerns
particularly methemoglobinemia (blue baby syndrome) have also been reported in addition
to the emission of nitrous oxide (N2O), a greenhouse gas (GHG) with a global warming
potential (GWP) of ~310 (Ju et al. 2009; Lubkowski & Grzmil 2007; Shaviv & Mikkelsen
1993). Nitrogen use in agriculture produces ~20% of the annual global reactive N
(Dobermann & Cassman 2005). In Australia, agriculture is among the industries
contributing to excessive loading of N into rivers particularly those in the high rainfall
zones (HRZs) (Mathers et al. 2007) and the main source of N2O. For instance, in 2005
agriculture contributed 67 Gg of N2O of which N fertilisers accounted for 21 Gg (Chen et
al. 2008). Processes such as ammonia volatilization, nitrification, leaching, erosion, runoff
and denitrification account for 92% of N loss from the plant-soil system (Chen et al. 2008;
Lubkowski & Grzmil 2007).
Arguably N fertiliser use, as is irrigation and use of improved seeds or crop varieties with
desirable traits, is a key input to crop production improvement (Sinclair & Rufty 2012).
However, the finite resources used in its manufacture (Haber-Bosch process) (Hirel et al.
For example, more than US$45 billion per annum are spent on N fertilisers worldwide
(Ladha et al. 2005) and this annual expenditure is expected to rise in future (FAO 2008).
With increasing costs and environmental pressures, improving NUE rather than higher
fertiliser application rates is necessary to improve crop yields (FAO 2008). Improving
NUE of crop plants through a combination of genetic improvement and agronomic
approaches has been viewed as a holistic approach (Rane et al. 2011). Achieving a
synchrony between N supply and crop demand is the key to optimizing trade-offs among
yield, profit and environmental protection in both large-scale agricultural systems in
developed countries and small-scale systems in developing countries (Cassman et al. 2002;
Li et al. 2007; Rane et al. 2011).
Using enhanced-efficiency fertilisers such as slow/controlled-release (SR/CR) fertilisers
(Li et al. 2007) may be one option to obtain a marked improvement in NUE (Chen et al.
2008) through synchronisation between N release and crop demand. Some studies have
supported this notion as SR/CR fertilisers are said to reduce N loss thereby increasing N
assimilation to more than 50% (Hauck 1985; Lubkowski & Grzmil 2007; Shaviv &
Mikkelsen 1993). Other merits associated with SR/CR fertilisers include reduced
anthropogenic eutrophication (Lubkowski & Grzmil 2007; Noellsch et al. 2009), and
significant savings in labour, time and energy as single fertiliser application at sowing is
possible precluding the need for topdressing (Lubkowski & Grzmil 2007; Mathers et al.
2007).Improving NUE will foster the tripartite goals of food security, agricultural
profitability and environmental quality (Cassman et al. 2002; Mohammed et al. 2013).
Soil moisture also plays a significant role in plant growth and development; however,
excessive soil moisture availability can cause significant yield losses (Zhang et al. 2006).
(HRZs) of Australia (Acuña et al. 2011; Bakker et al. 2005; Bakker et al. 2007; Zhang et
al. 2006), particularly in regions with duplex soils (Yaduvanshi et al. 2012). Waterlogging
is also increasingly becoming a matter of worldwide concern affecting 16% of soils in the
USA and irrigated crop production areas of India, Pakistan and China (Colmer &
Greenway 2011; Pang et al. 2004; Sairam et al. 2008). Waterlogging affects ca. 10% of the
global land area (Setter & Waters 2003), with a yield penalty of 15-80% depending on the
crop species, soil type and duration of the stress (Zhou 2010). On a global scale, about
10-15 million ha of the world’s wheat growing areas are affected annually by waterlogging
representing 15-20% of the 70 million ha cultivated annually for wheat production
(Hossain & Uddin 2011; Yaduvanshi et al. 2012). In Australia, waterlogging causes an
estimated annual production loss of AU$180 million (Pang et al. 2004). A greater
proportion of this is incurred in Western Australia where it reduces spring wheat yield by
~30-55% (Zhang et al. 2006), causing AU$100 million in crop losses in a wet year (Zhang
et al. 2004). In Tasmania, the relatively high rainfall coupled with a range of soil types,
leads to a high incidence of waterlogging in winter, causing yield losses of 39-49% in
wheat despite its relative tolerance compared with barley (Zhou 2010).
Waterlogging reduces N net uptake and transport in plants (Malik et al. 2002). As soon as
O2 is depleted, the NO3- is used by microorganisms in the soil as an alternative electron
acceptor in their respiration allowing the electron transport system (ETS) and oxidative
phosphorylation to continue (Drew 1991). The NO3- is reduced to NH4+, which becomes
the major form of mineral N in waterlogged soils (Colmer 2015; Feng et al. 2011; Yan et
al. 2011). The increase in abundance of NH4+ is accompanied by about equimolar H+
production. The protons excreted due to increased H+-ATPase activity lead to acidification
of the rhizosphere and repressed cation uptake (von Wirén et al. 2000). Nutrient uptake by
waterlogging. Understanding the transport of mineral nutrients such as NH4+ and NO3
-within the plant can shed light on the processes and mechanisms either up-regulated or
down-regulated during hypoxia (Kiba & Krapp 2016).This will also give us more insight
into how hypoxia affects plant N nutrition.
There are compelling reasons for increasing NUE in agricultural systems while
maintaining or decreasing N inputs. Efficient N fertiliser management is critical for the
economic production of cereals and the long-term protection of the environment
(López-Bellido et al. 2006). New technologies employing SR/CR fertilisers can be used as
effective mitigation alternatives to control environmental impacts of fertilisation (Shoji et
al. 2001). The knowledge gained from this study will equip cereal producers with an
opportunity to make informed decisions about SR/CR fertiliser use in cereal production
rather than their predominant use in non-agricultural crops (Shaviv & Mikkelsen 1993).
Through field experiments, studies under controlled glasshouse conditions and laboratory
studies; this research addressed the following objectives.
1. To assess selected wheat and barley varieties for tolerance to prolonged
waterlogging;
2. To determine the effect of waterlogging, nitrogen source and subsequent recovery
on wheat and barley growth and physiology;
3. To investigate whether timing of N application and source of applied N can
alleviate the adverse effects of waterlogging on wheat growth and improve NUE;
4. To characterise the uptake of NH4+, NO3- and H+ ions along the root axis of
The hypotheses tested were:
(a) Waterlogging will significantly decrease the growth and development of all
selected wheat and barley varieties;
(b) The controlled-release fertiliser (CRF) will significantly increase the growth and
physiological responses of selected wheat and barley varieties than conventional
split-applied urea;
(c) Under similar irrigation management, the CRF will significantly increase wheat
growth attributes, yield components, NUE, NUE components, NHI and GPC
compared with the single- and split-applied urea treatments;
(d) The uptake of NH4+, NO3- and H+ will vary significantly along the root axis and
between genotypes, and the uptake of NH4+ will be significantly higher than NO3-.
1.2 Thesis structure
The thesis contains seven chapters; a brief description of each chapter is given below.
Chapter 1:General Introduction: gives a brief insight into the study and provides a
general overview of the thesis.
Chapter 2:Literature Review: gives a detailed review of this research highlighting the dynamics of N fertiliser use in cereal production and how NUE can be improved through
the use of enhanced-efficiency fertilisers. It further shows how the duplex nature of soils in
Tasmania impact on crop productivity through waterlogging. The review also provides a
review of the kinetics and molecular mechanisms mediating uptake of N under hypoxia.
waterlogging. In this study, it was hypothesised that waterlogging will significantly
decrease the growth and development of all selected wheat and barley varieties. The
second study focused on the effect of waterlogging, nitrogen source and subsequent
recovery on wheat and barley growth and physiology. The key objective was to assess the
response of selected wheat and barley varieties to N fertiliser applicationwith a hypothesis
thatthe CRF will significantly increase the growth and physiological responses of selected
wheat and barley varieties than conventional split-applied urea.
Chapter 4: includes a field study, which investigated whether timing of N application and source of applied N can alleviate the adverse effects of waterlogging on wheat growth and
improve NUE. The study evaluated wheat growth responses and yield components under
different irrigation regimes and nitrogen treatments and quantified NUE, its components
and grain protein content under different irrigation regimes. It was hypothesised that under
similar irrigation management, the CRF will significantly increase wheat growth attributes,
yield components, NUE, NUE components, NHI and GPC compared with the single- and
split-applied urea treatments.
Chapter 5: maps the uptake of NH4+, NO3- and H+ ions along the root axis of selected
wheat and barley varieties under hypoxia using the non-invasive microelectrode ion flux
estimation (MIFE) technique. In this study, it was hypothesised that the uptake of NH4+,
NO3- and H+ will vary significantly along the root axis and between genotypes, and the
uptake of NH4+ will be significantly higher than NO3-.
Chapter 6:gives a general discussion of the major findings of the study.
Chapter 7: gives a conclusion of the main results, recommendationsand areas warranting
Chapter Two: Literature Review
2.1 Introduction
Waterlogging affects ca. 10% of the global land area (Setter & Waters 2003), and is one of
the most important abiotic constraints to agricultural crop production (Zhang et al. 2006).
The yield penalty resulting from waterlogging may vary between 15% and 80% depending
on the crop species, soil type and duration of the stress (Zhou 2010). Waterlogging reduces
nutrient uptake (Malik et al. 2002) as the reduction in nutrient availability is enhanced by
shoot growth relative to the roots, a phenomenon known as the ‘dilution effect’ (Colmer
2015). Nutrient uptake is also inhibited by lack of energy to drive the primary and
secondary active transport via the H+-translocating ATPase in the plasma membrane
(Armstrong & Drew 2002).
The application of N fertilisers can improve plant growth and development under
waterlogged conditions (Pang et al. 2007; Robertson et al. 2009; Swarup & Sharma 1993).
In order to improve NUE and plant productivity under waterlogged conditions,
slow-release/controlled-release (SR/CR) fertilisers could be a possible option. Understanding
the pattern of N uptake along the root axis will illuminate the processes and mechanisms
influencing N uptake during hypoxia.
This review highlights the dynamics of N fertiliser use in cereal production and how NUE
can be improved through the use of enhanced-efficiency fertilisers. It further shows how
the duplex nature of soils in Tasmania impacts on crop productivity through waterlogging
and gives an insight into the kinetics and molecular mechanisms mediating uptake of N
2.2 Tasmanian climate
The island of Tasmania lies between 144.50 and 1480E and stretches 400 to 43.50S (Hill et
al. 2009). It is characterised by a cool-temperate climate with variable annual rainfall
ranging between 500 mm in the central Midlands and 1000 mm on the north-west coast
(Acuña et al. 2011). Despite this variability in rainfall, Tasmania is located in the high
rainfall zone (HRZ) of Australia. A HRZ is defined as an area receiving at least 550 mm of
annual average rainfall (Mathers et al. 2007).
2.3 Cereal production in Tasmania
Cereal production in Tasmania accounts for 16,000 ha mainly dominated by wheat, barley
and oats (ABARES 2017). In 2016-17, 34 and 17 kilotons of wheat and barley respectively
were produced with only a slight increase of 2 kilotons for each from the previous year
(ABARES 2017). Unlike barley, wheat production in the region has been expanding due to
the high rainfall, longer and cooler growing seasons leading to higher yields (Mathers et al.
2007; Zhang et al. 2006). A typical wheat growing season is around 8.5 (May-January) and
10.5 months for grain and dual-purpose crops, respectively with an average yield of ~6-8 t
ha-1 (Acuña et al. 2011). Most of Tasmania’s cereals are used for animal feed with limited
demand for milling wheats (GRDC 2011). Nonetheless, access to irrigation and
high-yielding winter wheat varieties are expected to stimulate grain production (GRDC 2011).
2.4 Nitrogen dynamics
Crop production is by far the single largest cause of human alteration of the global N cycle
(Liu et al. 2010). The supply of N is dependent on applied fertiliser, soil type,
micro-environment around the root zone and the mechanisms of N loss into the micro-environment
and amount applied and crop season.On the other hand, the primary determinants of total
plant-available N supply are net rate of N release from the soil organic matter (SOM) and
incorporated crop residues. These are controlled by the balance between N immobilization
and mineralization as mediated by the soil microbes, contributions from applied organic
and inorganic N sources and losses from the plant-available pool (Cassman et al. 2002).
Other contributions include: wet and dry depositions from rainfall and dust, free living
biological N fixation (BNF) and in irrigated systems, N contained in water (Cassman et al.
2002). Additionally, under temperate conditions a flush of N mineralization after thawing
and warming in the spring season usually occurs, which boosts available N (Cassman et al.
2002).
Regardless of the N source, the potential for N loss often occurs when the size of
plant-available N pool exceeds the crop uptake requirements (Cassman et al. 2002). Much of the
concern about N fertilisers emanate from the fact that only a fraction of applied N is
utilised by crop plants (Rane et al. 2011).Usually, N is predominantly lost in form of
leaching and denitrification of nitrate-N (NO3-N) into N2O; however, denitrification is a
common occurrence on naturally heavy and poorly drained soils (Rane et al. 2011). Other
mechanisms of N loss include: nitrification (Jarvis 1996), immobilization (Harper et al.
1987), volatilization of surface-applied urea in form of NH3, N2, NO and NO2 and surface
runoff particularly during heavy precipitation (Fillery & McInnes 1992; Mathers et al.
2007). Under temperate climate, NO3- leaching is exacerbated by the presence of
negatively charged soils, which limit the presence of NO3- ions. In addition, the presence
of NH4+ ions in the soil is limited as they are readily oxidized to NO3- ions by
microorganisms (Di & Cameron 2002) particularly in aerated soils (Schenk 1996).
Understanding N cycling in the soil-plant atmosphere components of cereal production
concentration peaks in the early vegetative phase and decreases during the remaining
growth period even though N uptake from soil continues until maturity (Harper et al.
1987).This decrease has been attributed to the slower rate of N assimilation relative to C
and large losses of N between anthesis and grain filling mainly in form of NH3 (Harper et
al. 1987).N is lost from the leaves during leaf photorespiration and due to the imbalance
between N accumulation and N assimilation in plants (Xu et al. 2012). In addition, during
grain filling, more N is transferred from the leaves to the grain compared with the stem,
which boosts grain N content (Harper et al. 1987). On the other hand, application of N
fertiliser near anthesis has been suggested to increase post-anthesis N uptake, grain protein
content and grain protein concentration (Mohammed et al. 2013; Wuest & Cassman
1992b).
The efficiency of N assimilation depends on complex interactions in the crop’s root
system, microorganisms, chemical reactions taking place in the soil and processes leading
to adverse elimination of N from the soil (Lubkowski & Grzmil 2007). We can improve
the overall NUE of a cropping system by increasing crop uptake efficiency from applied N
inputs and reducing the amount of N lost from soil organic and inorganic N pools
Figure 2.1: Nitrogen dynamics in the soil-plant system.Source: Di and Cameron (2002).
2.4.1 Role of nitrogen fertiliser in cereal production
In most commercial cropping systems, the natural supply of N is often insufficient to meet
crop N demand, which necessitates inorganic N fertiliser application. The commonly
available N fertilisers in Australia used in cereal broadacre cropping include urea,
di-ammonium phosphate and mono-di-ammonium phosphate (Mathers et al. 2007). Nitrogen is
mostly absorbed from the soil through mass transfer as NH4+ and NO3- ions by the crop’s
root system (Lea & Azevedo 2006), and is one of the most important nutrients responsible
for large yields obtained from high input agriculture (Cai et al. 2011; Cai et al. 2012;
Constituting 2 to 4% of the above-ground plant dry material (Mengel & Kirkby 2001), N is
among the important macro-nutrients vital for plant growth. In the leaf, a significant
proportion of the total N is allocated to the chloroplasts (Shangguan et al. 2000b), most of
which is used for synthesis of components of the photosynthetic apparatus particularly
ribulose-1,5-bisphosphate carboxylase/oxygenase, (RuBisCO), which plays a significant
role in CO2 assimilation (Hirel et al. 2007; Shangguan et al. 2000a; Shangguan et al.
2000b). There is a positive correlation between the photosynthetic capacity of leaves and
their N content (Cai et al. 2011; Cai et al. 2012; Shangguan et al. 2000b). Previous
research has shown that N fertiliser application promotes N uptake, which in turn increases
chlorophyll content, leaf area index (LAI), photosynthetic rate and resultant crop yield
(Wang et al. 2012). In cereals, N supply has a significant effect on vegetative growth
particularly tillering and canopy size and duration, which influences resultant biomass,
grain yield (Anderson 1985; Cai et al. 2012; Fischer 1993; Fois et al. 2009; Latiri-Souki et
al. 1998), and grain protein content (Ercoli et al. 2008; Latiri-Souki et al. 1998).
2.4.2 Timing and application of nitrogen fertilisers
Nitrogen management is a vital aspect in improving NUE and maximizing crop
productivity (Cai et al. 2012; López-Bellido et al. 2006). This aspect encompasses the
mode-, timing- and rate- of N application (Kassem & Al-Suker 2009; Zhang et al. 2006).
Methods of N application include: deep placement, split-application and fertigation (Chen
et al. 2008). Other methods of N application include banding and broadcasting (Gordon
2009; Kassem & Al-Suker 2009). However, care should be taken during banding and deep
placement as N placed in contact with the seed may cause crop injury (Gordon 2009). A
3-4 cm distance from the plant root system is often recommended (Lubkowski & Grzmil
Usually, under split application, a smaller proportion of N is applied at planting or
pre-planting as a basal and the remaining N, often the largest proportion is top dressed at
tillering or stem elongation or even at near anthesis (Mohammed et al. 2013). This strategy
avoids unnecessary vegetative growth and risk of lodging (Anderson 1985).A study by
Wang et al. (2012) showed that a ratio of 3:7 for basal fertiliser to top dressed N can give
promising results such ashigh biomass, grain yield and improved grain quality.The basal
fertiliser enhances nutrient uptake from the soil (Gordon 2009), through stimulation of
early vegetative growth (Zhang et al. 2006; Pang et al. 2014), producing high tiller number
per m2 (Sieling et al. 1998). However, high N amounts at planting may reduce NUE and
the N harvest index (NHI) as additional ears derived from higher shoot categories yield
less than the main ears (Sieling et al. 1998). The reduction in yield could be due to
increased competition for other nutrients or water, which induces water stress during grain
filling (Zhang et al. 2006) causing ‘haying off’ in wheat (van Herwaarden et al. 1998) and
terminal drought (Farooq et al. 2014).
Besides that, excessive application of N fertiliser at planting increases the risk of NO3-N
leaching and immobilization (Mohammed et al. 2013), thereby reducing NUE without any
increase in yield (Li, X et al. 2007). This is supported by Wuest and Cassman (1992a) and
López-Bellido et al. (2006), who observed a 30-55% recovery of N applied at planting
compared with 55-80% recovery of N applied at anthesis. Similarly, López-Bellido et al.
(2005) obtained a mean wheat use of N fertiliser of 14% and 55% when N was applied at
sowing and top-dressed during stem elongation, respectively. Turning to Freney et al.
(1992), post sowing N application yielded 50-70% N recovery in comparison to >40% for
N applied at sowing. Studies in the United Kingdom have also showed that spring N
application could lead to 50-80% crop N recovery as this season is synonymous with
anthesis has been suggested to increase grain yield and N content particularly on poorly
drained soils (Mascagni Jr & Sabbe 1991).
However, contrary to the above, a few studies have argued that similar quantities of N can
be assimilated despite whether the entire N is applied at planting or split applied between
planting and flowering (Strong 1982). Krishnakumari et al. (2000) concluded that split
application where 50% of the total N is applied at tillering and flowering respectively can
increase N and grain protein content without incurring any yield penalty. Much as late N
application may improve NUE, applications after stem elongation have been claimed to
affect N utilization efficiency (NutE) (Fischer 1993). Furthermore, the traditional strategy
of split N at application has been criticized for producing more straw, which results in a
low grain to straw ratio (Krishnakumari et al. 2000).While the adequacy of a single N
application throughout the duration of the growing season is dependent on the quantity
applied and subsequent growth conditions (Strong 1982).
Arguably, numerous studies have been conducted to evaluate the effect of timing of N
fertiliser application on wheat yield and to a larger extent N recovery using 15N-labelled
isotope (Belford et al. 1992; Di & Cameron 2002; Freney et al. 1992; López-Bellido et al.
2006; López-Bellido et al. 2005). However, using 15N-labelled isotope doesn’t thoroughly
evaluate NUE, NutE and NupE. In addition, while split N fertiliser application is a highly
favoured strategy, it is associated with labour costs, challenges with fertiliser placement
and application after crop establishment can cause mechanical and scorch damage such as
foliar burn (Oertli 1980; Phillips & Mullins 2004). One such strategy to overcome the
challenges associated with single- and split- application of conventional fertilisers
particularly urea is the use of enhanced-efficiency fertilisers such as
As plant nutritional needs vary considerably during individual growth stages, pragmatic
measures are needed to maintain ample nutrient supply during critical growth stages
(Anderson 1985; Oertli 1980). Nitrogen being a vital nutrient for plant growth, appropriate
N management should be ensured to maximize NUE and yield attributes in cereals
(Anderson 1985; Oertli 1980). Furthermore, given the complexity of the N cycle, spatial
variability in soils and continued release of improved varieties with higher N demand,
correct timing of N application remains important (Mohammed et al. 2013). This could be
achieved by synchronizing N supply with crop demand, a mechanism which has proved
possible with SR/CR fertilisers.
2.4.3 Use of slow/controlled-release fertilisers in cereal production
Inorganic N is needed to supplement soil N supply (SNS) (Freney et al. 1992), however,
the available conventional N sources are easily lost through leaching (NO3-),
denitrification (N2, N20), immobilization, volatilization (NH3) and surface runoff (Ju et al.
2009; Lubkowski & Grzmil 2007; Mathers et al. 2007; Shaviv & Mikkelsen 1993).
Consequently, advances in fertiliser development have increased to improve NUE leading
to the design of SR/CR fertilisers (Rane et al. 2011; Shaviv 2001; Trenkel 1997; Trenkel
2010). The world consumption of SR/CR fertilisers was estimated at 786,000 metric
tonnes in 2004/05, a 45% increase compared with 1995/96 (Trenkel 2010). The global
demand for CRFs is expected to increase at around 10% annually during 2014-19 (IHS
Markit 2015).While their market value was estimated atUSD 2.2 billion in 2014, it is
projected to reach USD 3.2 billion by 2020 (Markets & Markets 2017)and exceed USD
3.9 billion by 2024 (Global Market Insights Inc. 2017).
According to Shaviv and Mikkelsen (1993), SR/CR fertilisers are defined as those from
They are generally classified into three main types: (a) inorganic low solubility
compounds; (b) organic low solubility compounds; and, (c) coated materials in which a
physical barrier controls their release (Chen et al. 2008; Shaviv 2001). Mechanisms of
nutrient release by SR/CR fertilisers include: diffusion, osmotic pumping and convective
release by coating disruption (Adams et al. 2013). These mechanisms have been
extensively discussed by Hauck (1985); Lubkowski & Grzmil (2007); Shaviv (2001);
Trenkel (2010). Nutrient release from SR/CR fertilisers is largely dependent on
temperature (Adams et al. 2013), with a 100C rise reported to double nutrient release
(Huett & Gogel 2000; Kochba et al. 1990). However, soil moisture content plays a
significant role in nutrient release (Wang & Alva 1996).
Nutrient release by CRFs is influenced by soil moisture content (Gandeza & Shoji 1992;
Wang & Alva 1996). According to Kochba et al. (1990), the rate of nutrient release from
the CRF is determined by the migration of vapour from the soil into the fertiliser granule.
However, this is dependent on the fertiliser nutrient release mechanism (Kochba et al.
1990). Fertilisers whose nutrient release is largely dependent on soil temperature, moisture
content of 50-100% FC has little effect on nutrient release rate (Huett & Gogel 2000;
Kochba et al. 1990). But at 25% FC, nutrient release from SR/CR N fertilisers is usually
slower and completely stops in dry soils (Kochba et al. 1990). This is attributed to the
marked effect of low soil moisture content on the diffussion process and mass movement
of water molecules in the soil (Hillel 1980; Kochba et al. 1990). On the other hand,
excessive soil moisture due to waterlogging or flooding can cause significant N losses
from readily soluble fertiliser forms such as conventional urea through leaching (Wang &
Alva 1996), unlike CRFs, which have been formulated to minimise the leaching loss of
dependent on soil type and the intensity and duration of waterlogging (Wang & Alva
1996).
Often referred to as enhanced-efficiency fertilisers (Chen et al. 2008), SR/CR fertilisers are
designed to release N over an extended period of time during crop growth (Lubkowski &
Grzmil 2007; Shaviv & Mikkelsen 1993; Trenkel 2010). They maximize NUE by
synchronizing N release with crop demand (Shaviv & Mikkelsen 1993; Trenkel 2010).
Some of the commercially available SR/CR fertilisers in Australia include: polymer-coated
urea, polyolefin-coated urea and humic-acid-coated urea (Chen et al. 2008).
As mentioned earlier, SR/CR N fertilisers are viewed as a possible option to improve
NUE. Some studies have supported this notion as SR/CR fertilisers are said to reduce N
loss thereby increasing N assimilation to more than 50% (Hauck 1985; Lubkowski &
Grzmil 2007; Shaviv & Mikkelsen 1993). A study by Wenyu et al. (2005) also revealed
that controlled-release urea (CRU) can increase wheat grain yield, protein content and
markedly reduce NO3- leaching. In addition, CRF (polyolefin-coated urea) was reported to
reduce N2O emission by ~81% in flood irrigated barley grown on a clay soil in north
eastern Colorado, USA producing a total N recovery of 66% (Shoji et al. 2001). Other
merits associated with SR/CR fertilisers include reduced anthropogenic eutrophication
(Lubkowski & Grzmil 2007; Noellsch et al. 2009; Shoji et al. 2001), and significant
savings in labour, time and energy as single fertiliser application at sowing is possible
precluding the need for topdressing (Lubkowski & Grzmil 2007; Mathers et al. 2007;
Oertli 1980; Shaviv & Mikkelsen 1993). Additionally, a 20-30% reduction in the
recommended conventional fertiliser application rate has been suggested when applying
Despite continuing technological developments and commercial availability of SR/CR
fertilisers, their widespread use in agriculture is still constrained (Mathers et al. 2007;
Shaviv & Mikkelsen 1993), contributing only 10% of the total amount of fertiliser used
(Chen et al. 2008). This limited adoption has been attributed to the high fertiliser cost,
which is often 3-10 times higher than that of a conventional fertiliser (Chen et al. 2008;
Heffer 2009; Noellsch et al. 2009; Shaviv 2001). Claims of infrequent yield increases
despite the additional costs have also been highlighted as a major hindrance to the
adoption of this technology (Akiyama et al. 2010). These occasional yield increases could
presumably be due to the fact that small grain crops such as wheat remobilise N where
large amounts of N absorbed in the early growth stages and stored in the leaves are later
translocated to the developing seed resulting in efficient use of soluble N (Seward 1984).
In Australia, the use of SR/CR fertilisers is also still limited (Chen et al. 2008; Mathers et
al. 2007), despite reported potential to increase in crops’ yield and profitability
(Lubkowski & Grzmil 2007; Oertli 1980; Shaviv & Mikkelsen 1993). The slow adoption
of this technology by farmers may be due to the limited research underscoring the
importance of SR/CR fertilisers in broadacre cropping compared with non-agricultural
crops such as turf grass (Shaviv & Mikkelsen 1993). The few studies conducted in cereals
such as rice or barley, have been mainly focussed on nitrification inhibitors and their role
in reducing N2O emissions rather than improving NUE. In addition, these studies have
been mainly conducted in China and Japan under various rice production systems
(Akiyama et al. 2010; Mosier et al. 1996; Mosier et al. 1998). This presented a substantial
knowledge gap, which this research sought to address byinvestigating how SR/CR N
fertilisers compared with conventional N sources in improving NUE in wheat and barley.
sources and how soil moisture content impacts on their effectiveness particularly under
waterlogged conditions.
2.5 Duplex soils
Duplex soils are widely distributed in Australia (Tennant et al. 1992), covering about 20%
of the continent, see Figure 2.2 (Chittleborough 1992). They have three dominant soil
orders i.e. Sodosols, Kurosols and Chromosols characterised with a clear or abrupt textural
B horizon (Cotching et al. 2009; Hardie et al. 2012). Duplex soils occupy 80% of the
agricultural regions in southern Australia (Hardie et al. 2012) and 60% of the south-west
agricultural land in Western Australia (Bakker et al. 2005; Bakker et al. 2007; Cox &
McFarlane 1995; Tennant et al. 1992; Turner 1992). In Tasmania, duplex soils occupy
about 23% of the land mass, mainly in the lower rainfall areas of eastern Tasmania; see
Figure 2.3 (Cotching et al. 2009). Although the term duplex is mainly used in Australia,
such texturecontrast soils are common in other parts of the world (Chittleborough 1992;
Cox & McFarlane 1995; Hardie et al. 2012).
Duplex soils are associated with a range of management problems including:
waterlogging, poor crop establishment, crusting, poor root penetration, desiccation, wind,
water and tunnel erosion, salinity and poor nutrient status (Belford et al. 1992; Hardie et al.
2012; Zhang et al. 2004). These management problems mainly stem from their
morphological features as they are characterised by a strong texture-contrast between the
A and B horizons (Bakker et al. 2005; Belford et al. 1992; Chittleborough 1992; Cox &
McFarlane 1995) and hydraulic properties (Bakker et al. 2005; Bakker et al. 2007; Fillery
& McInnes 1992). Usually the B horizon contains at least 20% more clay than the A
sharp (Chittleborough 1992; Hardie et al. 2012). However, the chemical, mineralogical and
[image:43.595.89.304.152.357.2]physical properties are not diagnostic (Chittleborough 1992; Cox & McFarlane 1995).
Figure 2.2: Distribution of duplex soils in Australia. Adapted from Chittleborough (1992).
Figure 2.3: Distribution of Sodosols in Tasmania. Adapted from Cotching et al. (2009).
2.5.1 Waterlogging of duplex soils
Waterlogging, one of the most hazardous natural occurrences is a phenomenon often
described as flooding, submergence, soil saturation, anoxia and hypoxia depending on the
soil moisture content (Ahmed et al. 2012).In duplex soils, waterlogging is characterised
[image:43.595.98.261.401.541.2]Zhang et al. 2006). Seasonally perched water tables are often caused by winter rainfall
exceeding evapotranspiration, limited storage capacity and slow soil drainage rates due to
low porosity of the subsoil, high gravel and clay content (Bakker et al. 2005; Bakker et al.
2007; Hardie et al. 2012; Pang et al. 2004; Zhang et al. 2006). Nonetheless, waterlogging
can occur during autumn or spring (Vartapetian & Jackson 1997).
Waterlogging creates water-saturated soil conditions with inadequate gas diffusion, 104
times slower than in air (Colmer & Greenway 2011; Greenway et al. 2006; Ponnamperuma
1972), leading to the development of anaerobic conditions (Condon & Giunta 2003; Parent
et al. 2008; Sairam et al. 2008; Trought & Drew 1980). This increases the concentration of
CO2, C2H4, Mn2+, Fe2+ and anaerobic microbial metabolites and lowers the concentration
of NO3- and SO42- ions (Colmer et al. 2001; Malik et al. 2002; Setter et al. 2009; Trought
& Drew 1980). The accumulation of CO2 is due to a combination of a 34-fold higher
solubility of CO2 than O2 in aqueous medium and the conversion of a substantial
proportion of CO2 to HCO3-, which is prominent at a higher soil pH (Greenway et al.
2006).Furthermore, under warm soil conditions respiration by microbes is stimulated
which depletes O2 within 24 hours (Drew 1997). This depletion of soil O2 either
completely (anoxia) or partially (hypoxia) (Crawford & Braendle 1996; Hossain & Uddin
2011), causes seminal root tip death, restricted nodal root length and limits plant nutrient
uptake and translocation of photoassimilates (Colmer & Greenway 2011; Condon &
Giunta 2003; Parent et al. 2008; Zhang et al. 2004), which reduces plant growth,
development and survival (Hardie et al. 2012; Parent et al. 2008). The intensity of
waterlogging is often low where topsoils are deeper than 0.6 m with the A2 horizon having
high hydraulic conductivity (>7.8 m day-1) and a sloping site facilitating lateral flows (Cox
2.5.2 Effect of waterlogging on cereal production
Waterlogging of duplex soils is a major abiotic constraint to cereal production in the HRZ
of Australia (Acuña et al. 2011; Bakker et al. 2005; Bakker et al. 2007; Zhang et al. 2006),
particularly in regions with duplex soils (Yaduvanshi et al. 2012).It is also increasingly
becoming a matter of worldwide concern affecting 16% of soils in the United States of
America (USA) and irrigated crop production areas of India, Pakistan and China (Colmer
& Greenway 2011; Pang et al. 2004; Sairam et al. 2008). In addition, cerealproduction in
East and Central Africa including the central highlands of Ethiopia is adversely affected by
waterlogging both on irrigated heavy clay soils and Vertisols (Yaduvanshi et al. 2012).On
a global scale, about 10-15 million ha of the world’s wheat growing areas are affected
annually by waterlogging, representing 15-20% of the 70 million ha cultivated annually
(Hossain & Uddin 2011; Yaduvanshi et al. 2012). Waterlogging is estimated to reduce
winter wheat grain yield by 20-50% (Collaku & Harrison 2002; Tan et al. 2008). For
barley, yield reductions range between 20-25%, but losses may exceed 50% depending on
the stage of plant development (Pang et al. 2004). In Australia, waterlogging causes an
estimated annual production loss of AU$180 million (Pang et al. 2004); a greater
proportion of this is incurred in Western Australia where it reduces spring wheat yield by
~30-55% (Zhang et al. 2006), causing AU$100 million in crop losses in a wet year (Zhang
et al. 2004).In Tasmania, where the state enjoys relatively high rainfall coupled with a
range of soil orders that are often saturated in winter, waterlogging is a major constraint to
cereal production causing yield losses of 39-49% in wheat despite its relative tolerance
compared with barley (Zhou 2010).These yield losses are usually as a result of restricted
root growth, reduced tiller number, premature leaf senescence and production of sterile
2.5.2.1 Effect of waterlogging on plant growth and development
Waterlogging adversely affects plant growth and various physiological processes (Pang et
al. 2004). It reduces the uptake and availability of essential nutrients (Pang et al. 2007;
Pang et al. 2004), leaving plants with marked N, P, K, Ca and Mg deficiency symptoms
(Huang et al. 1994b; Trought & Drew 1980). The occurrence of these nutritional
deficiency symptoms could be attributed to the substantial dilution of nutrient
concentrations, which decreases the availability of these nutrients and increases the
leaching of mobile nutrients (Huang et al. 1994b; Pang et al. 2007; Pang et al. 2004).
Another factor could be the decrease in root biomass, which impairs the ability of plant
roots to take up and transport mineral nutrients to the shoot (Huang et al. 1994b; Pang et
al. 2007; Pang et al. 2004). The decrease in root biomass often occurs as a result of root
death due to the anaerobic conditions within the root zone created by waterlogging. This
causes lodging especially at ear emergence (Watson et al. 1976).
Anaerobic conditions also cause stomatal closure, which reduces intracellular CO2 thus
limiting carbon fixation in leaves (Elzenga & van Veen 2010; Sharma et al. 2011).
Anaerobic conditions are due to waterlogging barring O2 diffusion, which decreases
cellular O2 levels to concentrations that restrict aerobic respiration (Bailey-Serres &
Voesenek 2008). The reduction in O2 diffusion is due to the very small diffusion
coefficient of O2 in water compared with the gaseous phase (Vartapetian & Jackson 1997).
Various studies have investigated the effect of waterlogging on cereal growth under
controlled conditions. In wheat,earlier studies by Trought and Drew (1980) on anaerobic
solution cultures showed that waterlogging can damage young plants through premature
senescence of older leaves and arrested growth of seminal roots. Hypoxic conditions