COMPARATIVE ANALYSIS OF WINE TANNINS
FROM PINOT NOIR GRAPES
by
Angela M. Sparrow (M.Agr.Sci.)
Submitted in fulfilment of the requirements for the
Degree of Doctor of Philosophy
DECLARATION OF ORIGINALITY
I hereby declare that this thesis contains no material which has been accepted for a degree or diploma in any other institution except by way of background information which is duly acknowledged in the thesis. To the best of my knowledge and belief the thesis contains no material previously published or written by another person, except where due acknowledgement is made in the text of the thesis, nor does the thesis contain any material that infringes copyright.
Angela Sparrow DATE: 2 February 2015
AUTHORITY OF ACCESS
This thesis is not to be made available for loan or copying for two years following the date this statement was signed. Following that time the thesis may be made available for loan and limited copying and communication in accordance with the Copyright Act 1968.
ACKNOWLEDGEMENTS
I acknowledge the support of an Australian Postgraduate Award for the duration of my studies and the added support of an Australian Grape and Wine Research and Development Corporation Postgraduate Award. I acknowledge the financial and professional assistance from the Australian Wine Research Institute in particular Paul Smith, Keren Bindon, Helen Holt, Natoiya Lloyd, Wes Pearson and Anne Lord. I would like to thank Brown Brothers, Tamar Ridge, Tasmania and the generosity of vineyard and winery staff in assisting with the practical aspects of the research, for the donation of grapes and use of the micro-winery facility at Kayena throughout this study. I am indebted to the technical assistance and camaraderie provided by Carol and Peter Maney, Phil Vowles, Bill Edwards and Mark Wilson. I would like to thank my supervisors Bob Dambergs and Dugald Close for their helpful advice and direction to the last minute; my colleague Anna Carew for invaluable discussion on the practical implications of Pinot Noir tannin research. To my friend and colleague Richard Smart I am very grateful, for his enthusiasm, encouragement and interest in the research associated with this project, which went far beyond his expertise as a viticulturist. To my family, I continue to be grateful for your acceptance of my renewed student status - every time! My parents, for your tireless encouragement, my siblings, for being so proud of me. To Leigh, your belief in my ability to persevere against all odds holds true. Catherine and Julia for your dedication to my endeavours, you remain the greatest achievement of my life.
Finally, I dedicate this thesis to my Lord and Saviour Jesus Christ who encouraged me to undertake the entire research investigation with his own words:
ABSTRACT
This thesis focuses on the sources of tannin in Pinot Noir grapes. Tannins contribute to colour stability and mouth-feel in wine. Some tannins are more beneficial to the quality of red wines than others. Achieving the correct balance is particularly difficult in Pinot Noir wines due to their unusual polyphenolic profile. In practical terms the thesis considered the following questions: How do we know from which berry tissues wine tannins are extracted? Are some tannins more desirable than others from a wine composition and quality viewpoint? How can we get more of the desirable tannins into Pinot noir wines?
The study sought to gain a better understanding of the types of phenolic compounds that influence wine quality in terms of colour stability. Phenolic compounds are mainly derived from the skin and seed of the grapes. However the nature and proportion of phenolic compounds that are contributed by each tissue type, and ultimately become incorporated into the wine, was largely unknown prior to this study.
The trials reported in this thesis used micro-vinification vessels ranging in size from 0.25 to 20 L according to the detail of the experiment under investigation and the analyses applied. Maceration techniques that are practiced commercially were compared and showed that some of these are better suited to the production of Pinot Noir table wines than are others.
TABLE OF CONTENTS Error! Bookmark not defined.
1. General Introduction 23
1.1 Pinot Noir vinification 23
1.2 Grape polyphenols 25
1.3 Types of tannin 28
1.4 Maceration techniques 31
1.5 Exogenous tannins 32
1.6 Phenolic analysis of grapes and wine 33
1.7 Main objectives 34
1.8 Structure of Thesis 38
2. Fermentation Volume Studies for Pinot Noir Experimentation 42
2.1 Abstract 40
2.2 Introduction 40
2.3 Materials and Methods 42
2.3.1. Grape sampling and replication 42
2.3.2. Treatment preparation 43
2.3.3. Grape composition analysis 45
2.3.4. Grape colour and tannin analysis 45
2.3.5. Microvinification protocol 45
2.3.6. Phenolic analysis by spectroscopy 46
2.3.7. Statistical analysis 47
2.4 Results 47
2.5 Discussion 50
2.6 Conclusion 52
2.7 Subsequent Research Focus 52
3. Response of Pinot Noir wine phenolics to Maceration treatment 55
3.1 Abstract 54
3.2 Introduction 55
3.3 Materials and Methods 58
3.4 Results 61
3.5 Discussion 65
3.6 Conclusion 67
4. The contribution of Component berry tissues to the phenolic composition of
Pinot Noir wine 73
4.1 Abstract 72
4.2 Introduction 73
4.3 Materials and Methods 75
4.3.1 Grape sampling and replication 75
4.3.2 Extraction of berry components 76
4.3.3 Preparation of berry components for vinification 77 4.3.4 Preparation for vinification of whole berries with a double complement
of skin, seed or pulp components. 78
4.3.5 Microvinification protocol 78
4.3.6 Analysis of extracts and wine 79
4.3.7 Statistical analysis 81
4.4 Results 82
4.5 Discussion 94
4.6 Conclusion 98
4.7 Subsequent Research Focus 100
5. The effect of Supplementary Tannins on the phenolic composition of Pinot Noir wines
5.1 Abstract 102
5.2 Introduction 103
5.3 Materials and Methods 105
5.3.1 Grape sampling and replication 105
5.3.2 Extraction of tannin and colour from grape and marc tissues 106
5.3.3 Treatments for winemaking 106
5.3.4 Preparation of Pinot Noir grape marc 108
5.3.5 Microvinfication protocol 108
5.3.6 Phenolic analysis by spectroscopy 109
5.3.7 Proanthocyanidin (PA) composition of wines 111
5.3.8 Statistical analysis 112
5.4 Results 112
5.5 Discussion 124
5.6 Conclusion 128
5.7 Subsequent Research Focus 129
6a.2 Introduction 132
6a.3 Materials and Methods 134
6a.4 Results 138
6a.5 Discussion 144
6a.6 Conclusion 149
6a.7 Subsequent Research focus 151
6b. The effect of seed removal on the phenolic composition of Pinot Noir wine 154
6b.4.1 Grape composition 160
6b.4.2 Seed removal 161
6b.4.3 Histochemical results 162
6b.4.4 Phenolic composition in wine at six months bottle age 165 7a. Accentuated Cut Edges (ACE): Influence of reduced skin particle size on
phenolic extraction from Pinot Noir grapes 177
7a.1 Abstract 175
7a.2 Introduction 176
7a.3 Materials and Methods 179
7a.3.1 Grape sampling and analysis 179
7a.3.2 Treatments for winemaking 180
7b.3.1 Calculation of ACE effect 183
7a.3.3 Vinification protocol 184
7a.3.4 Quantifying the effect of tannin supplements on wine phenolics 185
7a.3.5 Statistical analysis 186
7a.4 Results 187
7a.4.1 Grape composition 187
7a.4.2 Experiment A: Pomace homogenisation and seed removal 188
7a.4.3 Experiment B: Crushed versus cut berries 191
7a.4.4 Experiment C: Timing of ACE and influence of pectolytic enzyme 192
7a.5 Discussion 195
7a.6 Conclusion 199
7a.7 Subsequent Research Focus 202
7b. Cutting Edge Pinot Noir: innovative maceration technique Effects the phenolic, Sensory and aroma characteristics of Pinot Noir wines 208
7b.1 Abstract 209
7b.2 Introduction 210
7b.3.2 Treatments for winemaking 212
7b.3.3 Vinification protocol 213
7b.3.4 Statistical analysis for chemical composition 214
7b.3.4 Aroma analysis by GC-MS 214
7b.3.5 Sensory analyses 216
7b.4 Results 220
7b.4.1 Grape composition 220
7b.4.2 Phenolic composition of wine 220
7b.4.3 Wine aroma analysis 225
7b.4.4 Sensory evaluation of wine 228
7b.4.5 Comparison of sensory evaluation and chemcial composition of wine 233
7b.5 Discussion 235
7b.6 Conclusion 199
7b.7 Subsequent Research Focus 202
8. Phenolic Quality Index developed to differentiate the effect of skin and seed
tannin in Pinot Noir wine 240
8.1 Abstract 241
8.2 Introduction 242
8.3 Materials and Methods 243
8.3.1 Grape composition 238
8.3.2 Microvinification protocol 238
8.3.3 Statistical analyses 239
8.4.1 Grape composition 239
8.4.2 Spectral properties of phenolic standards 240
8.4.2 Development of the Phenolic Quality Index (PQI) 252
8.4.3 Evaluation of Pinot Noir wine using the PQI 256
8.5 Conclusions 258
8.6 Subsequent Research Focus 259
9. Conclusions and Recommendations 260
9.1 Background 255
9.2 Summary of results 256
9.3 Implications of research results 261
9.4 Recommendations 263
1
COMPARATIVE ANALYSIS OF WINE TANNINS FROM
GENERAL INTRODUCTION
Pinot Noir is the premier red grape variety grown in Tasmania. This study was undertaken in light of the acknowledged complexities involved in making a high quality Pinot Noir table wine particularly in relation to the phenolic composition of the wine.
Pinot Noir is one of the most difficult grape varieties to grow requiring optimum growing conditions that include warm days (17 to 21oC) consistently supported by cool evenings (6
to 9oC). There are more than 1000 registered clones of Pinot showing diverse berry colour,
yield, organoleptic qualities, leaf shape and cluster size (Robinson et al., 2012). Such diversity contributes to the challenges of making consistently high quality Pinot Noir table wines, as the various clones may behave differently under similar winemaking conditions. Further to this, many vineyards are planted with several different clones of Pinot Noir, adding to the range of responses shown by the fruit to the maceration technique selected during the winemaking process. In this thesis, the clone identification and fruit composition of Pinot Noir grapes has been specified where known for each of the experiments described.
1.1 PINOT NOIR VINIFICATION
more complex, developing earthy notes like mushrooms and decaying leaves (Hanson, 2014).
The anatomy of a red grape distinguishes the three major components of the berry: skin, pulp and seeds (Figure 1.1). Tannins are phenolic compounds and those extracted from grape skins are considered to be more important in the development of wine flavour than are those extracted from seeds (Cortell et al., 2005). Tannins are also extracted from grape stalks if they are included in the must (Robinson, 2006).
Figure 0.1. Tissues of the grape berry (Coombe, 1987)
The thin skins of Vitis vinifera cv. Pinot Noir grapes cause the ratio of skin tannins to seed tannins in the grapes to be low (Mattivi et al., 2009). These researchers isolated skin and seed tannins and reported that the ratio of skin to seed flavanols in Pinot Noir grapes was 1 to 63, while in Cabernet Sauvignon the ratio was 1 to 11 and in Shiraz 1 to 7.5. Subsequently, the wine quality for Pinot Noir has been strongly correlated to the skin tannin content of the grapes at harvest and the extraction of skin tannins together with colour pigments during winemaking (Neves et al., 2010). The term wine quality refers not only to the appearance, aroma, flavour and mouth feel of the wine, but also to its longevity.
pulp seed
[image:12.595.217.369.305.420.2]This thesis focuses on colour stability of the wine as influenced by extraction of colour and tannin from the grapes and their interactions in the wine matrix.
1.2 GRAPE POLYPHENOLS
Tannins and anthocyanins belong to the group of naturally occurring plant-derived polyphenolic substances called flavonoids which affect the colour, ageing ability and texture of the wine. Some tannins are perceived as bitter while others cause a tactile dry sensation in the mouth (Somers, 1971, Kennedy et al., 2002, Vidal et al., 2004b, Ducasse et al., 2010a, Mercurio et al., 2010, McRae and Kennedy, 2011). Anthocyanins develop during veraison and are responsible for the change in colour of the skin from green through red to deep purple; they are found in the outer layers of skins cells (Kennedy and Cortell, 2004).
Figure 0.2 Basic structure of an anthocyanin molecule
In wine solutions the different forms of anthocyanins are in equilibria according to their structure, the pH and the concentration of various co-factors in the wine matrix. The
R
1R
2 [image:13.595.199.390.462.585.2]prevalent as the pH rises and is blue-purple, while both the carbinol and chalcone forms are colourless (Scollary, 2010).
During the process of winemaking anthocyanins can undergo a range of reactions: they form self-associations or become co-pigmented with other low molecular weight compounds such as acetaldehyde, pyruvate, flavan-3-ol (Fulcrand et al., 1998, Romero and Bakker, 1999, Cheynier et al., 2006) and vinylphenol (Cameira-dos-Santos et al., 1996), to create an anthocyanin-derived pigment family, called pyranoanthocyanins. The most abundant of the pyranoanthocyanins are the vitisins and portisins (Figure 1.3).
Figure 0.3. Chemical structure of Vitisins and Portisins Vitisin A
R1 = O-CH3
R2 = O-CH3, OH or H
R3 = glucose or acetylglucose
R4 = catechin, phenol or a procyanidin dimer
Portisin
Vitisin A Vitisin B
anthocyanins and tannins in the winemaking process is a key component in ensuring red wine quality.
Note: The analytical procedure used throughout this research investigation to measure anthocyanin concentration, consisted of a single absorbance measure at 520 nm in acidified wine solution. The measure detects free anthocyanin and makes no distinction between the types of anthocyanin, consequently they have not been discussed in further detail.
In acidified solution (pH 1.0) all anthocyanins that are not bound in stable co-pigmented complexes are converted to the cationic form which is red in colour and can be detected at 520 nm. This value is considered relative to the absorbance of the wine sample in model wine solution (pH 3.4) containing 0.375% sodium metabisulphite and consequently gives an estimate of the concentration of anthocyanin that has not been stabilised.
1.3 TYPES OF TANNIN
The natural tannins found in grapes (proanthocyanidins) comprise a large class of polyphenols, in which flavan-3-ol molecules polymerise to form the larger proanthocyanidin molecules. Flavan-3-ol molecules are characterised by the oxygen heterocyclic ring system with an hydroxyl group at the 3 position (Figure 1.4).
Grape seed extracts contain three monomers (catechin, epicatechin and epicatechin gallate) and procyanidin oligomers, whereas grape skin extracts contain four monomers: catechin, epicatechin, gallocatechin and epigallocatechin (Mattivi et al., 2009). Their chemical structure is shown in Figure 1.5. During the course of this investigation, the association of these monomers with specific skin and seed tissues provided an opportunity to differentiate skin and seed derived phenolic components during fermentation.
Figure 0.5 Chemical structure of grape flavan-3-ol monomers
(+)-gallocatechin (skin)
(+)-epicatechin gallate (seed) catechin (seed, skin)
Epicatechin (seed, skin)
Whole grape extracts are rich in monomers and small oligomers (mean degree of polymerization, less than 8). The simplest proanthocyanidins are oligomeric proanthocyanidins with 2 to 4 linked flavan-3-ol molecules as well as procyanidin oligomers made up of epicatechin subunits and prodelphinidin oligomers made up of gallocatechin subunits (Mattivi et al., 2009) (Figure 1.6).
Figure 0.6 Chemical structure of simple proanthocyanidin oligomers
Subsequently larger tannins which have the same polymeric building blocks are described according to their mean degree of polymerisation (Figure 1.7).
dimeric 4-6
procyanidin
dimeric 4-8 procyanidin
Figure 0.7. Chemical structure of a polymeric proanthocyaninidin “condensed tannin” Acetaldehyde produced either by the oxidation of ethanol or is liberated by yeast during fermentation, not only forms ethyl bridges between anthocyanins and flavan-3-ols, but between proanthocyandins trimers in the formation of condensed tannins. The reaction of tannins and anthocyanins with the phenolic compound catechin creates yet another class of tannins known as “pigmented tannins” which influence the colour of red wine and are resistant to sulphur dioxide bleaching (Kennedy and Hayasaka, 2004). As these are the most prevalent form of stable pigment in Pinot Noir wines, they have been given more detailed consideration in this thesis than other forms of stable pigment. In the chapters which follow, the term “tannins” will generally be used to describe tannins found in grapes as well as the tannins present in wine; where more detailed discussion of tannin subunits is required, the term proanthocyanidins will be used.
1.4 MACERATION TECHNIQUES
To counter the challenges presented by the grape cultivar, a range of winemaking Condensed tannin polymer
R = H, procyanidin R = OH, prodelphinidin
and fermenting wine with the solid part of the grape must (pomace). Maceration techniques aim to optimise extraction of anthocyanins and tannins from the grapes and include cold soaking, SO2 addition, thermovinification, grape or must freezing, pectolytic enzyme addition, carbonic maceration and extended maceration (Spranger et al., 1998, Yokotsuka et al., 2000, Sacchi et al., 2005, Villaño et al., 2006).
While anthocyanins are extracted in the early stages of maceration and reach their maximum amount before the start of alcoholic fermentation, tannins are extracted later in the fermentation and continue to increase in concentration until the end of fermentation (Spranger et al., 1998, Ribéreau-Gayon, 1982). Recent studies have demonstrated that it is not necessarily the increase in alcohol concentration that causes tannins to be extracted later in the fermentation as once thought, but the breakdown of the polysaccharide structure of pulp tissues and the loss of seed coat integrity (Watson et al., 2000, Sacchi et al., 2005, Gambuti et al., 2009) that promotes seed extraction.
1.5 EXOGENOUS TANNINS
have been attributed to the many different preparations of oenological tannins and consequently, to their composition (He et al., 2012a).
1.6 PHENOLIC ANALYSIS OF GRAPES AND WINE
Despite these recent advances, there remains no simple method for differentiating seed and skin tannins in grapes and wine, with phloroglucinolysis and thiolysis currently the main methods used for this purpose (Torres and Lozano, 2001, Jorgensen et al., 2004). These analytical methods require not only significant expense, but sophisticated equipment and technological expertise. In order to address this gap in existing knowledge, this thesis used the method for rapid tannin analysis (Dambergs et al., 2012b) in conjunction with the modified Somers assay for wine colour (Mercurio et al., 2007) to evaluate the phenolic composition of the developing wine.
During 15 experiments conducted over 3 years, more than 3,000 samples of fermenting and maturing wine were analysed, with the aim of differentiating the contribution of skin and seed tissues to the phenolic profiles of Pinot Noir wines. The practical application of this knowledge was to develop a technique that will assist with the management of vinification methodology in commercial wineries.
1.7 MAIN OBJECTIVES
To optimise the extraction of beneficial tannins in red wine made from Pinot noir grapes a sequence of six studies were conducted:
Determine the relative contribution of tannins from grape berry tissues;
Investigate winemaking techniques that promote the extraction of preferred tannins;
Emphasise the influence on wine colour stability of desirable tannins;
Reduce the influence of undesirable tannins;
Describe a practical method of estimating phenolic quality of developing wine.
The following section outlines the objectives of each chapter.
Chapter 2 objective:
Determine whether the size and shape of the fermentation vessel has an impact on vinification outcomes with regard to the structure and quality of the wine. The development and evaluation of ultra-microvinification techniques at the northern Tasmania research laboratory has made possible fermentation experiments which could not be conducted on a larger scale.
Experiments of Chapter 2 scrutinised the response of Pinot Noir wine phenolic composition to different fermentation volumes. Some of the experiments described in subsequent chapters involved the use of fermentation vessels that were either small (1.5 L) or very small (250 mL), as they required intricate and time consuming must preparation. Others were large enough and of more conventional volume (15 L or larger) to provide sufficient volume of wine for replicated panel sensory analysis and industry-wide tastings. So the trials described in chapter 2 were conducted in fermentation vessels that covered the must weight range from 0.2 to 10 kg. In some instances it was useful to compare the results of trials conducted in 250 mL fermenters with those conducted in 1.5 L fermenters; in each case a control treatment was conducted in both vessel sizes.
Chapter 3 objective:
The trial used a single vessel size (1.5 L) and highlighted the differences in the phenolic composition of wines at bottling and at 30 months bottle age.
Chapter 4 objectives:
Determine the tannin concentration in each berry tissue and distinguish the contribution of each grape tissue to the phenolic composition of the wine.
Experiments explored the role of different berry tissues, firstly by determining the total tannin content of isolated berry tissues extractable in 50% (v/v) ethanol, and secondly by fermenting isolated grape tissues in juice pressed from the same parcel of fruit. In these experiments, one or more berry tissues were omitted or doubled in the must to emphasize the contribution of each tissue type to the phenolic profile of the wine as it aged.
Chapter 5 objectives:
Evaluate common winery by-products as a source of grape tannin, that might address the phenolic imbalance inherent in Pinot Noir grapes and compare a commercially available skin tannin supplement with local sources of grape phenolic compounds.
The option of using readily accessible sources of grape phenolics that are otherwise discarded from commercial wineries was explored to ascertain if they might complement the phenolic profile of Pinot Noir wines. Grape tissues from Pinot Noir, Pinot Gris and Chardonnay cultivars of Vitis Vinifera, were compared with a commercial skin tannin supplement as exogenous sources of grape phenolics.
Chapter 6 objectives:
The experiments highlighted in greater detail the impact of seed tannins on the phenolic composition of Pinot Noir wine, by supplementing or reducing the amount of seeds or seed tannin in the grape must. Histochemical studies of the seeds sampled during fermentation provided information on the location and rate of extraction of grape seed tannins.
Chapter 7 objectives:
Evaluate mechanisms that promote tannin extraction; differentiate methods for skin and seed tannin extraction and determine the influence of smaller skin particle size on the phenolic and sensory attributes of the wine.
Sequential experiments outlined the evolution of an innovative maceration procedure which reduced particle size of the grape skins, consequently extracting more colour pigment and tannin from the skins whilst leaving the seeds intact. The acronym ACE “Accentuated cut Edges” has been used to describe this novel technique.
Chapter 8 objectives:
Compile and contrast the spectral data from experiments conducted over the 3 years of the research; develop an analytical tool to monitor phenolic content during winemaking using laboratory equipment that is readily available in most wineries and explore a decision making protocol that may assist commercial wineries to direct the choice of maceration procedures which optimise wine quality outcomes for a parcel of fruit at any one time.
1.8 STRUCTURE OF THESIS
This thesis follows the structure proposed by the University of Tasmania which encourages the publication of results in the scientific literature. Consequently, most chapters are organised like a scientific paper, and are able to stand as an independent contribution. Hence, there is some repetition between chapters, especially in introductory remarks. All references have been placed the end of the thesis to avoid repetition. Ensuing publications will have co-authors however their contribution to each chapter is not specifically mentioned in the thesis.
There are some exceptions: Chapter 1 is introductory, and is designed to serve the remaining thesis, not publication per se. Similarly, Chapter 9 provides concluding remarks and recommendations for future research including application of the new technologies. All chapter references with the body of the thesis refer to chapters of this thesis.
2
FERMENTATION VOLUME STUDIES FOR PINOT NOIR
This chapter has been prepared as a research note entitled:
‘Fermentation Volume Studies for Red Wine Experimentation’
Authors: Angela M. Sparrow and Richard E. Smart
2.1 Abstract
Vinification is often use to evaluate changes to viticultural and oenological practices in research trials, however various constraints make standardised comparisons in commercial wineries difficult to achieve. A dedicated micro-winery facility in northern Tasmania used conventional 12 L volume ferments providing sufficient wine for both sensory and chemical analysis. From 2009 to 2013 much smaller fermentation vessels of 1.5 L and 250 mL were introduced, providing sufficient must volumes for chemical analysis only of phenolic components in the wine. A comparison was made of the phenolic attributes of Pinot Noir in a replicated trial must weights of 0.2, 1.0, and 10 kg fermented in vessels of volume 250 mL, 1.5 L and 20 L respectively. A single larger ferment conducted concurrently, used the same parcel of fruit at must weight 330 kg in a vessel with volume 780 L. At bottling, six weeks after the end of fermentation, there was no significant difference in the phenolic composition of wine made from grape musts with mass 0.2, 1.0 or 10 kilograms in the replicated trial and the results were consistent with those for the 330 kg ferment size.
2.2 Introduction
volumes and inexpensive fermentation and storage vessels together with temperature controlled rooms. Such techniques were developed in Europe, for example at Geisenheim Grape Breeding Institute Rheingau, Germany, for evaluation of new grape varieties (Becker, 1968) and were subsequently adopted in Australian grape and wine research (Becker and Kerridge, 1972, Antcliff and Kerridge, 1975). Microvinfication is now widely used for evaluation of viticultural and enological research trials in Australia and elsewhere, and its use has recently (20 January 2014) been reported in “approximately 999 citations (http://scholar.google.com.au/scholar)” using search words ‘microvinification + wine + grapes’.
fruit and the effects of winemaking additives and processes. However the extension of outcomes from small-scale winemaking trials to commercial practice sometimes raise concern for oenologists, for example, the possible influence of must temperature in fermenters of different surface to volume ratio (Hornsey, 2007). While this study was not replicated at larger sizes, it compared the phenolic composition of wines made from a homogenous parcel of fruit with must weights 0.2, 1.0 and 10 kg, fermenter volumes of 250 mL, 1.5 L and 20 L and must surface to volume ratios of 0.15, 0.09 and 0.04. A larger ferment was conducted concurrently but without replication, using the same parcel of fruit in a fermentation vessel with must weight 330 kg and surface to volume ratio of 0.03.
2.3 Materials and Methods
2.3.1.Grape sampling and replication
2.3.2.Treatment preparation
A = cylindrical polycarbonate jar; B = 1.5 L Bodum® coffee plunger; C = 20 L food-grade plastic bucket. D= 780 L plastic fruit-picking bin
Must weight A = 0.2 kg; B = 1 kg; C = 10 kg; D = 330 kg; Must SA:V A = 0.15, B = 0.09; C = 0.04; D=0.03.
Figure 2.8 Fermentation vessels
A B C
D D
A
B C
2.3.3.Grape composition analysis
Total soluble solids in the grape juice (Brix) were measured using a hand-held refractometer, the pH of the juice was measured using a Metrohm pH meter/autotitrator and titratable acidity was determined by titration with 0.333 M NaOH to an end point of pH 8.2 and reported as grams/litre tartaric acid.
2.3.4.Grape colour and tannin analysis
Frozen whole berries were thawed overnight at 4oC and homogenised at 8000 rpm for 20 seconds in a Retsch Grindomix GM200 homogeniser, with an S25 N-18G dispersing element (Janke & Kunkel GmbH & Co, Germany) fixed with a floating lid. One gram of homogenate was subsequently extracted in acidified 50% (v/v) ethanol for the determination of grape colour (Iland et al., 2004) and tannin (Dambergs et al., 2012b).
2.3.5.Microvinification protocol
pressure. In each case enough pressure was applied to recover 60% (v/w) of the must weight that is, 120 mL, 0.6 L, 6.0 L and 220 L of wine respectively. Wine was stored in glass screw topped bottles at 4C for 14 days, at which time it was racked under CO2 cover and a further 80 mg/L SO2 added. The wine was stored for a further 30 days at 12C when it was racked a second time under CO2 cover and bottled in either amber or green screw topped bottles. Six weeks after the end of fermentation, a 10 mL sample from each replicate and ferment size was taken for phenolic analysis.
2.3.6. Phenolic analysis by spectroscopy
Wine samples were clarified by centrifugation at 5,000 rpm for five minutes using an Eppendorf 5417C centrifuge with an Eppendorf F45-30-11 rotor (Crown Scientific, Australia). The phenolic composition of all samples were determined using the modification of the Somers assay described by Mercurio et al. (2007) with model wine buffer for colour analysis prepared using 5 g/L potassium hydrogen tartrate in 12% (v/v) ethanol. Assays were performed following a 1:10 dilution of wine in either model wine buffer containing 0.1% (v/v) acetaldehyde or model wine buffer containing 0.375% (w/v) sodium metabisulfite. Wine for the rapid tannin assay described by (Dambergs et al., 2012b) was diluted 1:50 with 1.0 M HCl.
(the degree of pigment saturation of the wine); and hue (the nature of wine colour - higher hue values appearing ruby-garnet, and lower values appearing more blue-purple). UV-Visible spectrophotometric analysis was conducted using a Thermo Genesys™ 10S UV-Vis Spectrophotometer. Samples were scanned in 10 mm cuvettes, at 2 nm intervals over the wavelength range 200-600 nm.
2.3.7.Statistical analysis
Statistical analyses were conducted using GenStat 64-bit Release 14.2Copyright 2011, VSN International Ltd. The mean, standard deviation and coefficient of variation for fruit composition characters, the phenolic content of grapes and the individual phenolic analytes in wine samples for each treatment replicate (n=4) were calculated using 1–way ANOVA. For each phenolic character ANOVA was followed by post-hoc analysis using Tukey’s 95% confidence test. The 330 kg ferment was unreplicated and excluded from statistical analyses.
2.4 RESULTS Fruit composition
Table 2.1 Fruit composition of Vitis vinfera cv. Pinot Noir Clone D5V12.
(mean, standard deviation (STDEV) and co-efficient of variation (CV); n=4)
Berry component Mean ± STDEV %CV
Berry Wt (g) 136.8 ± 10.5 7.7
Total Soluble Solids (oBrix) 21.20 ± 0.49 2.3
pH 3.22 ± 0.04 1.3
Titratable acidity (g/L)Ŧ 7.70 ± 0.24 3.1 Anthocyanin (mg/g) 0.58 ± 0.03 5.9 Total tannin (mg/g) 6.87 ± 0.24 3. 6 Total phenolics (AU/g) 1.18 ± 0.08 7.0
Ŧ
Titratable acidity expressed as grams of tartaric acid equivalents
2.3.1.Phenolic composition at bottling
Table 2.2 Must sizes for ferments made in vessels of different capacity. Vessel capacity (L) 0.25 1.5 20 780
Must weight (kg) 0.2 1 10 330
Must diameter (cm) 6.5 12 26 NA Must height (cm) 6.5 11.3 24 31 Must surface area (cm2) 33 113 531 10,000 Must volume (L) 0.22 1.28 12.7 310 Must surface:volume 0.15 0.09 0.04 0.03
NA, not applicable
[image:37.595.156.448.102.311.2]Table 2.3 Phenolic composition at bottling of Pinot Noir wine made in fermentation vessels of varying must capacity.
Must Size (kg) 0.2 1 10 ѫ330 %CV
(n=4 x size)
P-value
(0.05%) surface:volume ratio 0.15 0.09 0.04 0.03
Tannin (g/L) 0.23 0.22 0.33 0.22 30.9 0.14
Anthocyanin (g/L) 0.16 0.17 0.19 0.15 9.4 0.12 ϮNB pigment (AU) 0.32 0.32 0.32 0.30 12.4 0.94 Total pigment (AU) 8.54 8.86 9.88 7.91 9.3 0.14
% NB pigment 3.82 3.65 3.23 3.80 8.1 0.06
Total phenolics (AU) 24.6 24.3 28.1 24.0 7.4 0.06 Colour density (AU) 2.61 2.63 2.62 2.46 8.2 0.21 Hue (AU) 0.73 a 0.71 ab 0.68 b 0.81 3.0 0.04
For each ferment size 0.2, 1 and 10 kg, there were 4 replicates (n=4); ϮNB = non-bleachable pigment. For each phenolic parameter only means followed by a different letter were significantly different using Tukey’s test (p ≤ 0.05). ѫUnreplicated and excluded from statistical analyses.
2.5 DISCUSSION
responses to UV radiation and vine vigour (Dambergs and Sparrow, 2011, Song et al., 2015, Carew et al., 2012, Dambergs et al., 2012a, Carew et al., 2013b, Song et al., 2013).
This study demonstrates that for Pinot Noir grapes the phenolic composition of wine bottled six weeks after the completion of fermentation was independent of must sizes ranging from 0.2 to 10 kg in weight, for seven out of the eight phenolic characters assessed. The total tannin content of the wine showed the greatest coefficient of variation (31%) between replicates for the eight phenolic characters determined, which was greater than the CV (5-10%) found in other trials (Sparrow et al., 2013a). A possible explanation for the larger variation here, is the use of twice daily plunging for cap management rather than submerged cap fermentations as used in experiments which followed. With the exception of NP (CV 12.4%), the remaining phenolic characteristics consistently showed less than 10% variation the majority of which may be attributed to the 7% CV in the phenolic composition of the fruit (Table 2.1). The CV for wine hue was the lowest of the phenolic characters at 3% (P=0.04). Consequently, a minor difference in wine hue between the 0.2 kg must size and 10 kg must size was detected (Table 2.3).
In summary, micro- and ultra-micro vinification procedures were found to be a reproducible method for assessing the phenolic composition of wine made from musts over the range 0.2 to 10 kilograms..
stability of Pinot Noir wine, in addition potential differences in aroma and flavour characteristics of wines made in fermentation vessels with a range of surface area to volume ratios is also worth persuing.
2.6 CONCLUSION
The results of this study not only confirmed the benefits of microvinification as a research tool that can be modified to accommodate the number of progressive samples and the volume of finished wine required for analysis, but they also demonstrated that phenolic evaluation of the wine is independent of vessel volume over the must weight range from 200 grams to 10 kilograms and possibly larger.
2.7 SUBSEQUENT RESEARCH FOCUS
3
RESPONSE OF PINOT NOIR WINE PHENOLICS TO
This chapter is in preparation as a technical research article.
Authors: Anna L Carew (50%), Angela M Sparrow (40%),Robert G Dambergs (5%) and
Dugald C Close (5%).
3.1 ABSTRACT
relative to the control wines at 30 months bottle age. The study demonstrated that maceration is a valuable tool for winemakers in managing the phenolic character of Pinot Noir wine, and that both co-pigmentation and the polymerisation of anthocyanin and tannin to form non-bleachable pigment proceeds at different rates depending on the maceration technique. The influence of bottle age demonstrates that timing of analysis is important when judging the merit of various maceration techniques.
3.2 INTRODUCTION
The extraction and stabilisation of phenolic compounds is central to making good quality red wine (Peynaud, 1984). Phenolic compounds fall into two major classes – anthocyanins, which form the basis of red wine colour, and tannins, which influence textural properties of the wine and also form complexes with anthocyanins to produce stable colour pigments (polyphenolic pigmented tannins). Hydroxycinnamates, benzoic acids and flavonols are also involved in colour and flavour expression. The concentration of anthocyanin and tannin in wine has been correlated with measures of red wine quality such as wine scores at judging, and retail price (Cozzolino, et al. 2008, Holt, et al. 2008, Kassara and Kennedy 2011, (Ristic et al., 2010). While the term wine quality refers not only to the appearance, aroma, flavour and mouth feel of the wine, but also to its longevity, this investigation focuses on the intensity and stability of Pinot Noir wine colour.
(Mattivi, et al. 2009, Kennedy 2008, Downey, et al. 2003). By contrast, wines made from Pinot Noir grapes are often low in tannin concentration, compared with other red wine varieties (Harbertson, et al. 2008) which may be attributed to the late extraction of seed tannins relative to skin tannins (Watson et al., 2000, Sacchi et al., 2005, Gambuti et al., 2009, Koyama et al., 2007a). In analysing the tannin concentration of 1350 commercial red wines Harbertson et al. (2008) found Pinot Noir to have approximately half the concentration of tannin (catechin equivalents) compared with Cabernet Sauvignon and Merlot. As a result of the unique distribution and phenolic composition of Pinot Noir grapes, winemakers look for alternative methods for optimising the extraction of these compounds.
One option available to winemakers is to vary the maceration approach applied before, during or immediately after alcoholic fermentation. Maceration processes are applied to grape must to control the release of phenolic compounds from berries into juice.
The aim of this study was to compare the effect of six maceration treatments on the phenolic composition of Pinot Noir wine and to examine the relative response of the wines to bottle ageing. The first sample was taken at six months bottle age and represented the time at which winemakers would potentially make blending and price point decisions. The second sample taken at 30 months bottle age time and represented the time at which consumers are likely to drink the wine and evaluate its quality.
3.3 MATERIALS AND METHODS
3.3.1 Treatment preparation
30 kilograms of Pinot Noir grapes were harvested from a vineyard in Northern Tasmania, Australia at 12.5Baume and pH 3.25. Grapes were sampled for fruit composition and then bunches were randomly allocated into 24 replicates, each approximately 1.1 kg. Four replicates were allocated to each of six maceration treatments. Prior to application of the maceration treatments, grapes from each replicate were crushed using an Enoitalia manual bench-top crusher, and de-stemmed by hand before the resulting must was decanted to a 1.5L Bodum™ coffee plunger for fermentation following the ‘French Press’ submerged cap method (Dambergs and Sparrow, 2011, Dambergs et al., 2012a). The maceration treatments for this trial were: (1) control, (2) fermentation enzyme addition, (3) fermentation microwave maceration, (4) fermentation cold soak (4 days), (5) pre-fermentation freezing and thawing (3.5 days), and (6) post-pre-fermentation extended maceration (4 days).
musts had 300 mg/kg of pectolytic enzyme Lafase HE (Lafazyme) added to the must prior to placement at 27C ±3C. The microwave treated must was heated to 70C by microwave radiation, held at that temperature for one hour and cooled in an ice-bath for approximately 30 min (Carew et al., 2013a). Cold soak treated musts were covered with plastic film (Glad Wrap™) and stored for 4 days at 4C prior to warming to ambient temperature (20C) for 4 hours followed by a further 2 hours warming to 27C (±3C) in preparation for inoculation. Freeze-thaw treated musts were covered with plastic film (Glad Wrap™) and stored at minus 20C for 3.5 days prior to thawing for 6 hours at ambient temperature (20C) and warming at 27C (±3C).
3.3.2 Microvinification protocol
Approximately three hours after applying the control, enzyme, microwave and extended maceration treatments, those ferments were inoculated with the active dried yeast strain
maceration treatment fermenters were pressed off at day 12. Pressing off was achieved by applying firm downward pressure on the Bodum™ coffee plunger to a specified mark on the vessel, after which wine was decanted into 375 mL green glass bottles closed with stelvin screw caps and incubated at 27C (±3C) for 12 hours to ensure fermentation was complete. Wines were tested for residual sugar using Clinitest™ tablets and all wines were found to be dry (≤2.5 g/L residual sugar). The wine was then cold stabilised for two weeks at 4C to precipitate potassium hydrogen tartrate, and then racked into 250 mL Schott™ bottles under CO2 cover and stabilised against microbial attack and oxidation by the addition of 80 mg/L sulphur dioxide (SO2) in the form of potassium metabisulfite solution. After two weeks, wines were bottled under CO2 cover into 25 mL amber glass bottles, sealed with polypropylene screw caps and stored for bottle ageing. Polypropylene screw caps have been reported to have oxygen ingress similar to a synthetic cork (Peck, 2014).
3.3.3 Phenolic analysis by spectroscopy
and lower values appearing more blue-purple). UV-Visible spectrophotometric analysis was conducted using a Thermo Genesys™ 10S UV-Vis Spectrophotometer. Samples were scanned in 10 mm cuvettes, at 2 nm intervals over the wavelength range 200-600 nm.
3.3.4 Statistical analysis
Means and standard deviation were calculated in Excel™ for phenolic concentration measures at six and 30 months bottle age, and for pH at 30 months bottle age. GenStat 64-bit Release 14.2 Copyright 2011, VSN International Ltd. was used to calculate one-way and two-way ANOVA to identify treatment effects on wine phenolics at six and 30 months bottle age, and Tukey’s test was used for post-hoc analysis. In the following section, one-way ANOVA results are reported separately for each bottle age period as the periods represent two distinct points at which the phenolic quality of wines would be evaluated independently. Interactions between the maceration treatment and bottle age were analysed using two-way ANOVA and are reported after one-way ANOVA results in the following section as they are indicative of the relationship between the winemakers’ decision point and wine consumption.
3.4 RESULTS
The maceration treatments applied in this study were associated with significant differences in phenolic concentration in wines, and the pattern of difference changed with bottle ageing from bottling (50 days after inoculation) to 30 months bottle age (960 days after inoculation). The phenolic characteristics of the wines prior to the commencement of bottle ageing (50 days after inoculation) are listed in Appendix 3.1
higher hue values at 30 months bottle age than at 6 months bottle age which was indicative of a shift to the red-orange colour range.
Interactions were observed between maceration treatment and bottle age for all seven of the phenolic parameters examined in this study (total phenolics P=0.003; total pigment
P<0.001; anthocyanin P<0.001; SO2 resistant (non-bleachable) pigment P<0.001; tannin
Table 3.Error! No text of specified style in document. Pinot Noir wine phenolics at 240 and 960 days post-inoculation (mean; n=4) for six maceration treatments.
Significant differences in concentration for each parameter within the corresponding bottle age period (Tukey’s Test P 0.05) are represented by different letters. ŦNBP, Non-bleachable pigment; ND, below detection limit for the assay; NA, not applicable
Phenolic character control enzyme micro-wave
cold-soak
freeze-thaw
extended maceration Wine at 240 days post-inoculation (6 months bottle age) Total phenolics (AU) 28.2 a 30.22 a 41.1 b 29.8 a 40.1 b 30.1 a Total pigment (AU) 7.66 ab 7.71 b 13.9 c 7.82 b 9.43 b 5.61 a Anthocyanin (mg/L) 133 b 131 b 252 c 138 b 169 b 52 a NBP (AU) Ŧ 0.60 a 0.69 a 0.79 a 0.57 a 0.59 a 1.80 b Tannin (g/L) 0.38 a 0.51 ab 0.88 c 0.47 ab 0.94 c 0.61 b Colour density (AU) 2.91 a 3.23 a 4.31 b 4.58 b 3.07 a 4.58 b Hue (AU) 0.86 a 0.8 ab 0.75 bc 0.81 ab 0.83 ab 0.69 c
Wine at 960 days post-inoculation (30 months bottle age) Total phenolics (AU) 18.7 a 20.8 ab 25.5 c 20.0 a 25.0 bc 21.1 abc Total pigment (AU) 1.47 a 1.85 ab 2.42 b 1.93 ab 1.90 ab 2.04 ab
Anthocyanin (mg/L) 1.16 ND ND ND ND ND
3.5 DISCUSSION
3.5.1 Effect on wine phenolics
formation but transient stability of colour, whereas although skin-associated phenolics, although slower to polymerise, apparently provide more enduring wine colour.
The freeze-thaw treated wines at 30 months bottle age had a higher tannin concentration (3.7-fold higher) than control wines but had a similar non-bleachable pigment concentration to four of the five remaining treatments and no detectable anthocyanin, suggesting that the freeze-thaw treated wine may have lacked sufficient anthocyanin to capitalise on its high tannin concentration for the formation of additional non-bleachable pigment. The decline in non-bleachable pigment concentration observed in the extended maceration treatment wines from six to 30 months bottle age, and the reduction in hue of those wines suggests that while some of the non-bleachable pigment may not have been stable to 30 months bottle age, there may have been an overall increase in the quality of the non-bleachable pigment, which conferred more stable colour on the aged wine. Higher hue is indicative of ruby-garnet coloured wine, and infers either the early maturation of the wine due to the formation of pigment-flavanol polymers or the production of pyranoanthocyanin (vitisin) complexes (Cheynier et al., 2006). Lower hue values (blue-purple coloured wine) can have been related to greater anthocyanin stacking in co-pigmentation complexes, which have been associated with a bathochromic shift to absorbance of light of longer wavelengths in wines, but in the case of extended maceration wines, the anthocyanin concentrations were low, suggesting that the blue-purple colour may have been due to enhanced formation of portisins (Marquez et al., 2013).
3.5.2 Industry implications
consistency). Four of the six maceration treatments examined in this study conferred greater phenolic concentration on Pinot Noir wines but each treatment had cost implications. The application of enzyme treatment in winemaking has the lowest option in production cost and uses the least tank space (8 days). However, this treatment was shown to confer no phenolic advantage. The cold soak treatment used energy and cool store space but conferred greater non-bleachable pigment concentrations in aged wine. The freeze-thaw treatment required relatively high energy costs and freezer capacity producing a highly tannic wine. This option may be most appealing for winemakers seeking to use a small batch of highly tannic Pinot Noir wine in blending. The extended maceration process consumed fermentation tank space for 12 days, and the wines ran the risk of over-extraction (particularly of seed tannin) (Joscelyne, 2009), wine oxidation, and contamination by the aerobic, volatile acid-producing Acetobacter bacterium. While the energy and capital expense of microwave maceration was high, at 30 months the wines showed responses similar to wines from the cold-soak treatment. The microwave maceration treatment wines had finished fermentation after eight days skin contact time as did the control wines.
3.6 CONCLUSION
for producing very tannic wines, which may offer winemakers a blending option during vintages where grape tannin is low or winery capacity constraints limit skin contact time during alcoholic fermentation. Further research is needed to understand why the extended maceration treatment wines declined in non-bleachable pigment concentration after 30 months bottle age. For example, whether the source of tannin (seed or skin) or tannin composition in the three highly extractive maceration treatments differed from each other, and if this difference contributed to the decline in non-bleachable pigment concentration observed here. For practical purposes, the decline in stable colour observed in extended maceration wines may offer no disadvantage given that those wines remained significantly higher in stable colour (52%) than control wines at 30 months bottle age. An important point is that the non-bleachable pigment and tannin concentration of microwave and extended maceration treatments were similar at 30 months bottle age. This suggests that microwave maceration approach may offer a time-saving alternative to extended maceration winemaking. However the consideration of the energy costs and practical application of this technique requires further investigation.
Appendix 3.1 Pinot Noir wine phenolics at bottling, 50 days post-inoculation (mean; n=4) for six maceration treatments.
Significant differences in concentration for each parameter (P 0.05) are represented by different letters. ŦNBP, Non-bleachable pigment.
Phenolic character control enzyme micro-wave
cold-soak
freeze-thaw
extended maceration
LSD (trt)
Total phenolics (AU) 22.1b 22.3b 30.3a 19.7b 29.7a 20.1b 3.65 Total pigment (AU) 7.88b 7.40c 13.1a 7.03c 9.59b 5.00d 1.50 Anthocyanin (mg/L) 147c 138c 247a 132c 182b 80.0d 28.8 NBP (AU) Ŧ 0.31c 0.31c 0.43b 0.27c 0.30c 0.60a 0.09 Tannin (g/L) 0.00b 0.01b 0.29a 0.00b 0.31a 0.00b 0.13 Colour density (AU) 2.23c 2.34c 3.72a 2.16c 2.58c 3.21b 0.44
3.7 SUBSEQUENT RESEARCH FOCUS
4
THE CONTRIBUTION OF COMPONENT BERRY TISSUES TO
Experiments forming parts of this chapter were presented as a poster and Pinot
Noir workshop at 8thth International Cool Climate Symposium, Hobart, Australia,
February 2012.
Title: ‘Seeing Double Pinot Phenolics’
Authors: Angela M. Sparrow, Robert G Dambergs and Dugald C Close
The chapter is in preparation as a research article to be submitted to American
Journal of Enology and Viticulture.
Title: ‘The contribution of component berry tissues to the phenolic
composition of Pinot Noir wine’
Authors: Angela M. Sparrow, Robert G Dambergs, Keren A Bindon, Paul A Smith
and Dugald CClose
4.1 ABSTRACT
the must, anthocyanin concentration remained constant and non-bleachable pigments did not increase during ageing. Treatments with a double complement of grape skins were found to enhance both non-bleachable pigment and tannin in aged wines.
4.2 INTRODUCTION
Polyphenolic wine tannins can be extracted from the skin, seed and stalk of the grape bunch, and colour pigments (anthocyanins) are extracted from grape skins (Souquet et al., 2000, Jordao et al., 2001, Bindon et al., 2010a, Ribereau-Gayon et al., 2006). During winemaking, non-bleachable pigments are formed by polymerisation of anthocyanins with tannins (Pastor del Rio and Kennedy, 2006). The polymeric tannin-pigment complexes are more stable than free anthocyanins at wine pH and are resistant to sulphur dioxide bleaching (Somers, 1971). In addition, a proportion of non-bleachable wine colour is derived directly from reaction products of anthocyanin (Somers, 1971, Boulton, 2001, Cheynier et al., 2006). By comparison with other red grape varieties Vitis vinifera cv. Pinot Noir grapes have reduced colour development and a low skin to seed tannin ratio, factors which influence both the final tannin profile and colour stability of the wine. However the relative importance of grape-derived tannins from each berry component involved in the development of wine colour and the formation of non-bleachable pigments is poorly understood.
because of the preparation and consequent composition of the oenological tannins (Bautista-Ortín et al., 2005, Bautista-Ortin et al., 2007, He et al., 2012a).
In studies of red wine grapes, tannins derived from different parts of the berry have been characterised by their molecular mass and subunit composition, and these properties have been found to influence aspects of wine character such as flavour, mouth-feel and colour stability of the wine (Somers, 1971, Vidal et al., 2004b, Ducasse et al., 2010a, Mercurio et al., 2010, McRae and Kennedy, 2011). The presence of seeds in the must of Pinot Noir ferments compensates for the low concentrations of tannin in the skin and these seed-derived tannins are likely to have a central role in colour stability and mouth feel of the wine. The relative contribution of anatomically distinct berry tissues (skin, seed, pulp) to wine quality has been difficult to differentiate because of the disruption of the component tissues caused by de-stemming and crushing prior to vinification. By contrast, the phenolic composition of wine grapes has been assessed using a range of different extraction techniques and solvents (Saint-Criq et al., 1998, Cayla et al., 2002, Iland et al., 2004, Sarneckis et al., 2006) however, studies have shown that less than 50% of the grape tannin becomes incorporated into the wine (Harbertson et al., 2002, Adams and Scholz, 2008). In order to more accurately predict the proportion of tannin extracted from grapes to wine, grape tannin extraction during fermentation have been explored using a more wine-like medium, for example consisting of 12% aqueous ethanol, sulphur dioxide and tartaric acid, adjusted to pH 3.2, (Mattivi et al., 2009). However, Scollary (2010) cautioned that a wine-like medium did not account for changing sugar concentration and temperature variability that occurs during fermentation.
the loss of extractable tannin in the wine. Maceration techniques such as cold soaking, extended maceration and thermovinification are often employed to improve the extraction of both pigment and tannin in red wine (Sacchi et al., 2005) but the tissue source of the tannin is not necessarily discriminated.
This study aimed to address these issue using two new protocols: the first differentiated the source of grape polyphenols by isolating Pinot Noir berry tissue components (skin, seed and pulp) and extracting them in 50% (v/v) ethanol; the second compared the phenolic composition of wines made from berry tissue components either in isolation or in combination with other berry tissue components. Each of the reconstructed ‘musts’ used in the second protocol contained freshly pressed Pinot Noir grape juice which provided a medium in which the alcohol concentration gradually increased from 0-12.0% during fermentation, exposing the grape polyphenolic compounds to typical changes that occur during fermentation such as declining sugar concentration, development of yeast metabolites, and the change of organic grape acids (tartaric and malic) to include acetic, butyric and succinic acids found in wine (Mato et al., 2007).
Subsequently, changes in the concentration of total tannin and anthocyanin of the micro-vinified wines, together with the development of non-bleachable pigments were assessed over a 12 month period of wine ageing.
4.3 MATERIALS AND METHODS 4.3.1 Grape sampling and replication
From each replicate, 100 berries were selected at random to determine berry mass and fruit composition. Grape juice total soluble solids (Brix) were measured using a hand-held refractometer, pH was measured with a Metrohm pH meter/autotitrator, and titratable acidity by titration with 0.333 M NaOH to an end point of pH 8.2 (reported as g/L tartaric acid). Two hundred grams of berries from each replicate were frozen at -20 oC for later analysis of grape colour and tannin (Iland et al., 2004, Sarneckis et al., 2006, Dambergs et al., 2012b).
4.3.2 Extraction of berry components
pH 2. Samples were extracted with shaking at room temperature for 1 h, and then centrifuged for 15 min at 5000 rpm. Extracts were analysed for total tannin as described below, accounting for the dilution in sucrose buffer for each sample.
4.3.3 Preparation of berry components for vinification
The micro-vinification technique used in this study allowed us to ferment four replicates each of 200 g from each berry component (whole berries, skin, seed, pulp, juice).
4.3.4 Preparation for vinification of whole berries with a double complement of skin, seed or pulp components.
A second microvinification experiment was conducted to further evaluate the effect of each berry tissue component in the wine by doubling the contribution of that component in whole berry fermentations. To prepare these treatments, berries from each of the four 10 kg fruit replicates described above were removed from the stalks by hand and divided into five 200 g groups. One group formed the whole berry control, a second 200 g group was dissected into skins, seeds and pulp components with one berry component then added to each of three remaining groups of 200 g berries. This effectively doubled the contribution of one berry component in each wine. Treatments for this trial were: (1) berries (control); (2) whole berries + skins; (3) whole berries + seeds; (4) whole berries + pulp.
4.3.5 Microvinification protocol
for later phenolic analysis. The conclusion of fermentation was tested after six days using Clinitest® reagent tablets (Bayer Australia Ltd.) when each ferment was confirmed to contain less than 2 g/L of residual sugar. The must was pressed by inserting a second PVC spacer into the fermentation vessel with the gauze sieve facilitating separation of wine and solids. Wine was decanted from the fermentation vessel under CO2 cover into amber glass bottles and sealed with polypropylene screw caps. Wines were stored at 4C for 14 days, racked under CO2 cover to 50 mL amber glass bottles and 80 mg/L SO2 added. Following 30 days storage at 12C the wine was racked under CO2 cover into two 25 mL amber glass bottles and sealed with screw caps for storage at 12C. For each treatment, 1.5 mL wine samples were taken at pressing, racking, bottling, 6 months and 12 months post-bottling. All samples apart from the aged wine samples were frozen at -20 C prior to analysis. 4.3.6 Analysis of extracts and wine
In addition to the analyses described above, a subset of wine samples at 12 months bottle age were analysed for tannin composition. These analyses were conducted externally by AWRI (Australian Wine Research Institute) based in Glen Osmond, South Australia. Wine tannin concentration was determined using the methyl cellulose precipitable tannin assay (MCPT) according to Mercurio et al. (2007). MCP tannin assays gave the tannin
concentration of each wine in epicatechin equivalents (mg/L).
Isolation of Total Polymeric Phenols: Solid-phase extraction (SPE) was used to isolate total polymeric phenols form each wine sample as described by Kassara and Kennedy (2011). In brief Oasis HLB cartridges (3 mL, 650 mg, 30 µm) were conditioned with methanol (2 mL) followed by water (2 mL). Wine (1 mL) was applied to the cartridge under gravity. Once wine phenolics were adsorbed, the cartridge was dried with a gentle stream of nitrogen. Each cartridge was washed with 20 mL of 95% acetonitrile: 5% 0.01 M HCl (v/v) under vacuum. This step removed phenolic acids, nonpolymeric flavanols, flavonols, anthocyanins and other pigmented monomers. Polymeric phenolics were eluted with 300 µL of near formic acid followed by 3 mL of 95% (v/v) methanol. The fraction was concentrated under nitrogen at 28 oC and dissolved in methanol (10g/L) based on the initial wine tannin concentration by MCPT.
was heated at 50 oC for 25 min, cooled on ice for 1 min, and then quenched with 70 mM (150 µL) sodium acetate. Controls were prepared by replacing phloroglucinol reagent with methanol, (-) epicatechin was the HPLC standard, and calculations were as described by Kennedy and Jones (2001). HPLC analysis was performed using a model 1100 HPLC (Agilent Technologies Australia Pty Ltd., Melbourne, Australia) equipped with Chemstation software. The concentration of isolated polymer phenolics by phloroglucinolysis was found to be correlated (r2 = 0.84) to the concentration of isolated polymeric phenolics when assessed using the MCPT assay.
Gel Permeation Chromatography (GPC): The GPC method was adapted from that described by Kennedy and Taylor (2003a) to allow for increased size distribution resolution of high molecular mass proanthocyanidins isolates which had been diluted 1:5 in dimethylformamide as described by Bindon and Kennedy (2011). The column arrangement and chromatographic conditions were the same as the original method. For calibration, a second order polynomial was fitted with the proanthocyanidin elution time at 50% for each standard. Pre-veraison skin fractions of known mDP were used as standards for calibration, and a second-order polynomial fit with the time at 50% elution for each standard. For GPC analysis, proanthocyanidin samples in methanol were diluted with 4 volumes of the HPLC mobile phase. The maximum amount of proanthocyanidin injected onto the column was 40 μg. The calibration was used to predict mean molecular mass, as described previously (Bindon et al., 2010a, Bindon et al., 2010b).
4.3.7 Statistical analysis
concentration of individual phenolic components in must and wine samples for each treatment replicate over the seven sampling periods (n=312) was compared between treatments using Repeated Measures ANOVA. Post-hoc analyses were determined using Fisher’s Protected Least Significant Difference (LSD) test.
4.4 RESULTS
Grape composition 4.4.1
The fruit composition and phenolic content of Pinot Noir grapes used in this study are provided in Table 4.1. While the grape sample had slightly lower Brix and pH; higher titratable acidity, and a large berry mass than other published work using this variety, these parameters remained within the acceptable range of commercial ripeness for this Pinot Noir. The tannin and anthocyanin concentration for the grape samples were within the range reported in literature for Pinot Noir (Cortell et al., 2005, Cortell et al., 2007, Cortell and Kennedy, 2006, Kemp et al., 2011).
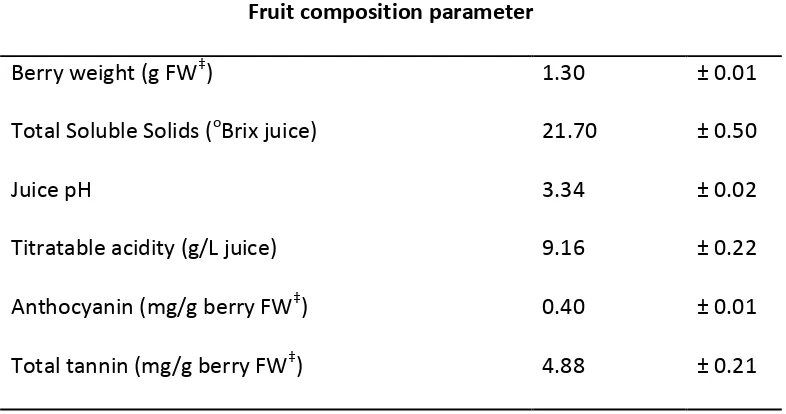
Table 4.1 Fruit composition (Mean and Standard Deviation, n=4) of fruit used in trials.
Fruit composition parameter
Berry weight (g FW‡) 1.30 ± 0.01
Total Soluble Solids (oBrix juice) 21.70 ± 0.50
Juice pH 3.34 ± 0.02
Titratable acidity (g/L juice) 9.16 ± 0.22
Anthocyanin (mg/g berry FW‡) 0.40 ± 0.01
Total tannin (mg/g berry FW‡) 4.88 ± 0.21
‡
FW, fresh weight
[image:71.595.105.498.104.311.2]