Sea ice thermohaline dynamics and biogeochemistry
in the Arctic Ocean: Empirical and model results
Pedro Duarte1 , Amelie Meyer1 , Lasse M. Olsen1 , Hanna M. Kauko1,2 , Philipp Assmy1 , Anja Rösel1 , Polona Itkin1 , Stephen R. Hudson1 , Mats A. Granskog1 , Sebastian Gerland1, Arild Sundfjord1 , Harald Steen1, Haakon Hop1,3, Lana Cohen1 , Algot K. Peterson4 ,
Nicole Jeffery5, Scott M. Elliott5, Elizabeth C. Hunke6 , and Adrian K. Turner6
1
Norwegian Polar Institute, Tromsø, Norway,2Centre for Autonomous Marine Operations and Systems, Department of Biology, Norwegian University of Science and Technology, Trondheim, Norway,3Department of Arctic and Marine Biology,
Faculty of Biosciences, Fisheries and Economics, UiT The Arctic University of Norway, Tromsø, Norway,4Geophysical Institute, Bjerknes Centre for Climate Research, University in Bergen, Bergen, Norway,5Computer, Computational and
Statistical Sciences Division, Los Alamos National Laboratory, Los Alamos, New Mexico, USA,6Theoretical Division, Los Alamos National Laboratory, Los Alamos, New Mexico, USA
Abstract
Large changes in the sea ice regime of the Arctic Ocean have occurred over the last decades justifying the development of models to forecast sea ice physics and biogeochemistry. The main goal of this study is to evaluate the performance of the Los Alamos Sea Ice Model (CICE) to simulate physical and biogeochemical properties at time scales of a few weeks and to use the model to analyze ice algal bloom dynamics in different types of ice. Ocean and atmospheric forcing data and observations of the evolution of the sea ice properties collected from 18 April to 4 June 2015, during the Norwegian young sea ICE expedition, were used to test the CICE model. Our results show the following: (i) model performance is reasonable for sea ice thickness and bulk salinity; good for vertically resolved temperature, vertically averaged Chlaconcentrations, and standing stocks; and poor for vertically resolved Chlaconcentrations. (ii) Improving current knowledge about nutrient exchanges, ice algal recruitment, and motion is critical to improve sea ice biogeochemical modeling. (iii) Ice algae may bloom despite some degree of basal melting. (iv) Ice algal motility driven by gradients in limiting factors is a plausible mechanism to explain their vertical distribution. (v) Different ice algal bloom and net primary production (NPP) patterns were identified in the ice types studied, suggesting that ice algal maximal growth rates will increase, while sea ice vertically integrated NPP and biomass will decrease as a result of the predictable increase in the area covered by refrozen leads in the Arctic Ocean.
Plain Language Summary
Important changes in the ice regime of the Arctic Ocean have occurred over the last decades with reductions in the summer sea ice extend and thickness. These changes and the importance of sea ice to the global climate system, the ecology of the Arctic Ocean, and the global biogeochemical cycles have justified the development of mathematical models to forecast sea ice evolution regarding its physical, chemical, and biological properties. In this work we test one such model—the Los Alamos Sea Ice Model—with data collected during the Norwegian young sea ICE expedition. Our results show that the model is capable of predicting accurately sea ice thickness, temperature, and salinity during a period of several weeks. However, it is not so accurate for biological variables. We suggest some aspects that may be investigated in trying to improve model performance, with emphasis on a better understanding of the behavior of ice algae that have an overwhelming importance for the Arctic marine food webs. Our results point to future changes in Arctic sea ice primary production associated with a more dynamic ice cover and a higher frequency of refrozen leads.1. Introduction
Over the last decades, the sea ice regime of the Arctic Ocean has changed from a thick perennial multiyear ice (MYI) to predominantly thinnerfirst-year ice (FYI) concomitant with a dramatic decline in summer sea ice extent [e.g.,Maslanik et al., 2011;Barber et al., 2015]. The physical properties of FYI are different from those of MYI [Hudson et al., 2013], suggesting that the changing ice regime may affect the feedbacks between sea ice, atmosphere, and ocean. Atmospheric changes seem to be the main driver of sea ice change, with positive feedbacks linked to reduced ice concentration, surface albedo, and ice thickness leading to
Journal of Geophysical Research: Biogeosciences
RESEARCH ARTICLE
10.1002/2016JG003660
Special Section:
Atmosphere-ice-ocean-ecosys-tem processes in a thinner Arctic sea ice regime: the Norwegian young sea ICE cruise 2015 (N-ICE2015)
Key Points:
•Sea ice physical variables can be accurately simulated at time scales of 2 months using a 1-D vertically resolved state of the art model •Ice algal motility driven by gradients
in limiting factors is a plausible mechanism to explain their vertical distribution
•The predictable increase in the area of refrozen leads may have a negative effect on vertically integrated ice algal primary production
Supporting Information:
•Supporting Information S1
Correspondence to:
P. Duarte,
pedro.duarte@npolar.no
Citation:
Duarte, P., et al. (2017), Sea ice thermohaline dynamics and biogeochemistry in the Arctic Ocean: Empirical and model results,J. Geophys. Res. Biogeosci.,122, 1632–1654, doi:10.1002/2016JG003660.
Received 6 OCT 2016 Accepted 15 MAY 2017
Accepted article online 8 JUN 2017 Published online 11 JUL 2017
©2017. The Authors.
additional local atmospheric and oceanic influences and self-supporting feedbacks [Döscher et al., 2014].
Melnikov et al.[2002] presented evidence of differences in the physical-chemical and biological characteris-tics of sea ice in the Arctic Ocean between the 1970s and late 1990s, including a major reduction in biodiversity of sea ice biota. The evolution of the icescape has and will continue to impact primary and secondary production and the geographical distribution of several species, as suggested by empirical and modeling studies [Slagstad et al., 2011, 2015;Jin et al., 2012, 2013;Vancoppenolle et al., 2013a;Ardyna et al., 2014;Arrigo and van Dijken, 2015]. Several studies have emphasized the role of sea ice in global biogeochem-ical cycles andfluid and gas exchanges with the sea and the atmosphere [e.g.,Vancoppenolle et al., 2013b]. Primary production has increased in the Arctic Ocean over the last years [Jin et al., 2012;Arrigo and van Dijken, 2015]. However, future trends in primary production for the Arctic Ocean are less certain, depending on the interplay between an expected decrease in light limitation—following the reduction of sea ice extent and thickness—and trends in nutrient limitation—depending on changes in upper ocean stratification/mixing and inputs from land [Popova et al., 2012;Vancoppenolle et al., 2013a;Slagstad et al., 2015].
The importance of physical properties of sea ice combined with a changing ice regime has stimulated the development of several mathematical models attempting to simulate sea ice dynamics and thermodynamics such as the Granular Sea Ice Model [Sedlacek et al., 2007], the Louvain-la-Neuve Sea Ice Model [Vancoppenolle et al., 2009], and the Los Alamos Sea Ice Model (CICE) [Jeffery et al., 2011;Hunke et al., 2015]. Models were also developed to simulate sea ice biogeochemistry, coupled with the cited physical models or as stand-alone applications.Tedesco and Vichi[2014] presented a synthesis of ice biogeochemical models published over the last 10 years (see Table 1 of the cited authors). These models can be classified in three groups, according to how the vertical distribution of ice algae and associated biogeochemical processes were represented [Duarte et al., 2015]: (a) one-layer models offixed thickness, (b) one-layer models of variable thickness, and (c) multilayer models.
Validation studies have been carried out to test some of the available sea ice models. Some of these studies focused on large spatial scales, attempting to test how accurately different models predicted sea ice concen-tration, distribution, and thickness in the Arctic Ocean or Southern Ocean [e.g., Sedlacek et al., 2007;
Vancoppenolle et al., 2009;Shu et al., 2015], whereas others tested models against observations at a local scale [e.g.,Arrigo et al., 1993;Arrigo and Sullivan, 1994;Huwald et al., 2005;Sedlacek et al., 2007;Vancoppenolle et al., 2007;Jeffery et al., 2011;Pogson et al., 2011;Turner et al., 2013;Jeffery and Hunke, 2014;Wang et al., 2015], with a focus on different aspects of sea ice physics and biology.
Over the past 20 years thermodynamic and biogeochemical sea ice models have undergone a methodologi-cal evolution: (i) modeling sea ice as a pure solid phase, even though parameterizing the effects of brine on thermodynamic properties, to mushy layer dynamics (e.g.,Huwald et al.[2005] versusTurner et al.[2013]); (ii) neglecting the effects of salinity on thermodynamics or prescribing afixed salinity profile toward attempting to simulate salinity using different parameterizations (e.g.,Arrigo et al.[1993] versusJeffery et al.[2011]); and (iii) modeling biogeochemistry at the bottom ice toward vertically resolved biogeochemical models (e.g.,Jin et al.[2008] versusPogson et al.[2011]).
Synthesis of the modeling approaches employed so far also highlights the challenges in modeling sea ice thermodynamics, tracer dynamics, and biogeochemistry despite the achievements in recent years. We believe that these challenges are mainly related to processes that are more dependent on parameterizations, such as tracer dynamics and biogeochemical phenomena, where concepts are still poorly described [Steiner et al., 2016], compromising model accuracy. Therefore, studies that provide insight into the strengths and weaknesses of available models are required. In spite of those challenges, models may be useful to test concepts and get insight into ongoing changes in the Arctic sea ice. Accordingly, the main goal of this study is to answer the following questions:
1. How accurately can we simulate sea ice physical and biogeochemical variables at time scales of a few weeks, in different types of ice?
2. Which are the most problematic prognostic variables and processes?
3. What are the main differences in ice algal bloom dynamics between different types of ice?
The N-ICE2015 data sets include all necessary forcing time series to simulate sea ice thermodynamics and biogeochemistry of the icefloes monitored during the expedition at relevant temporal and spatial scales (floe scale).
2. Materials and Methods
During the N-ICE2015 expedition, RVLancewas used as a research platform to establish drifting ice camps in the southern Nansen Basin of the Arctic Ocean. The observational platform was designed to collect compre-hensive data sets of the atmosphere-snow-ice-ocean-ecosystem interactions in a thinner Arctic sea ice regime. During the campaign, altogether four ice camps (Floes 1 to 4) were established that drifted with the ice pack [Granskog et al., 2016]. This study uses data collected during the N-ICE2015 expedition, as described in detail in other papers [Cohen et al., 2017;Kauko et al., 2017;Meyer et al., 2017a;Olsen et al., 2017;Peterson et al., 2017], to force simulations with version 5.1 of the Los Alamos Sea Ice Model (CICE) and to analyze the resulting output. The model applies mushy layer thermodynamics and vertically resolved biogeochemistry in a one dimensional (1-D) stand-alone mode [Turner et al., 2013;Hunke et al., 2015;Jeffery et al., 2016].
2.1. Sea Ice Conditions and Study Period Used for Modeling
The origin and age of the oldest ice in the study region were examined by sea ice back trajectories based on the daily sea ice motion satellite product from ASCAT and SSS/I [Girard-Ardhuin and Ezraty, 2012]. The ice could be tracked back to the Laptev Sea in autumn 2013; thus, the oldest ice in the study area was second-year ice (SYI) [Itkin et al., 2017]. Based on salinity andδ18O profiles at the study site, the ice was found to be a mix offirst-year (FYI) and second-year ice (SYI) with lower salinity in SYI [Granskog et al., 2017]. Remnants of low salinity andδ18O surface layers indicate that some ice survived one summer melt period, while other cores had typical FYI features [Granskog et al., 2017]. Modal sea ice thickness in the area was 1.5 m for the FYI and SYI, and snow depth was 30 cm for the FYI and 50 cm for the SYI [Rösel et al., 2016a;
Rösel et al., 2016b].
Model simulations of a refrozen lead (RL) and SYI sites were carried out in this study. For details of observa-tions seeKauko et al.[2017] andOlsen et al.[2017]. These were part of a largerfloe (Floe 3) that was monitored between 18 April and 5 June 2015 during the N-ICE2015 expedition, while the camp drifted from the Nansen Basin across and to the west of the Yermak Plateau (Figure 1). Simulations were carried out from 24 April, when the lead began refreezing, until 4 June.
2.2. Model Concepts and Approaches
Version 5.1 of CICE resolves physical processes vertically and biogeochemical processes in a single layer at the ice bottom and has been used in pan-Arctic biogeochemistry simulations coupled with ocean circulation models [Jin et al., 2012]. It includes several interacting components to simulate ice transport, mechanical rid-ging, and thermohaline dynamics [Hunke et al., 2015]. In addition, a 3-D sea ice biogeochemical module has been added to CICE [Jeffery et al., 2016]. Only the thermohaline dynamics and the vertically resolved biogeo-chemistry components are active in 1-D simulations and are thus relevant to the present work.
The various components, algorithms, and software used in CICE are documented in technical manuals [Hunke et al., 2015], and, more specifically, the biogeochemical processes, equations, and parameter values used in the present study are described inJeffery et al.[2016]. Several papers have described and discussed in depth the modeling approaches followed in CICE: e.g.,Jeffery et al.[2011] tested different ways of simulating the transport of tracers in sea ice;Elliott et al.[2012] presented results of a biogeochemical bottom layer model implemented in CICE;Turner et al.[2013] described a new parameterization of gravity brine drainage that is used in the present study; and a thorough sensitivity analysis of CICE v5.1 physical components was carried out byUrrego-Blanco et al.[2016].
(ammonium and nitrate), and silicic acid using equations and parameters described in Jeffery et al. [2016]. Pennate diatoms were the dominant algal group in sea ice samples collected in the types of ice and periods simulated in this study [Olsen et al., 2017]. In the case of 1-D stand-alone simula-tions, the sea ice model is forced by atmospheric and oceanographic time series that in the present study include the data sets listed below (see section 3). One of the forcing variables is the mixed-layer temperature (equiva-lent to sea surface temperature (SST) in the model), which is calculated via a thermodynamic slab-ocean mixed-layer parameterization within the CICE model, using a stability-dependent tur-bulentflux parameterization that is par-tially controlled by the mixed layer depth (MLD) parameter. Thus, SST and the salinity-dependent freezing temperature influence the exchange of heat between the ice and the ocean, based on the short wave radiation that reaches the sea through snow, ice, and open water; the heat exchanges between the water and the ice and atmosphere; and heatfluxes across the mixed layer. Water temperature is, however, also influenced by lateral and vertical mixing, not accounted for in the present model configuration. CICE includes a restoring time parameter that is used to assimilate measured water tem-peratures and bring values calculated by the slab-ocean mixed-layer parameterization close to observations, compensating for those processes not accounted for in the calculation of water temperature in the stand-alone configuration. In the present study, after testing several values, a restoring time scale of 1 day is used, similar toJeffery and Hunke[2014]. An alternative could be forcing water temperature with observations and not attempting to modify it. However, this may not be a good solution since temperatures measured in the water are, by definition, above its freezing point, preventing the formation of frazil ice in the model. CICE calculates a freezing potential that allows the formation of frazil ice and is a function of the ocean-water energy budget. After some test runs, it became apparent that MLD, based on observed density gradients, may not be appropriate to reproduce ice thermodynamics, especially at short time scales, when the time required to modify the water temperature by the slab-ocean mixed-layer parameterization becomes too large and the formation of frazil ice in the RL simulation occurs almost 2 weeks later than in reality. We abbreviate the depth used in the simulations as hmix, implying a mixing depth range distinct from that of the MLD, as a way to parameterize vertical small-scale stratification and related thermodynamic pro-cesses. hmix was set to 15 m for all simulations. This mixing depth range reflected the typical range within which wind forcing penetrated and homogenized the surface layer during the N-ICE2015 expedition [Meyer et al., 2017b]. The turbulent ocean heatflux measured at 1 m below the ice-ocean interface [Peterson et al., 2016], which is used to force the simulations, is therefore assumed to be valid within this 15 m mixing-depth range. Ideally, the mixing-depth range would vary over time to better reflect observations, with larger values during storms and smaller values during quiet periods. However, the chosen mixing depth range provides reasonable results and is kept as a constant so as not to introduce additional complexity with respect to the interpretation of results.
[image:4.612.179.410.91.297.2]Another forcing time series is that of current velocity relative to the ice. In its default configuration, the 1-D CICE setup uses a minimum default current velocity of 0.001 ms1 to provide background-level shear between the water and the ice and thereby force heat exchanges. In the present study, we implemented cal-culation of shear in the 1-D mode from velocities measured at 1 m below the ice-ocean interface to better mimic realistic forcing. The shear calculation is done exactly in the same way as in the dynamical
component of CICE [Hunke et al., 2015], thus allowing for results from this 1-D setup to be comparable with results from coupled CICE-ocean model simulations.
In CICE it may be assumed that diatoms may avoid ice melting to some extent due to the gliding capacity of some pennate species [Aumack et al., 2014]. However, motility is not calculated as a function of environmen-tal gradients. Motility may be an adaptation to optimize between vertically opposing factors, such as light and nutrients, as has been suggested for some microphytobenthic diatoms [Saburova and Polikarpov, 2003]. In the present study ice algal motility was implemented in CICE based on two different paradigms: (i) assuming that vertical motion is purely random but with a realistic velocity (default value used in CICE is 4.3 cm d1, within the velocity ranges reported inAumack et al.[2014]), implying that ice algae may move up or down independent of any environmental gradients (“neutral model”) and (ii) assuming that algae move toward the closest best conditions that minimize the impact of all limiting factors considered (light intensity, temperature, nitrate, and silicic acid concentrations), with the same velocity mentioned before (“ determinis-tic model”). Therefore, if the minimum of all limiting factors is higher (closer to one) in a layer above or below the current layer, part of the algae migrates toward the“better”layer following an upwind scheme. The com-parison between simulations with and without algal motion allows evaluating the possible effect of motility behavior, and the contrast between the“random”and the“deterministic”models allows testing the potential importance of vertical gradients in limiting environmental factors.
Equation (1) describes changes in ice algal concentration due to algal motion, and equation (2) is the numer-ical upwind version of (1).
dC dt ¼
d vð •CÞ dx ≈
ΔC
Δt ¼
Δðv•CÞ
Δx (1)
ΔC
Δt ¼
Δðv•CÞ
Δx ⇔ CtiþΔtCti
Δt ¼
0:5•ðvþj jvÞ•Ci1þðvj jvÞ•Ciðvþj jvÞ•Ciþðvj jvÞ•Ciþ1
Δx
(2)
whereCis ice algal concentration (mM N m3),vis ice algal velocity (m s1) (positive downward following CICE sign convention forfluxes),xis vertical distance (m),iis layer index in the biological grid (biogrid is the grid that is used in CICE for biogeochemistry), and the asterisk is the time at which concentrations are reported (tin the case of using an explicit method andt +Δtin the case of using an implicit method). Model results for the periods described above (see section 2.1) are compared with observations of the following variables: sea ice thickness, temperature, salinity, nitrate, silicic acid, and chlorophyll (Chla). CICE calculates biomasses in nitrogen units, and the conversion to Chla(2.1 mg Chlammol N1) was chosen from the range reported bySmith et al.[1993]. The observed data show no significant correlation (p> 0.05) between particulate organic nitrogen (PON) and Chla, not surprisingly, considering that the detritus and other nonalgal life forms also contribute to PON. However, the use of Chlaas a proxy for microalgal biomass is also questionable considering the high variance of the carbon:Chlaratios.Jørgensen et al.[1991] report weight ratios in the range 22 to 288. This also implies a large variability of the nitrogen:Chlaratio, making a proper comparison of the CICE output with Chladata less reliable. The types and resolution of the data available from the RL and the SYI are not identical (Table 1), limiting the comparisons between model and observations. In some cases, data are vertically resolved, while in other cases, only vertically averaged data are available.
2.3. Model Simulations
The main purpose here it to disentangle the feedbacks between physical, chemical, and biological factors, in order to better understand some of the results observed during the N-ICE2015 expedition and also to pinpoint model shortcomings and possible improvements. Synergies between this study and several others included in this volume are frequently referred to.
simulations focus on comparing observed and simulated physical variables only. In another part of the ice
floe—the main coring site—SYI was cored regularly and available biogeochemical data [Kauko et al., 2017;
Olsen et al., 2017] are compared with simulations. Hereafter the main simulation sets will be identified as
“RL,” “SYI/IMB,”or“SYI/coring.”
Biogeochemical simulations were carried out changing ice algal recruitment, i.e., theflux of ice algae from the water to the ice, considering its very high uncertainty and importance for the RL simulations that started with no ice. Recruitment is based on the ice algal nitrogen concentration difference between the bottom ice and the ocean. A default value of 0.002μM N is used for the ocean boundary in CICE [Jeffery et al., 2016]. This value was increased/decreased in different simulations. Silicon-related limiting parameters—silicon:nitrogen (Si:N) ice algal ratio and the half saturation constant for uptake of silicic acid—were changed within ranges reported in the literature after strong evidence for silicon limitation, both from the empirical and the model data. The effects of algal motion were also investigated, using the approaches described in section 2.2. A time step of 450 s was used in all simulations. Tests conducted with shorter time steps lead to similar results. Fifteen ice layers were used in all simulations and one snow layer for the RL orfive for the SYI simulations. The RL simulations started with no ice, whereas SYI simulations were initiated with snow and ice conditions as similar as possible to the observed ones, after spinning up the model for some time to allow the production of ice. Initial ice contents for RL result from the incorporation of water properties during ice formation. Therefore, when frazil ice is formed, it has bulk properties similar to those of seawater at the same date. The model reads seawater salinity, temperature, and nutrient concentration (ammonium, nitrate, and silicic acid) values from the forcing functionfiles. The SYI initial conditions were set to match observations of ice and snow thickness, salinity, nitrate, silicic acid, and ice algal biomass.
2.4. Evaluation of Model Performance
[image:6.612.44.578.107.368.2]Several criteria synthesized inAllen et al.[2007] were used to evaluate the model results: (i) the Nash-Sutcliffe efficiency (ME) [Nash and Sutcliffe, 1970], which is a measure of the ratio of the model error to the variability of the data; (ii) the absolute value of the percentage of model bias |Pbias|—a measure of whether the model is
Table 1. Main Model Simulationsa
Type of Ice Variables Used for Model Evaluation Simulations
Refrozen lead (RL) Ice thickness, vertically averaged salinity, bottom nitrate and silicic acid concentrations, and vertically averaged ice algal Chlaconcentration
RL_Sim_1: standard CICE parameter values; RL_Sim_2: diatom Si:N ratio reduced from 1.8 to 1.0 within ranges
reported inBrzrezinzki[1985] (0.25–4.38) andHegseth
[1992] (0.50–1.30); RL_Sim_3: diatom half saturation constant for silicon uptake reduced in the same proportion as the Si:N from 4.0 to 2.2μM within the
range (1.1–4.6μM) reported inNelson and Tréguer
[1992]. Other parameters as in the standard simulation; RL_Sim_4: algal recruitment increased in the same proportion as previous parameters. Other parameters as in the standard simulation; RL_Sim_5: decreased Si:N
ratio and half saturation constant for silicon uptake as before and decreased recruitment in the
same proportion Second-year ice (SYI) with IMB data Ice and snow thickness and vertically resolved ice
temperature
SYI/IMB: standard CICE parameter values
Second-year ice (SYI) with coring data Bottom nitrate and silicic acid concentrations and vertically resolved salinity and ice algal Chla
concentration
SYI_Sim_1: standard CICE parameter values, except for the sigma coefficient for snow grain (R_snow) [ Urrego-Blanco et al., 2016] that was changed from 1.5 to 0.8 (see
section 4.4); SYI_Sim_2:“random”algal motion implemented; SYI_Sim_3:“deterministic”algal motion implemented; SYI_Sim_4:“deterministic”algal motion combined with lowered Si:N ratio and reducing the half
saturation constant for silicon uptake as above
aThe refrozen lead (RL) was monitored for more variables and with a higher temporal resolution than the remaining ice types. An area with SYI was monitored
systematically underestimating or overestimating the observations; (iii) the cost function (CF) that is a measure of the goodness offit between different data sets [Convention for the Protection of the Marine Environment of the North-East Atlantic (OSPAR) Commission, 1998]; (iv) the root-mean-square error (RMSE); and (v) the squared correlation coefficient (r2), which is a measure of the data variability explained by the model. Whenever available in the literature, qualitative criteria were adopted (Table S1 in the supporting information). Prior to apply any of the these measures of model reliability it was necessary to average empirical data for the same depth ranges as the model data and, in the case of vertically resolved data, it was necessary to interpolate both the empirical and the model data with the same spatial resolution to allow pairing of both data sets. When different measures of skill lead to controversial quality evaluations, the visual comparison of model and empirical data was also considered in judging model performance. The variables selected for model evaluation with the above criteria were those for which there were more thanfive observations at different times coinciding spatially with the model results. These included the variables listed in Table 1, except vertically resolved salinity, nitrate, and silicic acid concentrations. Variables notfitting into the mentioned criteria were still visually compared with the best available data.
3. Data Time Series Used for
Model Forcing and Evaluation
Several data sets were used to force and evaluate the model. Some of these are published and include the following: wind speed, air temperature, precipita-tion, and specific humidity [Hudson et al., 2015;Cohen et al., 2017]; incident surface short and longwave radiation data [Taskjelle et al., 2016;Hudson et al., 2016]; ice core physics—temperature and salinity sea ice data [Gerland et al., 2017]; snow and ice thickness, ice tem-perature, and sea surface temperature (SST) from IMB data (SIMBA-2015c) [Itkin et al., 2015]; sea surface current velocity, temperature, salinity, and heat
fluxes from a turbulence instrument cluster (TIC) [Peterson et al., 2016, 2017]; and sea surface nutrient concen-trations [Assmy et al., 2016].
RL simulations were forced with SST derived from the TIC data set, whereas SYI simulations were forced with SST from the IMB data set.
Moreover, other data sets on photo-synthetically active radiation (PAR, 400–700μm) transmitted through snow and ice, sea ice salinity, Chla, nitrate and silicic acid, and snow thickness were also used. These have been described and discussed in other papers of this volume [Gerland et al., 2017;Taskjelle et al., 2017;Kauko et al., 2017;
Olsen et al., 2017].
All forcing data sets and monitored sea ice data were obtained on, in, and below the same icefloe, within a radius of a few hundred meters. For the purposes of model forcing, data sets were interpolated linearly tofill in gaps and/or to properly synchronize with model data input routines.
4. Results
The forcing function time series are presented in section 4.1. Model results are described in sections 4.2–4.5. Due to space constraints, the results are not shown for all simulations. Unless otherwise stated, graphs that are not shown depict the same type of patterns across all simulations. Model results are daily averaged.
4.1. Forcing Functions
[image:8.612.180.407.243.428.2]Forcing time series with daily frequency, except for radiation data that are presented with 6 h frequency, are shown in Figure 2. During the simulation period, there were nine storm events [Cohen et al., 2017] indicated by the gray shaded areas in Figure 2a. Wind speed and air temperature ranged between 1.6 and 14.1 m s1 and between 20.2 and +0.8°C, respectively (Figure 2a). Snow precipitation varied between 0 and 9.2 × 10² kg m2s1, and specific humidity varied between 6 × 10⁴ and 4 × 10³ kg1(Figure 2b). Incident short and longwave radiations were in the ranges 0–500 and 170–310 W m2, respectively (Figure 2c). Horizontal water velocity relative to the icefloe, measured at 1 m depth, varied from 0 to 0.22 m s1(Figure 2d). SST was between1.9 and 0.6°C (Figure 2e). Daily heatfluxes at 1 m below the ice-ocean interface, measured with the TIC, ranged from slightly positive values to180 W m2(Figure 2e).
Here the negative sign indicates an upwardflux, following CICE convention. Salinity varied between 33.6 and 34.3, at the surface, whereas nitrate and silicic acid varied between 0.4 and 10.4μM and between 2.4 and 4.2μM, respectively (Figure 2f).
4.2. Refrozen Lead
Measured ice thicknesses of RL reached 0.27 m [Kauko et al., 2017]. Measurements began approximately a week after ice started to build up in the lead that opened next to RVLance. Simulated ice thickness ranged from zero, on the date corresponding to the opening of the lead (24 April), and a maximum in excess of 0.3 m, with a positive bias of up to 0.05 m (Figure 3). Minimum ice buildup is forecasted when assuming hmix variable and equal to the MLD (not shown), with frazil ice forming only on 9 May. Using hmix values<15 m leads to overestimation of ice melting toward the end of the simulation (not shown). Model performance is poor regarding ME and good for both |Pbias| and CF. RMSE was 0.05 m, andr2implies that the model explains 45% of the data variability (Table 2).
[image:9.612.40.581.128.454.2]Measured bulk salinities varied between 4.6 and 11.8. Observed and simulated salinities show a decreasing trend over the study period. Model performance is poor regarding ME, very good for |Pbias|, and good for CF. RMSE is 1.78 andr20.77 (Table 2). Shortwave transmittance simulated by the model is in accordance with measured values and around 0.2 [Kauko et al., 2017] (not shown).
Table 2. Model Performance for the Simulations Synthesized in Table 1 and for Selected State Variables According to the Nash Sutcliffe Model Efficiency (ME) [Nash and Sutcliffe, 1970], the Absolute Value of the Percentage Model Bias |Pbias|, the Cost Function (CF) [OSPAR Commission, 1998], the Root-Mean-Square Error (RMSE), and ther2a
Simulations Variables ME |Pbias| CF RMSE r2
RL_Sim_1 Ice thickness Poor (1.45) Good (21.79) Good (1.30) 0.05 0.45
Vertically averaged salinity Poor (0.48) Very good (19.78) Good (1.00) 1.78 0.77
Vertically averaged ice algal Chlaconcentration Poor (0.32) Poor (57.94) Very good (0.85) 2.83 0.71 Top ice algal Chlaconcentration Poor (6.52) Poor (90.28) Reasonable (2.45) 1.50 0.85
Bottom ice algal Chlaconcentration Poor (1.52) Poor (73.63) Good (1.35) 6.97 0.77
Chlastanding stock Poor (0.27) Poor (55.4) Very good (0.82) 0.64 0.58
RL_Sim_2 Vertically averaged ice algal Chlaconcentration Good (0.23) Poor (42.26) Very good (0.62) 2.17 0.72 Top ice algal Chlaconcentration Poor (5.51) Poor (85.16) Reasonable (2.31) 1.40 0.93
Bottom ice algal Chlaconcentration Poor (1.00) Poor (66.06) Good (1.21) 6.21 0.74
Chlastanding stock Good (0.27) Poor (42.08) Very good (0.63) 0.48 0.56
RL_Sim_3 Vertically averaged ice algal Chlaconcentration Good (0.47) Good (38.70) Very good (0.57) 1.79 0.66 Top ice algal Chlaconcentration Poor (6.36) Poor (88.78) Reasonable (2.41) 1.49 0.64 Bottom ice algal Chlaconcentration Poor (0.05) Poor (45.81) Very good (0.84) 4.26 0.81
Chlastanding stock Good (0.42) Poor (42.54) Very good (0.63) 0.43 0.46
RL_Sim_4 Vertically averaged ice algal Chlaconcentration Poor (0.01) Poor (48.88) Very good (0.72) 2.46 0.69 Top ice algal Chlaconcentration Poor (6.35) Poor (88.81) Reasonable (2.41) 1.48 0.71
Bottom ice algal Chlaconcentration Poor (0.90) Poor (63.74) Good (1.17) 6.06 0.79
Chlastanding stock Poor (0.04) Poor (48.60) Very good (0.72) 0.55 0.52
RL_Sim_5 Vertically averaged ice algal Chlaconcentration Excellent (0.66) Good (35.22) Very good (0.52) 1.43 0.67 Top ice algal Chlaconcentration Poor (5.42) Poor (84.45) Reasonable (2.30) 1.39 0.89 Bottom ice algal Chlaconcentration Poor (0.18) Poor (40.14) Very good (0.74) 3.98 0.81
Chlastanding stock Very good (0.54) Good (37.71) Very good (0.56) 0.38 0.55
SYI/IMB Vertically resolved temperature Excellent (0.81) Excellent (9.89) Very good (0.36) 0.47 0.96
SYI_Sim_1 Chlastanding stock Good (0.36) Good (25.05) Very good (0.62) 0.56 0.86
Vertically resolved ice algal Chlaconcentration Poor (0.27) Poor (56.75) Very good (0.73) 1.15 0.00
SYI_Sim_2 Chlastanding stock Good (0.40) Good (24.40) Very good (0.61) 0.54 0.85
Vertically resolved ice algal Chlaconcentration Poor (0.01) Poor (50.29) Very good (0.65) 1.02 0.02
SYI_Sim_3 Chlastanding stock Good (0.38) Good (25.00) Very good (0.62) 0.55 0.69
Vertically resolved ice algal Chlaconcentration Poor (1.22) Poor (77.67) Good (1.00) 1.52 0.00
SYI_Sim_4 Chlastanding stock Excellent (0.78) Very good (14.73) Very good (0.37) 0.32 0.94
Vertically resolved model outputs for sea ice bulk salinity show a sharp increase toward the bottom, with sali-nities up to 32.6, a slight increase near the top and with an almost uniform profile by the end. Minimum values (~5) are roughly midway between top and bottom ice (Figure 4a). During the period of ice melt, bot-tom salinity decreases to<10. Simulated sea ice temperature is between11.5 and0.4°C. Temperature increases from the ice top toward the bottom until 14 May when the air temperature became higher. Subsequently, there are two sea ice warming events that are in parallel with peaks in air temperature (Figures 2a and 4b). During these periods vertical temperature gradients fade away. After 24 May, the tem-perature gradient becomes opposite to that observed during the period of ice growth (between 24 April and 14 May), with surface values close to 0°C following the increase in air temperature (Figure 2a). Modeled nitrate concentrations are maximal at bottom ice with values of up to 5.8μM and correlate with the evolution of measured sea-water values during the period of ice growth (Figures 2f and 4c). The model simulates an increase in ice algae at the ice bottom after the onset of melting toward the end of the simula-tion period, with concentrasimula-tions in excess of 50.0 mg Chlam3. Model-calculated silicic acid concentrations are strongly reduced by biogeochemical activity as seen when contrasting two simulations with and without biogeochemical uptake of silicic acid, respectively (Figures 4e and 4f). A similar comparison for nitrate shows no significant differences (not shown). The color patterns of Figures 4c and 4f show the time-dependent vertical extent of the biological grid (biogrid) of CICE. Vertical transport equations for biogeochemical
tracers are defined only where brine is present [Jeffery et al., 2016]. The brine network extends roughly from 0.05 m from the ice top, at the beginning of the simulation, and almost from 0.15 m, toward the end, until the ice bottom. Brine nutrient concentrations (including ammonium) are shown in Figure S1 in the supporting information with values ranging from near 0 to 1 order of magnitude higher than maximal bulk values (Figure 4).
Limiting factor values for light intensity, temperature, nitrogen (ammonium + nitrate), and silicic acid concentrations in the brine (Figure 5), in the RL standard simulation (Table 1), vary between zero (maximum limitation) and one (no limitation), with lowest values/higher limitation for silicic acid, especially after 14 April, when ice algae concentration begins to increase. The upper regions of the graphs with zero values for all limiting factors correspond to the ice levels that are above the CICE biogrid and where there is no brine network.
[image:11.612.179.574.93.362.2]standing stocks (vertically integrated Chlaconcentrations) and net primary production (NPP) are shown only for RL_Sim_1 and RL_Sim_5 (Figure 6d). In both cases the standing stock increases steeply, followed by a plateau, with a slightly negative trend. Observed standing stocks have a very large scatter but are comparable with RL_Sim_5 results. Sharp and narrow NPP peaks match the increase of the standing stocks. Model skill patterns for Chla standing stocks are expectably comparable to those for vertically averaged Chla(Table 2). However, the former are also influenced by any bias in simulated brine volume vertical distribution.
4.3. Second-Year Ice/Ice Mass Balance Buoy
IMB data for SYI show a depth-gradient trend in the sea ice temperature profile, with values increasing from the low atmospheric temperatures to warmer ocean levels. This gradient decreases during the measurement period (Figure 7a), and the ice becomes nearly isothermal at the end of the time series. Similar trends are reproduced by the model (Figure 7b). The observations and the model also show a gradual warming from the atmosphere connected to the positive air temperatures toward the end of the time series. Model perfor-mance for vertically resolved sea ice temperature is the best of all shown in Table 2 and is between very good for the CF and excellent for ME and |Pbias|.
4.4. Second-Year Ice/Main Coring Site
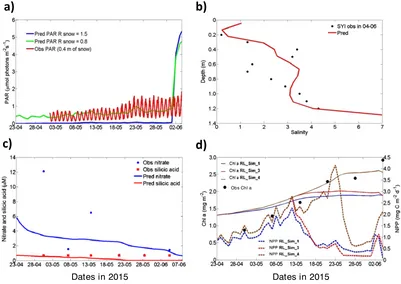
[image:12.612.105.509.90.377.2]The model baseline simulation underestimates irradiance below the sea ice. Changing the default value of the sigma coefficient for snow grain (R_snow)—a delta-Eddington parameter that gives the standard deviation of the snow grain size [Urrego-Blanco et al., 2016]—has a strong effect on simulated light intensity. The bestfit was obtained with R_snow = 0.8 (Figure 8a). Therefore, this value was used in the SYI simulations. For most of the simulation period, ice-transmitted PAR was<2μmol photons m2s1[Taskjelle et al., 2016]. The model calculates a considerable increase in under-ice PAR toward the end of the simulation when melting occurred.
Salinity measurements show a large scatter, making it difficult to properly assess model performance. In spite of that, model results are within the range of observations before the onset of melting. Also, the simulated vertical gra-dients are similar to those observed (Figure 8b). Modeled and observed silicic acid at the bottom 10 cm of SYI exhibit very low values <1.0 μM that are very close to the detection limit of the method used for silicic acid quantifi -cation (0.7μM) [Grasshoff, 1965], reason why measures of model skill were not applied here. For nitrate, model results are within the range of the few observa-tions available (Figure 8c).
Chlastanding stocks and net primary production (NPP) are shown for SYI_Sim_1, 3, and 4 (Figure 8d). In all cases the standing stock increases, followed by a plateau, with a slightly positive trend in SYI_Sim_4, before a
final decline. Simulated standing stocks underestimate observations toward the end of the simulated period with the exception of SYI_Sim_4, which shows a later and higher NPP maximum. NPP peaks match the increase of the stand-ing stocks. More or less, recruitment has no effects on the model outputs because SYI contains Chl a in excess relative to that assumed for the ocean. Model performance for Chlastanding stocks is between good for ME and |Pbias|, very good for the CF for all simulations but SYI_Sim_4, where it is excellent for ME, and very good for the other two parameters (Table 2).
Vertically resolved model outputs for sea ice salinity show a relatively stable profile along the simulation period, except for the bottom layers where variability is larger. Salinity increases toward the bottom ice to values of 15 (Figure 9a). Temporal and vertical variabilities and ranges in sea ice temperature (Figure 9b) are very similar to what was described before for the SYI/IMB. Nitrate bulk concentrations (Figure 9c) are higher at the bottom ice and decrease to values<2μM toward the end of the simulation period, at the onset of ice melting. Silicic acid shows the most noticeable decrease over the simulation period (Figure 9d), espe-cially at intermediate layers where it decreases from 0.6–0.7μM to nearly zero values. Maximum values (close to 0.8μM) are observed at the bottom layer and the two layers closest to the ice top. A comparison between results obtained with and without biological uptake shows no significant differences in simulated nitrate concentrations but much larger silicic acid values in the former simulation (Figure S2). Observed Chlaranged between<0.1 and 9.0 mg m3. Maximum values were observed at ice bottom or within 0.2 m from the bottom (Figure 9e). On several occasions more than one peak of Chl a was observed. The model (SYI_Sim_1) calculates a slight increase in Chlavalues in the ice interior (approximately from 0.4 to 1.0 m from the ice upper surface) (Figure 9f). The simulated patterns are not similar to those observed. Implementation of random algal motion (SYI_Sim_2; Table 1) results in a considerable vertical displacement of the initial Chla
[image:13.612.179.410.92.432.2](Figure 9g). Using deterministic algal motion (SYI_Sim_3; Table 1) two maxima emerge at top and bottom ice (Figure 9h). Tests conducted with other model setups combined with deterministic algal motion also led to
more than one maximum, including one at the bottom ice. Model performance for vertically resolved Chla
concentration is poor for ME and |Pbias| and for all simulations. The results obtained with CF are between good and very good (Table 2).
The brine network extends roughly from ~0.05 to 0.1 m from the ice top until the ice bottom. Brine nutrient concentrations (including ammonium) are shown in Figure S3. Very high values are obtained for nitrate and silicic acid in the upper parts of the brine network, during an initial period of some ice growth, when air tem-perature remained<10°C (Figure 2a), with concentrations 3–4 orders of magnitude higher than maximal bulk values (Figures 9c and 9d).
Limiting factor values for light intensity, temperature, nitrogen (ammonia + nitrate), and silicic acid concen-trations in the brine (Figure 10) show lowest values for silicic acid, especially after 13 April, and for light inten-sity before the onset of snow and ice melt.
4.5. Energy Budgets
[image:14.612.173.574.91.375.2]Sea ice energy budgets computed from CICE results for the RL and for both SYI simulations are shown in Figure S4. In all cases, longwavefluxes are dominant, while down and upwardfluxes practically cancel each other out. The amount of shortwave radiation absorbed by the RL is higher than that absorbed by the thick ice due to the thick snow cover on the latter. In the RL case, there is a positive correlation with a time lag between latent heat exchanges, the net energy budget, and the ice/snow-atmosphere sensible heatfluxes. In the SYI cases, the magnitude of thesefluxes is much smaller, except after the onset of melting, when ice-ocean heatflux drives a large net positiveflux.
5. Discussion
5.1. Model Forcing and the Importance of Storms
[image:15.612.191.558.92.590.2]Model forcing time series showed large increases in wind speed and air temperature during or close to storm events (Figure 2a). The same applied to current velocities and ocean heat exchanges (Figures 2d and 2e). The importance of these events on the variability of atmospheric and oceanographic conditions has been dis-cussed inCohen et al.[2017],Meyer et al.[2017a, 2017b], andPeterson et al.[2017]. Storms transport heat
and moisture from lower latitudes, and the strong winds associated with them drive sea ice drift and upper ocean mixing, increasing the heatflux from the ocean by an order of magnitude with potential consequences for sea ice melting. Storms also cause sea ice divergence and the opening of leads such as the RL discussed here [Itkin et al., 2017].
Model results for the RL case, representative of new ice growth, showed the effects of storm events on sea ice thermodynamics in the form of two temperature peaks around May 19–20 (Figure 4b). This rapid ice warming is partly explained by low insulation due to the simulated snow accumulation (not shown) of just a few milli-meters, due to the low snow precipitation during the simulation period. The observed accumulation reached maximal values of 0.02–0.06 m [Kauko et al., 2017] but was very heterogeneous, presumably due to snow redistribution by wind.Jeffery and Hunke[2014] discussed the sensitivity of the ice physical state to snow cover and ran simulations with a prescribed snow fall to reproduce the observed snow cover and avoid the model bias caused by an inaccurate snow forecast. The insulating effect of snow explains the lack of warming“peaks”in the case of the SYI/IMB observations and model results (Figure 7). Here warming is strongly related to an increase in the ice-ocean heat exchanges as RVLancedrifted across the Yermak Plateau encountering warm Atlantic Water closer to the surface [Meyer et al., 2017a;Peterson et al., 2017]. The same applies to the SYI/coring case. In both SYI simulations, there is a small snow depth variability explained by the low snow fall rates. Observed variability was larger and likely related to wind redistribution, which is not taken into account in CICE.
[image:16.612.178.576.92.371.2]The relatively high air temperature, precipitation, and specific humidity associated with the storm event that took place between 14 and 19 May (Figure 2a) contributed to reduced latent heat losses from the RL in two occasions during the mentioned period (see the two peaks of the red line in Figure S4a), leading to an increase in the net energy budget from negative to slightly positive, ice warming (Figure 4b) and an increase in sensible heat losses to the atmosphere. Therefore, one of thefluxes of smaller magnitude may have a determinant effect in shifting the net energy budget from negative to positive. The magnitude of the
ice-ocean heat exchanges increased both in the RL and the SYI simulations at the end of June. Also, slightly positive air temperatures explain some snow melting that leads to an increase in absorbed shortwave radia-tion in the SYI cases. The downward migraradia-tion of the brine channel network in the RL resultedfirst from the low temperatures at the ice top and, at a later stage, from refreezing of melted snow ice. RL warming events in mid-May were driven by atmospheric forcing, while those at the beginning of June were ocean driven. The former are not apparent in the SYI simulations due to snow insulation. The impact of these sudden warming events on biogeochemical processes is not yet well understood. However, by changing ice temperature, they may have implications on ice salinity, density, and on the brine channel network, thereby influencing the exchange of nutrients and the organisms depending on them.
5.2. Sea Ice Thickness and Salinity
The results presented in Table 2 concerning model performance suggest that the CF is too optimistic in classifying all model results between reasonable and very good. Ice thickness seemed adequately repro-duced for both the RL and the SYI/IMB cases (Figures 3a and 7). However, ME values show that model error is relatively large when compared with data variability (Table 2). On the other hand, model bias is relatively low and the RMSE is small (5 cm). Considering this somewhat controversial evidence from the various measures of model skill and the graphical model output, one is tempted to classify model results as, at least, reasonable.
Model-calculated ice thickness, heat exchanges, and melt rates are quite sensitive to surface current velocity, which is used to compute the heat transfer coefficient in the CICE model [Hunke et al., 2015]. Simulations per-formed without the effects of current velocity underestimated ice melting (not shown). The timing of frazil-ice formation and initiation of frazil-ice growth in the RL case was quite sensitive to the depth of hmix (not shown) due to the time required to cool down the water to the freezing temperature. Depending on the vertical reso-lution of circulation models coupled with CICE, some positive bias may be anticipated in the time required for freezing open leads if the surface model layer is very thick. These small-scale processes may be quite impor-tant not only for simulations of the energy budget of the Arctic Ocean but also for biogeochemical processes. Indeed, refrozen leads that are covered with thin ice and a thin snow layer have a different thermodynamic behavior than thick ice with thick snow cover, as shown in Figure S4. They also act as“windows”allowing greater penetration of shortwave radiation into the water column compared to the thicker snow-covered ice [Kauko et al., 2017], with local enhancement of phytoplankton primary production in the water column [Assmy et al., 2017]. Observations and sampling conducted by divers under the RL identified assemblages of ice algae covering submerged ice blocks and some vertical ice walls at pressure ridges that had formed at the transition zone between the RL and the thicker ice. Also, empirical data show that Chlaconcentration grew rapidly in thin ice from early May to the beginning of June (Figure 6b) [Kauko et al., 2017], and estimated growth rates were up to 0.27 divisions per day [Olsen et al., 2017].
between vertical profiles. Such a comparison was done for SYI (Figure 8b), but it is not conclusive given the scatter of some data points.
5.3. Sea Ice Biogeochemistry
RL simulations showed a negative bias in bottom nutrient concentrations with nitrate lower than observed on 5 May (Figure 6a). However, the relatively high observed values are counter intuitive because the same brine exchanges responsible for desalinization (Figure 3b) force nutrient exchanges between the seawater and the ice. These exchanges cannot lead to bulk ice concentrations as high as seawater concentrations since only the brine volume is exchanged. Therefore, nutrient concentrations should scale with salinity in the absence of biological consumption. In the presence of ice algal growth, nutrient concentrations should be even lower, unless recycling could compensate for consumption. However, it seems rather unlikely that recycling could raise bulk concentrations above sea-water values, unless there was a large reserve of organic matter in the ice—very unlikely in newly formed ice. Another way to conciliate observed ice bulk nitrate concentrations with observed and simulated desalinization (Figure 3b) is by means of some differential retention mechanism of nitrate within the brine network as suggested for ammonium in Antarctic sea ice that appears to be efficiently adsorbed onto organic matter, with likely consequences to its mobility and availability [Fripiat et al., 2017]. Thus, the comparatively high observed bulk concentrations of nitrate in the RL remain to be explained.
Silicic acid concentrations at bottom ice drop to nearly zero in the RL simulations a short while after the onset of algal growth, around 19 May (Figures 6a–6c). The strong effect of biological uptake on silicic acid is empha-sized by the differences between Figures 4e and 4f. The limiting effect of silicon (Figure 5d) stopped algal growth in the RL simulations, even after reducing the effect of the silicon limiting parameters (simulations RL_Sim_2, RL_Sim_3, and RL_Sim_5; Table 1). It can be argued that the increase in Chlastanding stock shown by the empirical data (Figure 6d) does not support the determining role of silicic acid in stopping the bloom. It is hard to explain the contradiction between simulated and observed data, considering the model parameter uncertainties and also the large variability of empirical data. The results presented in
Olsen et al.[2017] suggest that observed cell abundances in the RL cannot be explained solely by local growth, emphasizing the importance of seeding mechanisms. Therefore, it is important to study seeding and its relationship with some physical drivers for proper inclusion in ice algal models. The claim about silicon limitation is consistent with the reported diatom dominance in the RL [Olsen et al., 2017] and with the rela-tively high nitrate: silicic acid ratios in the water and in the ice, during thefirst half of the simulation period (Figures 2f and 6a). The nitrate decrease in the SYI/coring site simulation is dominated by desalinization and melting, whereas the silicon decrease is dominated by biological uptake (Figures 9c and 9d and S2). In the SYI, ice algae are limited by low light levels until the end of May, and afterward, silicon becomes more limiting (Figure 10). This is consistent with the observation that during the spring, ice algae are initially limited by light and later by nutrients [Cota et al., 1991;Leu et al., 2015].
The approaches described in the literature to simulate water-ice nutrient exchanges are based on different diffusive or advective mechanisms.Arrigo et al.[1993] separated nutrient exchanges due to gravity drainage, occurring in brine channels at an assumed constant speed, from brine convection in the skeletal layer, depen-dent on ice growth rate through a relationship proposed byWakatsuchi and Ono[1983]. In both cases, brine
fluxes were used to compute nutrient exchanges as a diffusive process.Lavoie et al.[2005] computed nutrient exchanges across the skeletal layer with a diffusion equation.Jin et al.[2006, 2008] used the equation by
this study includes brine convection and molecular diffusion as mixing mechanisms.Jeffery et al.[2011] com-pared the performance of the mixing length diffusion method with enhanced molecular diffusion (EMD) and found that the former method performed better than the latter by responding to ice growth rates. When these increase, brine production also increases leading to a rise in density instability and in mixing length dif-fusivity, while EMD diffusivity is constant. The use of brine drainage methods parameterized as a function of vertical density instabilities makes sense regarding the physics, but possibly, there is still room for EMD to be used not as a brine transport and desalinization mechanism but as a complementary process promoting exchanges at the bottom ice that works as a function of concentration gradients even in the absence of sig-nificant brine drainage. Ideally, diffusivity should be parameterized as a function of current shear in the same way as used to compute the heat transfer coefficient in the CICE model.
Empirical and model data synthetized in Figures 6b and 8d suggest that the bloom took place a few days later in the RL than it did in the SYI. This delay may be explained by the time needed for algae to recruit from the ocean to the RL and reach a standing stock large enough to produce a bloom, whereas such a stock, probably of overwintering algae, was available at the upper ice layers of the SYI at the beginning of the simulated per-iod [Olsen et al., 2017]. The steady increase in observed Chlastanding stocks that lasted until the beginning of June, after some melting took place, was unexpected, since other studies in the Arctic have suggested that after melting, there is a rapidflushing of ice algae, with Chlaconcentrations dropping rapidly to near zero values [Leu et al., 2015]. Therefore, it may be hypothesized that ice algae may cope with some melting still being able to increase their biomasses, possibly taking advantage of more light availability with decreasing ice and snow thickness. This suggests that the CICE parameterization that takes into account the motility of diatoms (see section 2.2) is consistent with observations. In fact, preliminary simulations without consider-ing ice algal motility lead to the loss of Chlatoward the end of the simulations in contrast with observations. In spite of this, the model calculated a steady increase of the ice algae standing stock until the beginning of June only for the SYI—silicon limitation became the dominant factor in the RL simulation. Considering all simulations, model average vertically integrated NPP was in the ranges 0.5–1.0 and 1.0–1.8 mg C m2d1 for the RL and SYI, respectively. These values are well within ranges reported in the literature [e.g.,Mock and Gradinger, 1999].
Model performance regarding vertically averaged Chlaconcentrations and Chlastanding stocks improved by lowering the Si:N ratio and reducing the half saturation constant for silicon uptake (Tables 1 and 2). Both for the RL and for the SYI, these parameter changes lead to quality levels between good and excellent. In what concerns vertically resolved Chlaconcentrations, model performance was much poorer.
5.4. Ice Algal Motility
The“deterministic”algorithm implemented in SYI_Sim_3 and SYI_Sim_4 resulted in vertical Chlaprofiles with more than one maxima (Figure 9h) similar to patterns shown in empirical data (Figure 9e) and reported in more detail inOlsen et al.[2017]. Algal motion was driven by an optimization search at a realistic speed, and migration toward the bottom led to access to higher nitrogen concentrations. However, this is a good strat-egy for part of the algae but not for all of them, depending on environmental gradients in their proximity. Therefore, some algae remained or moved closer to the ice top, where silicon and light limitations are milder (Figure 10d). The direction of the motion depends on which factors are more limiting at various depths in the ice. Figures 10c and 10d show that both nitrogen and silicon limitation are milder at ice bottom and top. In the former case this is due to exchanges between the ice and the sea, and in the latter case, it is explained by the very high brine concentrations (Figure S3) and their low utilization due to very low Chla concentra-tions at the top layers, for most of the simulation period (Figure 9h).
5.5. Final Remarks
It is well established that the parameters controlling the relationship between primary production and irra-diance change at variable time scales as result of adjustments of the photosynthetic apparatus to different light regimes. Chlaper cell may increase 5 to 10 times as irradiance decreases, alleviating light limitation at low irradiances [Falkowski and Wirick, 1981;Falkowski and Raven, 1997]. If this plasticity is not taken into account in the production-irradiance relationship of ice algal models, it is more difficult to properly reproduce algal growth under strikingly different light environments such as the refrozen lead with thin snow cover and thicker ice with thick snow encountered during this study. Moreover, this plasticity has consequences for the total amount of chlorophyll and the comparisons between observed and simulated surrogates of ice algal biomass. This is why some ecosystem models treat Chlaas a prognostic variable [e.g.,Fennel et al., 2006;
Vichi et al., 2007]. In line with the above reasoning, we note that the highest Chlavalues observed under SYI correspond to some of the lowest observed particulate organic carbon (POC) and PON values (data not shown). In spite of the fact that POC/PON includes not only ice algae, it is tempting to speculate that the rea-son for the apparent discrepancy could be a high Chlacontent per cell as a response to low irradiances. Whatever tuning of ice algal physiological parameters may be attempted, it is difficult to properly reproduce growth under very different light environments without considering the effects of light acclimation. In fact, while for the RL one would expect a reduction in photosynthetic efficiency as a result of acclimation to high light, the opposite would make more sense for the thick ice and snow under which light levels are very low (Figure 8a). All things considered, we hypothesize that the CICE biogeochemical submodel would benefit from the incorporation of Chladynamics followingFennel et al.[2006] andVichi et al.[2007].
This work does not include a thorough sensitivity analysis, which generally implies changing each parameter at a time, running the model and comparing the results with a reference simulation. However, as already noted byUrrego-Blanco et al.[2016], such an approach cannot identify interactions among parameters and assumes linearity and additivity. The same authors used a global variance approach with Sobol sequences to efficiently sample the parameter space of the CICE model. This method provided a thorough analysis of the CICE model sensitivity to physical parameters [Urrego-Blanco et al., 2016]. A comparative analysis includ-ing the biogeochemical parameters is beyond the scope of the present work but would certainly shed light over the complex synergies among these parameters and their interactions with physical processes. This study is a relatively thorough evaluation of a sea ice model at thefloe scale, covering physical, chemical, and biological variables and using a comprehensive data set of forcing functions with high temporal resolu-tion. In spite of that, there are limitations in the available data not allowing for an exhaustive analysis of model performance with the same degree of detail for all variables and for the different types of ice. These limitations include the low frequency for some observations, such as vertical salinity profiles in SYI and sea ice bulk nutrient concentrations in the RL, and the lack of replication of SYI data. This last limitation makes it difficult to evaluate how much of the Chlavariability observed over the simulated period (Figure 9e) is due to temporal or to spatial trends. Overall, model performance is poor for vertically resolved Chla concen-trations and between good and excellent for vertically averaged Chlaconcentrations and Chlastanding stocks, depending on some parameter tuning. In what concerns ice thickness and vertically averaged salinity the model does reasonably well, with a relatively low bias. The best performance is for vertically resolved sea ice temperature showing that model thermodynamics performs very well.
The obtained results suggest fundamental differences between pack ice with a thick snow cover and refrozen leads in what concerns ice algal bloom dynamics. In the former, blooms have the following characteristics (see alsoOlsen et al.[2017]): (i) sustained for a longer period due to a higher nutrient“buffer”and a strong light limitation; (ii) possibly seeded from overwintering ice algae at the upper ice layers; (iii) with possibly sev-eral Chlamaximum along the vertical, likely resulting from algal motion as a function of limiting factor gra-dients; and (iv) higher vertically integrated NPP as a result of larger standing stocks of ice algae. In the latter, blooms are characterized by (i) rapid nutrient exhaustion, as a result of fast nonlight limited algal growth; (ii) total dependence on recruitment from the water column; and (iii) only one Chlamaximum located at bottom ice to overcome nutrient limitation.
Phytoplankton blooms beneath snow-covered ice might become more frequent and widespread in the future Arctic Ocean with more lead formation due to thinner and more dynamic ice cover [Assmy et al., 2017]. The results presented in this work suggest that higher maximal ice algal growth rates in thin ice lead to not only more pronounced blooms (sharper bloom peak) but also earlier nutrient exhaustion in the high-biomass ice bottom layer (shorter blooms), which might result in a reduction in ice algal vertically integrated NPP and standing stocks (per m2) in thin ice relative to what is observed in thicker ice, with an overwintering standing stock of ice algae. This would lead to important effects on marine food webs and carbon sequestration.
6. Conclusions
Considering the questions behind this study and results obtained, we emphasize the following points: (i) it is possible to simulate reasonably well sea ice thickness and bulk salinity and to simulate very well vertically resolved temperature at time scales of a few weeks, with minimum parameter tuning when a complete for-cing data set of atmospheric and oceanographic conditions is available; (ii) model accuracy is good for verti-cally averaged Chlaconcentrations and Chlastanding stocks depending on parameter tuning and poor for vertically resolved Chlaconcentrations; (iii) improving current knowledge about the mechanisms of nutrient exchanges at the sea ice-ocean interface, ice algal recruitment, and motion within the brine matrix is critical to improve sea ice biogeochemical modeling; (iv) ice algae may bloom despite some degree of bottom melt-ing, presumably avoidingflushing due to their motility; (v) ice algal motility driven by gradients in limiting factors is a plausible mechanism to explain their vertical distribution; (vi) different ice algal bloom and NPP patterns were identified in the ice types studied, suggesting that ice algal growth rates may be higher in RLs than in thicker SYI with a thick snow cover but vertically integrated NPP and biomasses are larger in the latter than in the former; and (vii) these differences combined with the expected increasing trend in the frequency of refrozen leads may impact Arctic Ocean primary production with possible effects on marine food webs and carbon sequestration.
References
Allen, J. I., J. T. Holt, J. Blackford, and R. Proctor (2007), Error quantification of a high resolution coupled hydrodynamic-ecosystem coastal-ocean model: Part 2. Chlorophyll-a, nutrients and SPM,J. Mar. Syst.,68, 381–404.
Ardyna, M., M. Babin, M. Gosselin, E. Devred, L. Rainville, and J.-É. Tremblay (2014), Recent Arctic Ocean sea ice loss triggers novel fall phytoplankton blooms,Geophys. Res. Lett.,41, 6207–6212, doi:10.1002/2014GL061047.
Arrigo, K. R., and C. W. Sullivan (1994), A high resolution bio-optical model of microalgal growth: Tests using sea-ice algal community time-series data,Limnol. Oceanogr.,39, 609–631.
Arrigo, K. R., J. N. Kremer, and C. W. Sullivan (1993), A simulated Antarctic fast ice ecosystem,J. Geophys. Res.,98, 6926–6946.
Arrigo, K. R., and G. L. van Dijken (2015), Continued increases in Arctic Ocean primary production,Prog. Oceanogr.,136, 60–70.
Assmy, P., et al. (2016), N-ICE2015 water column biogeochemistry [data set], Norwegian Polar Institute. [Available at https://doi.org/ 10.21334/npolar.2016.3ebb7f64.]
Assmy, P., et al. (2017), Leads in Arctic pack ice enable early phytoplankton blooms below snow covered sea ice,Sci. Rep.,7, 40850, doi:10.1038/srep40850.
Aumack, C. F., A. R. Juhl, and C. Krembs (2014), Diatom vertical migration within land-fast Arctic sea ice,J. Marine Sys.,139, 496–504.
Barber, D. G., et al. (2015), Selected physical, biological and biogeochemical implications of a rapidly changing Arctic marginal ice zone,Prog. Oceanogr.,139, 122–150.
Brzrezinzki, M. A. (1985), The Si:C:N ratio of marine diatoms: Interspecific variability and the effect of some environmental variables,J. Phycol.,
21, 347–357.
Cohen, L., S. R. Hudson, V. P. Walden, and M. A. Granskog (2017), Meteorological conditions in a thinner Arctic sea ICE regime from winter through spring during the Norwegian young sea ICE expedition (N-ICE2015),J. Geophys. Res. Atmos.,122, doi:10.1002/2016JD026034. Convention for the Protection of the Marine Environment of the North-East Atlantic (OSPAR) Commission (1998), Report of the modelling
workshop on eutrophication issues,OSPAR Rep., 86 pp., Den Haag, Netherlands, 5–8 Nov. 1996.
Cota, G. F., L. Legendre, M. Gosselin, and R. G. Ingram (1991), Ecology of bottom ice algae: III. Comparative physiology,J. Mar. Syst.,2, 297–315. Cottier, F., H. Eicken, and P. Wadhams (1999), Linkages between salinity and brine channel distribution in young sea ice,J. Geophys. Res.,104,
15,859–15,871.
Döscher, R., T. Vihma, and E. Maksimovich (2014), Recent advances in understanding the Arctic climate system state and change from a sea ice perspective: A review,Atmos. Chem. Phys.,14, 13,571–13,600.
Duarte, P., P. Assmy, H. Hop, G. Spreen, S. Gerland, and S. R. Hudson (2015), The importance of vertical resolution in sea ice algae production models,J. Mar. Syst.,145, 69–90.
Elliott, S., C. Deal, G. Humphries, E. Hunke, N. Jeffery, M. Jin, M. Levasseur, and J. Stefels (2012), Pan-Arctic simulation of coupled nutrient-sulfur cycling due to sea ice biology: Preliminary results,J. Geophys. Res.,117, G01016, doi:10.1029/2011JG001649. Falkowski, P. G., and J. A. Raven (1997),Aquatic Photosynthesis, 375 pp., Blackwell Sci., London.
Falkowski, P. G., and C. D. Wirick (1981), A simulation model of the effects of vertical mixing on primary productivity,Matrix Biol.,65, 69–75.
Feltham, D. L., N. Untersteiner, J. S. Wettlaufer, and M. G. Worster (2006), Sea ice is a mushy layer,Geophys. Res. Lett.,33, L14501, doi:10.1029/ 2006GL026290.
Acknowledgments


![Table 2. Model Performance for the Simulations Synthesized in Table 1 and for Selected State Variables According to the Nash Sutcliffe Model Efand theand Sutcliffeficiency (ME) [Nash, 1970], the Absolute Value of the Percentage Model Bias |Pbias|, the Cost Function (CF) [OSPAR Commission, 1998], the Root-Mean-Square Error (RMSE), r2a](https://thumb-us.123doks.com/thumbv2/123dok_us/8404033.326274/9.612.40.581.128.454/performance-simulations-synthesized-variables-sutcliffe-sutcliffeciency-percentage-commission.webp)