Point Series Based Representation
Akadej Udomchaiporn1, Frans Coenen1, Marta Garc´ıa-Fi˜nana2, and Vanessa Sluming3
1
Department of Computer Science, University of Liverpool, Liverpool, UK
{akadej,coenen}@liv.ac.uk 2
Department of Biostatistics, University of Liverpool, Liverpool, UK
School of Health Science, University of Liverpool, Liverpool, UK
Abstract. This paper presents a procedure for the classification of 3-D objects in Magnetic Resonance Imaging (MRI) brain scan volumes. More specifically the classification of the left and right ventricles of the brain according to whether they feature epilepsy or not. The main con-tributions of the paper are two point series representation techniques to support the above: (i) Disc-based and (ii) Spoke-based. The proposed methods were evaluated using Support Vector Machine (SVM) and K-Nearest Neighbour (KNN) classifiers. The first required a feature space representation which was generated using Hough signature extraction. The second required some distance measure; the “warping path” distance generated using Dynamic Time Warping (DTW) curve comparison was used for this purpose. An epilepsy dataset used for evaluation purposes comprised 210 3-D MRI brain scans of which 105 were from “healthy” people and 105 from “epilepsy patients”. The results indicated that the proposed process can successfully be used to classify objects within 3-D data volumes.
Keywords: Image mining, Point series based representation, Image clas-sification, 3-D Magnetic Resonance Imaging (MRI).
1
Introduction
Image mining is concerned with the extraction of useful information and knowl-edge from image data. The representation of the raw image data in a format that allows for the effective and efficient application of data mining techniques is key to the success of applied image mining. The need for appropriate represen-tation is particularly acute with respect to 3-D image data because the size of 3-D image sets, in comparison with 2-D image sets, are significantly larger. An important challenge for 3-D image mining is thus the need for techniques that can cope with the large amount of data that has to be considered.
directed at some specific sub-image that exists across an image collection. In this paper ROI image mining is considered, more specifically 3-D ROI image min-ing, or Volume Of Interest (VOI) image mining. Two VOI image representation techniques are proposed: Disc-based and Spoke-based. Both are point series rep-resentation techniques where the 3-D volume of interest is captured in terms of a series of points referenced using a 2-D coordinate system so that the point series can be plotted as a curve. Using a K-Nearest Neighbour (KNN) technique point series derived from unlabelled images can be compared with point series from images where the label is known and consequently a label can be identified for the new image. With respect to the work described in this paper the “warping path” distance, generated using Dynamic Time warping curve comparison [1], is proposed as an appropriate KNN distance measure. Alternatively the curves can be processed further so that a feature vector representation is generated compat-ible with standard classifier generation techniques. In this paper it is suggested that Hough signature extraction [5] be used for this purpose. Both approaches are explored in this paper.
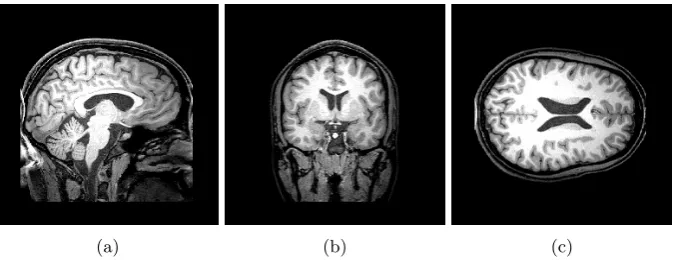
To act as a focus for the work 3-D Magnetic Resonance Imaging (MRI) brain scan data was used. The 3-D MRI scans consisted of a sequence of 2-D “slices” in three planes: Sagittal (SAG), Coronal (COR), and Transverse (TRA). The VOIs in this case were the lateral (left and right) ventricles. The ventricles are fluid-filled open spaces at the centre of the brain; there are four ventricles in a human brain, but in this paper only the lateral ventricles are considered. Examples of a number of 3-D MRI brain scan slices, one in each plane, are shown in Figure 1 where the lateral ventricles are the dark areas at the centre of the brain.
The rest of the paper is organised as follows. Section 2 describes the point series generation process. This is followed in Section 3 with a description of the suggested classification processes to be adopted. The experimental set-up and the evaluation of the proposed techniques is then presented in Section 4. Finally, the paper is summarised in Section 5.
[image:2.595.140.479.484.614.2](a) (b) (c)
2
Point Series Model Generation
[image:3.595.134.478.261.294.2]The proposed point series model generation process is illustrated in Figure 2. From the figure it can be seen that a segmentation process is first applied to the raw MRI brain scan data so as to identify the objects of interest (the left and right lateral ventricles). The authors’ thresholding technique, described in [8], was used for this purpose. Next point series curves were generated to represent the identified ventricles. This process is the central contribution of this paper and is described in detail in Sub-section 2.1. The next step is the extraction of signatures from the generated curves. This was done using Hough signature extraction [5] which is described further in Sub-section 3.
Fig. 2: Point series generation process (rectangular shapes indicate processes)
2.1 Point Series Generation
The two techniques whereby a given object can be defined in terms of a point series are presented in this section: (i) Disc-based and (ii) Spoke-based. The input for both is a binary-valued point cloud where the voxels are labelled as being either black (belonging to the object of interests) or white (not part of the object of interest). The output in both cases was a set of point series curves describing the object of interest. In total six curves were generated for each MRI image, three describing the left ventricle and three the right ventricle. For each ventricle (left and right) one curve was generated with respect to each plane: (i) Sagittal (xy), (ii) Coronal (yz) and (iii) Transverse (xz). The distinction between the two techniques is how the curves are generated.
Disc-based Representation Technique The Disc-based representation was founded on the idea of collecting point series data by considering a sequence of slices slice by slice (in some dimension) and collecting point information from the boundary where each slice and the object of interest intersect. The intersection is usually described by a circular shape hence the technique is referred to as the Disc based technique. The technique is illustrated in Figure 3. The point series generation process using the Disc-based technique is as follows:
1. Find the geometric centroid of the ventricle under consideration (left or right).
2. Define a slice and calculate the distance from the identified centroid to the boundary points (voxels) describing the edge of the disc obtained from the intersection of the slice and the point cloud representing the ventricle. 3. Move the slice one pixel along the selected axis and repeat (2) until the entire
object has been defined.
Spoke-based Representation Technique The Spoke-based representation techniques is illustrated in Figure 4. The technique involves measuring the dis-tance from the geometric centroid of the object of interest to points on the boundary, in a given plane. The effect is that of a sequence of spokes of different length radiating from the centroid hence the name of the technique. A point series curve is again generated which can be plotted as a curve with distance (length of spoke) plotted along the Y-axis and the sequential point number on the X-axis. The generation process is as follows:
1. Finding the centroid of the ventricle.
2. Generate a spoke, in some pre-define plane, radiating from the centroid to the edge of the object of interest (a ventricle in our case) and measure and record its length.
3. Repeat (2) with a new spoke generated by rotating the previous spoke by an angle ofθ◦. Continue in this manner until all 360◦ have been covered. 4. Use the collected distances to define a curve (point series) with
spoke-distance along the Y-axis and the sequential point number along the X-axis.
Fig. 3: The Disc-based technique Fig. 4: The Spoke-based technique
3
The Classification Process
Once the set of curves defining the object of interest had been identified these can be used directly to classify unseen data using a KNN style classification approach [2]. Alternatively the curves can be processed further to create a vector space model. The first required some kind of measure to determine the similarity between curves in the curve base and a new unseen curve. To this end Dynamic Time Warping (DTW) was used [1]. The second required some mechanism for generating the desired feature space. A signature based approach, founded on Hough signature extraction [5], is advocated in this paper.
A signature is a set of feature values that can be used to describe some entity, a curve in our case. The feature values encompassed by a set of signatures thus describe a feature space. The desired signature generation was achieved using Hough signature extraction [5] which in turn is founded on the Hough Transform. The Hough Transform is a parameter-based transformation derived from the Hough Concept. The process commences by transforming the curves into a parameter space (accumulator matrix) A, comprised of m rows and n columns where m is the difference between minimum and maximum collected distance andnis the total number of points on the point series. The process for generating a signature from an accumulator matrix is described in [9]. After this process, the extracted signatures were stored together with an associated class label to which any established classifier generation mechanism could be applied.
4
Experimentation and Evaluation
This section described the experimental set up and the evaluation of the pro-posed process described above. The experimentation were designed to compare the operation of both the Disc-based and Spoke-based point series generation technique coupled with both KNN direct classification (using DTW) and Hough signature extraction (using SVM). With respect to the Spoke-based 3-D repre-sentation technique for different spoke spacings were considered ({1◦,2◦,3◦,4◦}), thus four distinct point series were generated in this case. Ten-fold Cross Vali-dation (TCV) was used through out. The SVM implementation available from the Waikato Environment Knowledge Analysis (WEKA) data mining workbench [4] was adopted. The image set used for evaluation purposes was composed of 210 MRI volumes obtained from the Magnetic Resonance and Image Analysis Research Centre at the University of Liverpool. Each scan consists of 256 slices in three planes (thus 768 slices in all). The resolution of each image slice is 256 x 256 pixels with colour defined using 8-bit gray scale (256 colours). All the experiments were conducted using a 2.9 GHz Intel Core i7 with 8GB RAM on OS X (10.9) operating system.
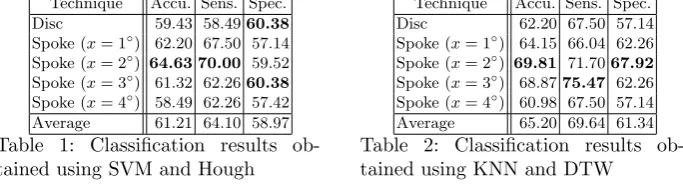
Technique Accu. Sens. Spec.
Disc 59.43 58.4960.38
[image:5.595.137.479.514.606.2]Spoke (x= 1◦) 62.20 67.50 57.14 Spoke (x= 2◦) 64.63 70.00 59.52 Spoke (x= 3◦) 61.32 62.2660.38 Spoke (x= 4◦) 58.49 62.26 57.42 Average 61.21 64.10 58.97
Table 1: Classification results ob-tained using SVM and Hough
Technique Accu. Sens. Spec.
Disc 62.20 67.50 57.14
Spoke (x= 1◦) 64.15 66.04 62.26 Spoke (x= 2◦) 69.81 71.7067.92
Spoke (x= 3◦) 68.8775.47 62.26 Spoke (x= 4◦) 60.98 67.50 57.14 Average 65.20 69.64 61.34
Table 2: Classification results ob-tained using KNN and DTW
Hough signature extraction the best classification accuracy and sensitivity were obtained using the Spoke-based image representation with a spoke spacing of 2◦, while the best classification specificity was obtained using a spacing of 3◦. With respect to the KNN approach, from Table 2 it can be seen that the best classification accuracy and specificity were again obtained using the Spoke-based approach with a spacing of 2◦, while the best sensitivity was again obtained
us-ing the Spoke-based approach and a spacus-ing of 3◦. When using the Spoke based
[image:6.595.201.417.317.448.2]approach the classification accuracy, regardless of the technique adopted, tended to peak when using a spacing 2◦and then decreased when the spacing increased. It was conjectured that this was because as the representation got coarser details concerning the shape of the ventricles began to be missed, while at lower levels of spacing the amount of detail collected tended to clutter the representation. The relationship between classification accuracy and different spoke spacings is presented in Figure 5. On average the classification results obtained using KNN with DTW were slightly better than those obtained using SVM with Hough signature extraction in terms of all accuracy, sensitivity, and specificity.
Fig. 5: The Relation between classification accuracy and spoke spacing when using the Spoke-based representation technique
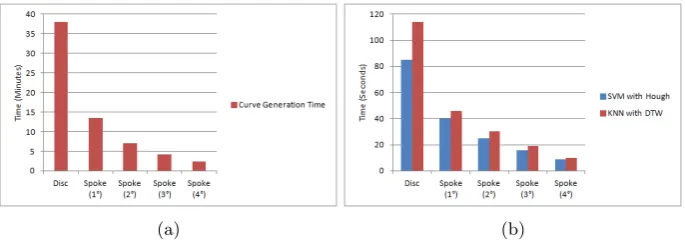
(a) (b)
Fig. 6: Performance for: (a) Curve generation; (b) Classification
[image:6.595.137.480.490.611.2]curve generation time and Figure 6b shows total classification time using Ten-fold Cross Validation (TCV). Note that the time complexity includes the Hough signature extraction process (for SVM) and Dynamic Time Warping process (for KNN). From the figure it can be seen that the Spoke-based representation technique (4◦) was the most efficient with respect to both curve generation and classification, while the Disc-based representation was the least efficient. This was because in the case of Spoke-based generation the point series contained fewer points than Disc-based generation. The number of point series for Spoke-based generation was constant for all ventricles (360 point series for 1◦, 180 for 2◦, 120 for 3◦ and 90 for 4◦) but varies depending to the size of the ventricles in the case of Disc-based representation (over a thousand point series for most ventricles).
5
Conclusions
Two classification motivated approaches to describing 3-D volumes have been described. A disc-based approach and a Spoke-based approach. Both resulted in a point series representation (a curve) describing a volume of interest. These curves can be used directly to classify new data using a KNN classification mechanism. Alternatively, the curves can be processed further so that a feature space representation is generated that is compatible with most standard classifier generation techniques. In the paper a Hough signature extraction mechanism was used to generate the desired feature vectors. In the reported evaluation SVM classification was used with respect to the feature space representation because earlier experiments had indicated that this produced the best results. For evaluation purposes the lateral ventricles within 3-D MRI brain scan data were used as the object of interest. The main findings were:
1. The Spoke-based representation technique, with a spacing of 2◦coupled with KNN (and the warping path obtained using DTW as the distance measure) produced the best result in term of classification accuracy.
2. The results obtained using the Spoke-based representation were, on aver-age, better than those obtained using the Disc-based representation. It is therefore concluded that the Spoke-based representation produced a bet-ter reflection of the shape of the labet-teral ventricles than in the case of the Disc-based representation.
3. The results obtained using KNN coupled with DTW tended, on average, to be better than the results obtained using Hough signature extraction coupled with SVM classification. It was conjectured that this was because the signature extraction process introduced a further level of complexity during which some information concerning the shape of the object of interest was lost.
which may be a better indicator of epilepsy. In the context of the authors own work the results reported in [8] which used the same dataset but coupled with an oct-tree representation technique the reported effectiveness was marginally bet-ter (a best accuracy of 72.34%) than those reported here, however the oct-tree technique was considerably less efficient than those reported in this paper (this is an important factor in the context of “time of consultation diagnosis”). The work reported in [6] also used an oct-tree representation technique and produced slighter better results (a best accuracy of 77.2% but using both the lateral and a “third ventricle”), however this work was directed at predicting Alzheimer’s disease and level of education (as opposed to epilepsy); the lateral and third ventricles may be better indicators of Alzheimer’s disease and level of education than epilepsy. The approach proposed by Long et al [6]. was also less efficient compared to the work reported here.
For future work the authors intend to focus on further alternative methods of representing 3-D MRI brain scan features so that machine learning techniques can be applied. The intention is also to consider the use of dynamic thresh-olding techniques, as used in [6], to determine whether this helps improve the effectiveness of the segmentation process.
References
1. R. Bellman and R. Kalaba. On Adaptive Control Processes. IRE Transactions on Automatic Control, 4(2), 1959.
2. G. Dougherty.Digital Image Processing for Medical Applications. Cambridge Press, 2009.
3. A. Elsayed, M. Hijazi, F. Coenen, M. Garc´ıa-Fi˜nana, V. Sluming, and Y. Zheng. Time Series Case Based Reasoning for Image Categorisation. InCase-Based Rea-soning Research and Development, pages 423–436. Springer, 2011.
4. M. Hall, E. Frank, and G. Holmes. The WEKA Data Mining Software: An Update.
ACM SIGKDD Explorations Newsletter, 11(1):10–18, 2009.
5. P. V. C. Hough. Method and Means for Recognizing Complex Patterns, 1962. US Patent.
6. S. Long and H. L. B. Graph-based Shape Shape Analysis for MRI Classification.
International Journal of Knowledge Discovery in Bioinformatics, 2(2):19–33, 2011. 7. H. Sakoe and S. Chiba. Dynamic programming algorithm optimization for spoken word recognition. Acoustics, Speech and Signal Processing, IEEE Transactions on, 26(1):43–49, Feb 1978.
8. A. Udomchaiporn, F. Coenen, M. Garc´ıa-Fi˜nana, and V. Sluming. 3-D MRI Brain Scan Feature Classification Using an Oct-Tree Representation. In Advanced Data Mining and Applications (ADMA’13), pages 229–240. Springer, 2013.