This is a repository copy of Social Interaction and Intergenerational Skill Transfer. White Rose Research Online URL for this paper:
http://eprints.whiterose.ac.uk/9953/
Monograph:
Brown, S. and Taylor, K. (2006) Social Interaction and Intergenerational Skill Transfer. Working Paper. Department of Economics, University of Sheffield ISSN 1749-8368 Sheffield Economic Research Paper Series 2006013
[email protected] https://eprints.whiterose.ac.uk/
Reuse
Unless indicated otherwise, fulltext items are protected by copyright with all rights reserved. The copyright exception in section 29 of the Copyright, Designs and Patents Act 1988 allows the making of a single copy solely for the purpose of non-commercial research or private study within the limits of fair dealing. The publisher or other rights-holder may allow further reproduction and re-use of this version - refer to the White Rose Research Online record for this item. Where records identify the publisher as the copyright holder, users can verify any specific terms of use on the publisher’s website.
Takedown
If you consider content in White Rose Research Online to be in breach of UK law, please notify us by
Sheffield Economic Research Paper Series
SERP Number: 2006013
Sarah Brown* and Karl Taylor*
Social Interaction and Intergenerational Skill Transfer
October 2006.
* Department of Economics University of Sheffield 9 Mappin Street Sheffield
S1 4DT
United Kingdom
Abstract.
We explore the relationship between educational attainment and social interaction using individual level data from the British National Child Development Study. To be specific, we analyze whether an intergenerational aspect to this relationship exists by examining the relationship between the educational attainment of children and the degree of formal social activity undertaken by their parents. In accordance with the existing literature, our results support a positive association between education and social interaction. Furthermore, our results suggest that children’s scores in reading, mathematics and vocabulary tests are positively associated with the extent of their parents’ formal social interaction. This relationship is robust to controlling for the degree of intra-family based social interaction and the social activities of the child.
Key Words: Education; Human Capital; Social Capital; Social Interaction JEL Classification: J24, Z12
Acknowledgements: We are grateful to the Data Archive at the University of Essex for
I.
Introduction and Background
Over the last decade, there has been increasing interest in the economics literature in social
interaction and social capital, and their implications for socio-economic outcomes such as
educational attainment and employment status. For example, the literature on the economics
of religion has analyzed the determinants of the decision to participate in religious activities,
such as church attendance, thereby focusing on participation in one particular formal social
activity.1 Given that social skills, and personality characteristics in general, are an important
part of human capital, see Bowles et al. (2001), it is not surprising that the relationship
between social interaction and education has attracted interest in the economics literature.
Educational attainment plays an important role in determining the opportunity cost of
engaging in any non work activity, such as church attendance. For highly educated
individuals who typically receive relatively high earnings, time spent out of the labor market
attracts a relatively large opportunity cost. A positive association between education and the
opportunity cost of time devoted to formal social activities implies an inverse relationship
between social activities and educational attainment. Sacerdote and Glaeser (2001) argue,
however, that if education increases the returns from social activities, then one might predict a
positive association between education and formal social activities. In general, empirical
evidence supports a positive relationship between church attendance and educational
attainment, see Brown and Taylor (2006), Iannaccone (1998), and Sacerdote and Glaeser
(2001). Furthermore, Glaeser et al. (2002), who report evidence supporting a positive
correlation between education and social interaction proxied by membership in organizations
including religious organizations, argue that this relationship is not only well known in the
social capital literature, but is also ‘one of the most robust empirical regularities in the social
capital literature.’ (Glaeser et al., 2002, p. F455).
1
In addition to determining the opportunity cost of engaging in formal social activities,
education is clearly related to social involvement with education playing a key role in the
development of social skills, see Putnam (2000). A socialization function of education exists
in that skills such as reading and writing play a crucial role in developing communication
skills. Sacerdote and Glaeser (2001) argue that schools teach children basic social skills and
how to interact with one another. Furthermore, they argue that the positive relationship
between education and social interaction is the result of treatment and selection whereby the
socialization function of schooling represents the treatment and selection reflects the fact that
education requires the same skills as participation in many other formal social activities such
as the ability to listen and communicate. Their empirical findings suggest that education is
positively associated with a range of formal social activities such as being a member of a
trade union, political club or sports club as well as social religious activity.2
This paper builds on this literature and explores the implications of engaging in a
range of activities involving social interaction. To be specific, we analyze the relationship
between social interaction and educational attainment at the individual level using British
cohort data from the National Child Development Study (NCDS). Furthermore, we explore the
relationship between a parent’s level of social interaction and their child’s academic
development. Given that family background is an important determinant of educational
attainment, see Ermisch and Francesconi (2001), one might predict that the level of formal
social activity (i.e. social interaction) undertaken by an individual may influence the academic
development of their children. Social interaction outside the family may lead to parents being
able to access the support and assistance of other individuals and, hence, may benefit parents
in bringing up their children (Coleman, 1988, and Furstenberg and Hughes, 1995) and thereby
2
enhance the academic development of their children. Fan (2006) explores the relationship
between religious participation (a particular type of social capital) and children’s education
within an overlapping generations theoretical framework, which predicts a close relationship
between education and religious participation. We explore whether engagement in formal
social activity facilitates inter-generational transfers of human capital from an empirical
perspective – an area, which, to our knowledge, has been the subject of limited empirical
scrutiny within the economics literature. To be specific, an interesting line of enquiry
concerns whether the children of parents who report relatively high levels of social interaction
report relatively high levels of academic achievement.
II.
Data and Methodology
For the purposes of this study, we exploit the rich data available from the British NCDS,
which is a British cohort study with a target sample of all children born in Great Britain
during a given week – March 3rd to March 9th – in 1958. This panel study provides a wealth of
information relating to the family background of the respondent in addition to having the
advantage of tracing the respondent over a relatively long time horizon. The survey follows
the same individuals at ages 7, 11, 16, 23, 33 and 42. In the survey conducted at age 33,
measures of the academic skills of the respondents’ children are available thereby enabling us
to link parents’ formal social activities with the educational attainment of their offspring. Our
choice of data set reflects the fact that the NCDS encompasses the key components required
for our analysis – namely information pertaining to the parent’s level of social interaction and
detailed information on their children’s academic skills in reading, writing and arithmetic.
Following Glaeser et al. (2002), our principle measure of the parent’s involvement in
formal social activities, a proxy for their social capital, , is defined as the number of
types of clubs that the individual is currently an active member of. The different types of
clubs include: a political party; an environmental charity/voluntary group; other
charity/voluntary group; women’s groups; townswomen’s guild or women’s institute;
parents/school organizations; tenants/residents association; trade union/staff associations; and
religious organizations.3 Prior to analyzing the relationship between the social interaction of
the parent and their child’s academic development, we explore the relationship between the
parent’s level of education and the extent to which they engage in social interaction. We
compare two commonly used measures of educational attainment: an index of the highest
qualification obtained and years of schooling.4 Table 1 presents the distribution of the number
of types of clubs by educational attainment when the respondent is aged 33. The summary
statistics suggest that club membership is positively associated with education.
For a sub-sample of NCDS respondents aged 33, the respondents’ children participated
in a variety of tests exploring various aspects of their development; the Peabody Individual
Achievement Tests (PIATs) in maths, reading recognition and comprehension and the
Peabody Picture Vocabulary Test – Revised (PPVT-R).5 The PIATs, which have been
extensively validated, measure the academic achievement of children aged 5 and over and are
the most widely used brief assessments of academic achievement with high test-retest
reliability and concurrent validity (National Longitudinal Survey of Youth, 1997 User Guide).
Children start the test at a point, which is appropriate for their age and establish a ‘basal’
(‘ceiling’) by achieving a certain number of consecutive correct (incorrect) answers. The
3
It should be acknowledged, however, that in accordance with Glaeser et al. (2002), the membership variable captures the number of types of clubs rather than the number of clubs an individual belongs to. In addition, we have no information on the size of the club, i.e. the extent of the social network that an individual belongs to. Finally, our measure does not include participation in groups associated with hobbies (such as book or garden clubs). Given that membership of such clubs may represent consumption activities (Glaeser et al., 2002), their omission from our measure may not be too problematic.
4
The educational attainment index is defined on a six point scale indicating: no educational qualifications; General Certificate of Secondary Education (GCSE) grade C or above; Advanced (A) level; diploma level, nursing or teaching qualifications; and, finally, degree level qualifications. GCSEs are taken after 11 years of formal compulsory education and approximate to the US honors high school curriculum. A levels are public examinations taken by 18 year olds over a two-year period, usually studying a set syllabus in one to four subjects. This qualification is the major determinant of eligibility for entry to higher education in the UK.
5
maths test comprises multiple choice questions which increase in terms of difficulty, starting
with questions focusing on, for example, recognizing numerals and progressing to topics such
as geometry. The reading recognition test consists of multiple choice questions and starts with
letters and progresses to words, whilst the reading comprehension test is based on the
meaning of sentences. Higher scores in the tests represent higher levels of achievement. The
PPVT-R is a widely used and extensively validated test of hearing vocabulary knowledge for
children based on pictorial representation. Children are presented with pictures and are asked
to indicate which picture matches the word spoken by the interviewer. This test has been
regarded as an aptitude test for verbal ability and an achievement test for vocabulary. The
sample size for PIATs is 2,271 children, whilst the sample size for the PPVT-R is 2,958
children.
Given that the dependent variable is a test score (either from the reading, maths or
vocabulary test) based on the number of correct responses, the dependent variable assumes
discrete values but is not a categorical variable. Since the dependent variable is essentially a
non negative integer count, we adopt a Poisson regression model, which specifies that each
value of the dependent variable, yi, is drawn from a Poisson distribution with parameter λi,
which is related to the regressors xi:
(
)
Pr ob Y , 0,1, 2,... , , exp !
i yi
i i i
i i i i i i i
i
SOC
e
y y m E y SOC
y
λλ φ π
λ
−
+
⎡ ⎤
= = = ⎣ x ⎦= = x (1)
(see Greene, 2003). The PIAT test scores in maths and reading have means (standard
deviations) of 36 (19) and 38 (22) with maximum values of 84, whilst the PPVT-R has a
mean (standard deviation) of 37 (13), with a maximum value of 104. We aim to explore the
relationship between the level of social interaction of the parent, , as proxied by club
membership, and a child’s scores in the PIATs and the PPVT-R. Hence, our focus is on the
sign and significance of
SOC
we include: the age of the child; the gender of the child; a dummy variable which takes the
value of one if the child has experienced over one year of a limiting health problem; a dummy
variable which takes the value of one if the child has siblings; the number of books the child
has; and the number of children present when the child took the test. In terms of family
background, we control for: the logarithm of household income; whether the family owns
their own home; whether the child comes from a single parent household; and the highest
educational qualification of the parent of the child. Finally, we include whether the parent has
reported that he/she has experienced reading or maths problems since leaving school.
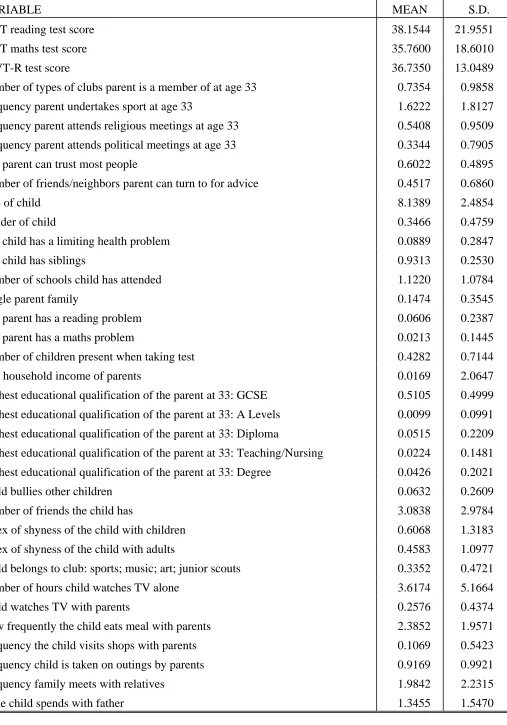
Summary statistics of the explanatory variables included in equation (1) are presented in
Table 2.
III.
Results
Social Interaction and the Educational Attainment of the Parent
Prior to exploring the relationship between the social interaction of the parent and their child’s
education, we explore the relationship between the parent’s level of education and the extent
to which they engage in social interaction. We compare two commonly used measures of
educational attainment: an index of the highest qualification obtained and years of schooling.
Table 3 presents findings pertaining to the influence of club membership on the education of
the parent. We employ a standard ordinary least squares (OLS) approach for years of
schooling and, following Dearden et al. (2002), we adopt an ordered probit specification
when analyzing the index of highest educational attainment. Clearly, the greater the number
of clubs an individual is a member of, the higher is their level of educational attainment. In
the case of the highest educational attainment index, a one standard deviation increase in the
extent of club membership decreases the probability of having no education by 9.87%.6
6
Similarly, club membership is positively associated with the number of years of schooling.
Our educational attainment equation follows a standard specification: see Dearden et al.
(2002); Ermisch and Francesconi (2001); and Harmon and Walker (2000), controlling for
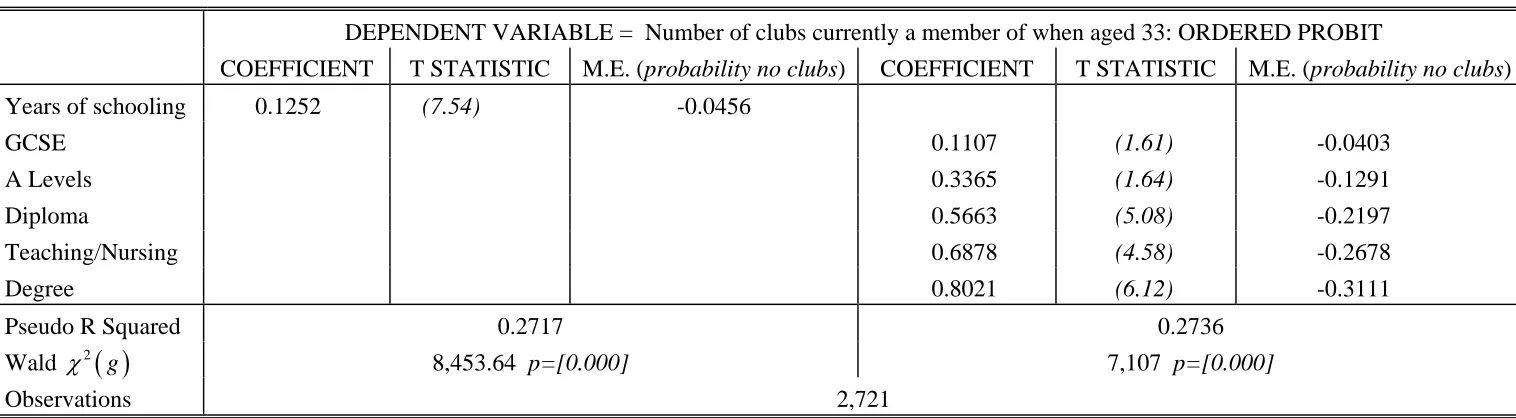
school resources, family background and ability (Table 3A).7 In Table 3B, we explore
whether education influences club membership. Regardless of how education is measured,
there is a positive influence on club membership. As such, irrespective of the direction of
causality, in accordance with existing literature, our findings support a positive association
between education and club membership, i.e. our proxy for social interaction.
Intergenerational Skill Transfer and Social Interaction
We now consider whether there is a ‘spillover’ effect from the individual’s social interaction,
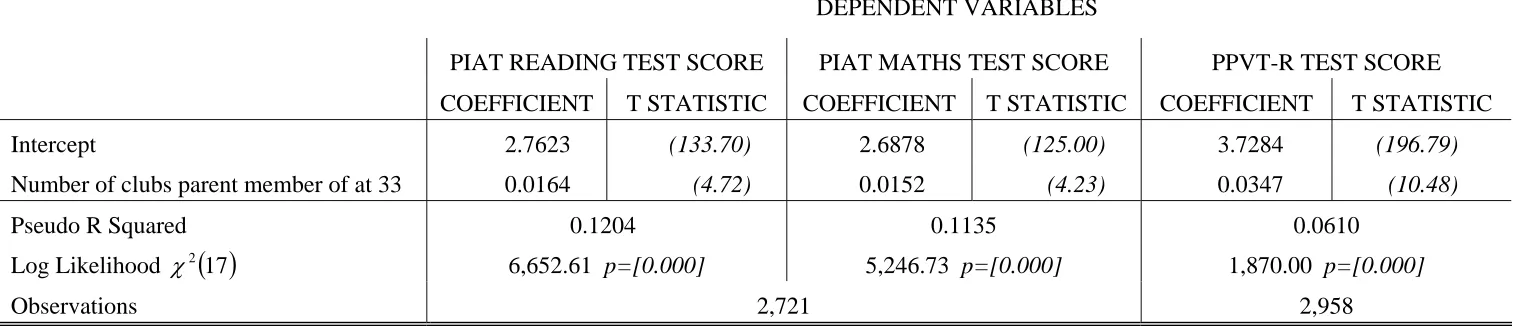
which influences the academic ability of their children.8 Table 4 presents the results of
estimating equation (1), where the dependent variable denotes the child’s test score in
reading, mathematics or vocabulary. It is apparent that the number of clubs that the parent
belongs to is positively related to the test scores attained by the children.9 A one standard
deviation increase in the number of clubs the parent belongs to is associated with increases in
the reading, maths and vocabulary scores of 1.6%, 1.5% and 3.4% respectively.10,11
7
See Brown and Taylor (2006) for results relating to the full specification.
8
The sample size is smaller for the PIAT maths and reading tests since children aged over 5 take such tests, whilst the PPVT-R test is administered to children aged four and above. The following results are not affected by restricting the sample to children aged 5 plus for the PPVT-R test score estimation, yielding the same sample size as for the PIATs.
9
When analyzing social interaction, a natural question arises as to whether parents engage in more or less social interaction than non-parents. It may be the case that parenthood leads to less time for social activities or conversely that it may open up opportunities for more social interaction. The mean value of the social interaction proxy for parents is 0.8087 as compared to 1.0076 for non-parents although the difference is not statistically significant. Furthermore, if we regress the social interaction index for all NCDS respondents on the number of children or being a parent, we find that such characteristics have insignificant effects. A related issue concerns whether individuals change the extent to which they engage in social interaction once they have children. The mean level of social interaction in 1991 for respondents whose children participated in the tests in 1991, but were not born in 1981, is 0.7972 whilst the mean value of the social interaction proxy for this group of respondents in 1981 was 0.9788.
10
The deviance statistic is insignificant suggesting that over-dispersion is not a problem in the test score models. Our results are robust to estimating a negative binomial specification which is less restrictive than the poisson model since the assumption of equi-dispersion is relaxed.
11
Arguably, the social interaction of the parent could be capturing the social capital of
the child, i.e. an omitted variable problem may exist. Consequently, in Table 5, we re-estimate
equation (1) including proxies for the social capital of the child. Specifically, we control for
whether the child bullies other children, how many friends the child has, how shy the child is
with other children or adults, and whether the child belongs to a club such as sports, music, art
or cubs (junior scouts). In particular, we are interested in whether the influence of the social
interaction of the parent remains once we control for the child’s social capital. Our findings
suggest that shy children are likely to have lower maths and reading test scores, whilst being a
bully is negatively associated with all test scores. The number of friends the child has is
inversely associated with maths and reading test scores, yet positively associated with the
vocabulary test score. The size of the effects are, however, relatively moderate. The child’s
club membership has a strong influence on their maths and reading test scores – both in terms
of magnitude, with influences of 20% and 19% respectively, and statistical significance
suggesting that even at a young age there is a positive association between education and
social interaction. Noticeably, parental club membership still has a positive and significant
influence on the child’s test scores.12
Social Interaction versus Intra-Family Interaction
One shortcoming of the analysis so far relates to the omission of controls for intra-family
interaction. Furstenberg and Hughes (1995) distinguish between intra-family based social
capital and community based social capital. With respect to intra-family based social capital,
membership has a similar impact on the child’s test scores when parental education is predicted from the specification in Table 3A.
12
one might predict that the amount of time spent in shared family activities would impact
positively on a child’s academic development. Alternatively, club membership may be
correlated with omitted family interaction variables which influence the child’s ability.
Hence, in Table 6 Panel A we include controls for: the number of hours the child watches
television (TV) alone; whether the child watches TV with his/her parents; the frequency with
which the child eats with both parents; the frequency with which the child visits the shops
with his/her parents; the frequency with which the child is taken on outings by his/her parents
and/or relatives, such as for a picnic, to the park, museum and/or theatre; how often the family
meets relatives; and an index of how much time the child spends with his/her father.
It is apparent from Table 6 Panel A that watching TV alone is inversely associated
with a child’s test scores as is, perhaps surprisingly, the frequency at which the child is taken
on outings by parents or relatives. Noticeably, there are some differences in the direction of
the relationship between some of the child’s social capital proxies and the family interaction
controls and the PPVT-R and PIAT test scores. This may reflect differences between the tests
in that, in contrast to the PIATS, the PPVT-R is a pictorial based vocabulary recognition test.
For example, the frequency at the child is taken on outings/shops by his/her parents and
whether the child watches TV with his/her parents are positively related to the PPVT-R test,
but negatively related to the PIAT test scores. One might argue that this type of interaction
increases visual awareness, which may explain the positive association with the PPVT-R test.
Again, as found in Table 5, the child’s club membership has a strong positive
relationship with the test scores. Moreover, the effects from parental social interaction still
remain once the controls for intra-family interaction are included. A one standard deviation
increase in parental club membership is associated with increases in the children’s reading,
maths and vocabulary test scores of 1.2%, 1.1% and 2.0% respectively – hence the effects are
Our findings suggest that, across the different models, the positive relationship between
parental social interaction and children’s reading, writing, mathematics and vocabulary test
scores is highly robust.
In order to further check for robustness, in Panel B of Table 6, we replace the number
of clubs of which the parent is a member with its predicted value based on the set of control
variables used to model the club membership of the parent in Table 3B. The set of
over-identifying instruments includes the number of cigarettes smoked, past club membership,
BSAG personality traits of the parent,13 economic status, whether the respondent’s spouse is
unemployed, hours worked and regional controls.14The positive association between parental
social activity and the child’s test scores remains after replacing the club membership of the
parent with its predicted value, with the magnitude of the influence being slightly
exacerbated.15
Intergenerational Skill Transfer and other Measures of Social Capital
As pointed out by Durlauf (2002), the definition of social capital ranges from a form of social
networks to trust and trustworthiness and, hence, encapsulates many concepts. Thus, in this
section, we explore whether our key findings are robust to amendments to the measure of
social interaction. So far, our measure of parental social interaction has been based on club
membership. In contrast to Glaeser et al. (2002), we are able to control for the intensity of
participation in clubs since the NCDS includes information on the frequency at which the
13
The BSAG personality scores refer to the “Bristol Social-Adjustment Guide” which was designed to describe a individual’s behavior and attitudes in particular settings. ‘Syndrome’ scores were used in the NCDS to give a quantitative assessment of behavior defined from the following syndromes: Unforthcomingness; Withdrawal; Depression; Anxiety for acceptance by adults; Hostility towards adults; ‘Writing off’ of adults and adult standards; Anxiety for acceptance by children; Hostility towards children; Restlessness; ‘Inconsequential’ behavior; Miscellaneous symptoms and Miscellaneous nervous symptoms. We use the combined total score to each of these ‘syndromes’ where a higher numerical score signifies greater behavioral problems.
14
To test for the validity of the instruments we consider the joint significance of the over-identifying variables in the club membership equation. We find that these variables are jointly significant at the 1% level supporting the use of these instruments. Secondly, the residuals from the test score equation are regressed on the identifying instruments. Our findings suggest an insignificant relationship between the residuals and the over-identifying variables thereby further endorsing the validity of this set of instruments.
15
parent undertakes sporting activities, attends religious meetings or attends political meetings.
We also have information on the number of friends/neighbors the respondent can turn to for
advice. In addition, respondents in the NCDS are asked whether they can trust most people,
thereby allowing us to proxy social capital via a measure of trust, similar to that used by
Glaeser et al. (2000).16 These measures have been used in the previous literature to proxy
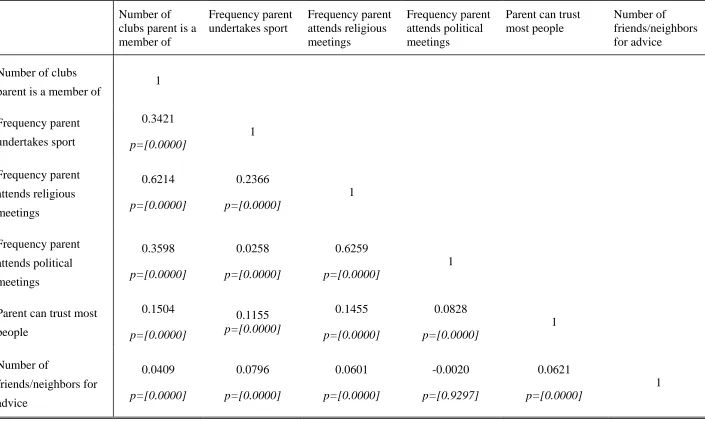
social capital, see Glaeser et al. (2002). Table 7 shows the correlation between the different
proxies of social capital where there is generally a positive and statistically significant
relationship between the alternative measures.
In Table 8, we replace parental club membership with each of the alternative measures
of the parents’ social capital whilst controlling for the child’s social capital and family
interaction. Introducing each measure individually, Panels A through to E generally show a
positive association between parent’s social capital and the child’s test scores. For example,
the offspring of parents who are generally trusting of other people have higher reading, maths
and vocabulary scores – 2.9%, 2.8% and 6.3% respectively.17 Exceptions are the frequency
with which the parent attends religious and political meetings, which only influence the
child’s vocabulary test scores. The positive association between parental religious activity and
children’s educational attainment is consistent with the theoretical predictions of Fan (2006).
Finally, each of the alternative measures of social interaction are entered simultaneously in
Panel F. The number of friends/neighbors the respondent can turn to for advice dominates the
effects of the intensity measures in terms of the magnitude of the estimated coefficient as well
16
The intensity measures and the trust measure are positively related to the educational attainment of the parent in accordance with the results presented in Tables 3A and 3B. These results are omitted for brevity but are available on request. See Brown and Taylor (2006) for a detailed analysis of the determinants of the frequency of attending religious and political meetings.
17
The functional form of equation (1) is E y x x
(
1, 2,L,xk)
=exp(
φ φ1, 2,L,φk)
and taking logs gives theas statistical significance for the maths and reading tests, whilst trust dominates for the
PPVT-R test.
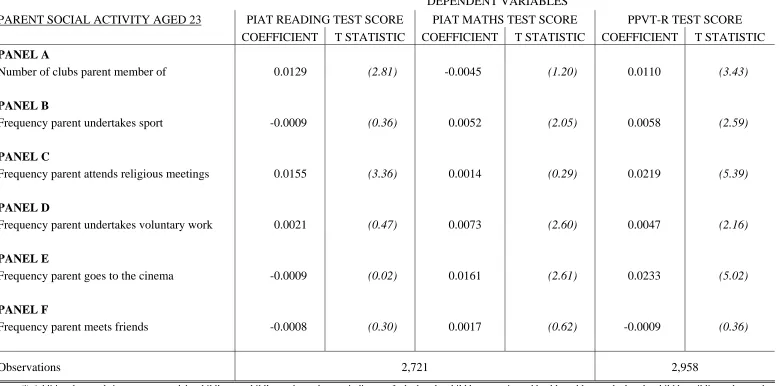
Intergenerational Skill Transfer and Causality
It is generally difficult to justify a causal interpretation in applied econometrics without
finding plausible sources of identifying variation. Hence, our findings of a positive
relationship between parent’s social capital and the children’s test scores do not necessarily
imply a causal relationship. So far, we have explored the relationship between the parents’
social capital when the parents are aged 33 and the scores of the children from tests taken
whilst the parents are aged 33. In order to shed some light on causality, we investigate
whether measures of the parent’s social capital at age 23 influence the test scores of the
children attained when the parents are aged 33. Differences in the timing of the measurement
of the test scores and the measurement of parental social interaction suggest that any
significant correlation from such a specification is arguably evidence of a causal relationship.
Furthermore, when the respondents (i.e. the parents) were aged 23 the majority of the
respondents’ children (approximately 95%) were not born – the mean age of the respondents’
children in 1991 being 8 years old.
With respect to measures of social interaction and social capital, the NCDS includes
information on the number of types of clubs that the parent was an active member of at age
23. The different types of clubs include: voluntary groups; trade union/staff associations;
religious organizations; sports clubs and youth clubs. The correlation between this measure
and the number of types of club membership at age 33 is 0.5136 and is statistically significant
at the one per cent level despite the fact that the definitions differ slightly. In addition, there
are a number of additional measures of the intensity of social interaction at age 23. To be
specific, there is information on how often they: undertake sport; attend religious meetings;
social capital, the questions are identical to those used in Table 8, specifically the frequency
with which individuals undertake sport and/or attend religious meetings. 18
In Table 9, we replace parental club membership at age 33 with proxies of the parents’
social interaction at age 23, each measured prior to the children taking the PIAT and PPVT-R
tests, whilst also controlling for the child’s social capital and family interaction.19 The results
presented in Table 9 Panel A indicate that a one standard deviation increase in parental club
membership at age 23 is associated with statistically significant increases in the children’s
reading and vocabulary test scores of 1.1% and 0.9% respectively. Such influences are similar
in magnitude to those based upon club membership at age 33. Introducing each alternative
measure of social interaction individually, Panels B through to F generally support a positive
association between parental social capital and the child’s test scores.20 For example, a one
standard deviation increase in the frequency the parent attends religious meetings in 1981
increases the reading and PPVT-R test scores by 1.1% and 1.6% respectively. The results
presented in Table 9 are consistent with a causal interpretation of the relationship between
parent’s social capital and the child’s test scores.21
IV. Conclusion
We have investigated the relationship between educational attainment and engagement in
formal social activities. Our empirical findings are in accordance with the existing literature
18
The correlation between sporting (religious) activities at the ages of 23 and 33 is 0.2266 (0.5925). It is also possible to construct the number of clubs the respondent is a member of when aged 42 where the definition is identical to that at age 33. The correlation between club membership of the parent between ages 33 and 42 is 0.4024 .
19
The child’s test score, y, is modeled as follows:ytchild=1991 = f
(
SOC)
tparent=1981.20
The only exception is the frequency at which individuals socialize with friends which does not significantly influence any of the test scores.
21
supporting a positive relationship between education and social interaction. In addition, our
results indicate a hitherto neglected influence of social interaction. To be specific, our
empirical results suggest that a lack of social interaction may have adverse intergenerational
effects in terms of educational attainment. The offspring of individuals who engage in
relatively low levels of social interaction attain relatively low scores in reading, maths and
vocabulary tests. The mean age of the children in our sample is eight years and empirical
evidence suggests that children learn quickly at an early age with early learning being
important for learning later in life (see, for example, Cunha et al., 2006). As such, one might
predict that the children with relatively low test scores are likely to attain relatively low levels
of educational attainment later on in life. Finally, as pointed out by Sacerdote and Glaeser
(2001), the positive association between education and social interaction indicates an
important role for social involvement. We provide further support for this argument and,
furthermore, indicate that there are additional intergenerational benefits from social
involvement.
References
Bowles, S., Gintis, H. and M. Osborne (2001) The Determinants of Earnings: A Behavioral
Approach. Journal of Economic Literature, 39, 1137-76.
Brown, S. and K. Taylor (2006) Religion and Education: Evidence from the National Child
Development Study. Journal of Economic Behavior and Organization, forthcoming.
Coleman, J. S. (1988) Social Capital in the Creation of Human Capital. American Journal of
Sociology, 94, S95-S120.
Cunha, F., Heckman, J., Lochner, L. and D. Masterov (2006) Interpreting the Evidence on
Lifecycle Skill Formation. In E. Hanushek and F. Welch (Eds) Handbook of Education
Dearden, L., Ferri, J., and C. Meghir (2002) The Effect of School Quality on Educational
Attainment and Wages. The Review of Economics and Statistics, 84, 1-20.
Durlauf, S. N. (2002) Symposium on Social Capital: Introduction. The Economic Journal,
112, F417-8.
Ermisch, J., and M. Francesconi (2001) Family Matters: Impacts of Family Background on
Educational Attainment. Economica, 68, 137-56.
Fan, C. S. (2006) Religious Participation and Children’s Education: A Social Capital
Approach. Journal of Economic Behavior and Organization, forthcoming.
Furstenberg, F. and M. Hughes (1995) Social Capital and Successful Development among
At-Risk Youth. Journal of Marriage and the Family, 57, 580-92.
Glaeser, E., Laibson, D., Scheinkman, J. and C. Soutter (2000) Measuring Trust. Quarterly
Journal of Economics, 65, 811-46.
Glaeser, E., Laibson, D. and B. Sacerdote (2002) An Economic Approach to Social Capital.
The Economic Journal, 112, F437-58.
Greene, W. H. (2003) Econometric Analysis. Prentice-Hall International (Fifth Edition).
Harmon, C. and I. Walker (2000) The Returns to the Quantity and Quality of Education:
Evidence for Men in England and Wales. Economica, 67, 19-35.
Iannaccone, L. R. (1998) Introduction to the Economics of Religion. Journal of Economic
Literature, 36, 1465-95.
Putnam, R. (2000) Bowling Alone: The Collapse and Revival of American Community. New
York: Simon and Schuster.
Sacerdote, B. I. and E. L. Glaeser (2001) Education and Religion. NBER Working Paper
Table 1: Distribution of Club Membership by Education (Sample = Respondent, i.e. Parent)
FREQUENCY (%)
Number of Clubs ALL
INDIVIDUALS No Education GCSE C A Level Diploma Nursing/Teaching Degree
0 54.47% 44.33% 70.74% 18.52% 25.71% 21.31% 9.09%
1 26.09% 37.45% 16.76% 48.15% 27.86% 32.79% 29.75%
2 12.86% 12.96% 8.74% 18.52% 30.00% 27.87% 30.58%
3 4.89% 4.66% 2.75% 11.11% 11.43% 13.11% 18.18%
4 1.40% 0.51% 0.87% 3.70% 5.00% 4.92% 8.26%
VARIABLE MEAN S.D. PIAT reading test score 38.1544 21.9551
PIAT maths test score 35.7600 18.6010
PPVT-R test score 36.7350 13.0489
Number of types of clubs parent is a member of at age 33 0.7354 0.9858 Frequency parent undertakes sport at age 33 1.6222 1.8127 Frequency parent attends religious meetings at age 33 0.5408 0.9509 Frequency parent attends political meetings at age 33 0.3344 0.7905 The parent can trust most people 0.6022 0.4895 Number of friends/neighbors parent can turn to for advice 0.4517 0.6860
Age of child 8.1389 2.4854
Gender of child 0.3466 0.4759
The child has a limiting health problem 0.0889 0.2847 The child has siblings 0.9313 0.2530 Number of schools child has attended 1.1220 1.0784
Single parent family 0.1474 0.3545
[image:20.595.54.561.58.783.2]The parent has a reading problem 0.0606 0.2387 The parent has a maths problem 0.0213 0.1445 Number of children present when taking test 0.4282 0.7144 Log household income of parents 0.0169 2.0647 Highest educational qualification of the parent at 33: GCSE 0.5105 0.4999 Highest educational qualification of the parent at 33: A Levels 0.0099 0.0991 Highest educational qualification of the parent at 33: Diploma 0.0515 0.2209 Highest educational qualification of the parent at 33: Teaching/Nursing 0.0224 0.1481 Highest educational qualification of the parent at 33: Degree 0.0426 0.2021 Child bullies other children 0.0632 0.2609 Number of friends the child has 3.0838 2.9784 Index of shyness of the child with children 0.6068 1.3183 Index of shyness of the child with adults 0.4583 1.0977 Child belongs to club: sports; music; art; junior scouts 0.3352 0.4721 Number of hours child watches TV alone 3.6174 5.1664 Child watches TV with parents 0.2576 0.4374 How frequently the child eats meal with parents 2.3852 1.9571 Frequency the child visits shops with parents 0.1069 0.5423 Frequency child is taken on outings by parents 0.9169 0.9921 Frequency family meets with relatives 1.9842 2.2315 Time child spends with father 1.3455 1.5470
Table 3A: The Effect of Club Membership on the Educational Attainment of the Parent (Sample = Parent of the Child)
DEPENDENT VARIABLE =
Highest Educational Attainment at 33 (ORDERED PROBIT MODEL)
DEPENDENT VARIABLE = Years of Schooling (OLS) COEFFICIENT T STATISTIC M.E. (probability no education) COEFFICIENT T STATISTIC Number of clubs 0.2754 (8.00) -0.1001 0.3307 (8.03)
(Pseudo) R Squared 0.1940 0.3184
Wald χ2
( )
42 752.63 p=[0.000]F (42, 2,678) 40.13 p=[0.000]
Observations 2,721
Notes: (i) Controls are: gender; class size at 11 and 16; school type; single sex school at 16; the school lacked library facilities, sports facilities, science facilities and/or any other facilities when aged 16; mother and father’s occupation when growing up; age mother and father left full time education; presence of older and younger siblings; parental interest in the child when aged 7; frequency mother and father used library facilities when child was aged 11; frequency mother and father read to the child when growing up; child had a room to do homework when aged 11; free school meals when aged 11; mother speaks English; mother and/or father dead when growing up; family difficulties due to divorce or separation, unemployment, alcohol and/or finances when growing up; maths and reading test scores when aged 11; spent time in school before compulsory school joining age. (ii) M.E. is the marginal effect showing the probability of having no education.
Table 3B: The Effect of the Parent’s Education on the Club Membership of the Parent (Sample = Parent of the Child)
DEPENDENT VARIABLE = Number of clubs currently a member of when aged 33: ORDERED PROBIT
COEFFICIENT T STATISTIC M.E. (probability no clubs) COEFFICIENT T STATISTIC M.E. (probability no clubs) Years of schooling 0.1252 (7.54) -0.0456
GCSE 0.1107 (1.61) -0.0403
A Levels 0.3365 (1.64) -0.1291
Diploma 0.5663 (5.08) -0.2197
Teaching/Nursing 0.6878 (4.58) -0.2678
Degree 0.8021 (6.12) -0.3111
Pseudo R Squared 0.2717 0.2736
Wald χ2
( )
g 8,453.64 p=[0.000] 7,107 p=[0.000]Observations 2,721
[image:21.842.48.806.298.507.2]Table 4: Intergenerational Skill Transfer and Parental Social Interaction (Sample = Child of the Respondent)
DEPENDENT VARIABLES
PIAT READING TEST SCORE PIAT MATHS TEST SCORE PPVT-R TEST SCORE COEFFICIENT T STATISTIC COEFFICIENT T STATISTIC COEFFICIENT T STATISTIC Intercept 2.7623 (133.70) 2.6878 (125.00) 3.7284 (196.79)
Number of clubs parent member of at 33 0.0164 (4.72) 0.0152 (4.23) 0.0347 (10.48)
Pseudo R Squared 0.1204 0.1135 0.0610
Log Likelihood χ2
( )
17 6,652.61 p=[0.000] 5,246.73 p=[0.000] 1,870.00 p=[0.000]Observations 2,721 2,958
[image:22.842.45.803.80.243.2]Table 5: Intergenerational Skill Transfer, Parental Social Interaction and the Social Capital of Child (Sample = Child of the Respondent)
DEPENDENT VARIABLES
PIAT READING TEST SCORE PIAT MATHS TEST SCORE PPVT-R TEST SCORE COEFFICIENT T STATISTIC COEFFICIENT T STATISTIC COEFFICIENT T STATISTIC Intercept 3.0377 (137.16) 2.9498 (128.07) 3.6166 (172.52)
Bullies other children -0.0541 (4.27) -0.0048 (0.38) -0.0291 (2.58)
Number of friends -0.0028 (2.13) -0.0039 (2.91) 0.0049 (3.94)
Index of shyness with children -0.1657 (4.70) -0.1509 (2.34) 0.0157 (3.68)
Index of shyness with adults -0.0189 (2.38) -0.0158 (1.99) 0.0197 (4.01)
Child belongs to club: sports; music; art etc. 0.2052 (7.90) 0.1871 (4.56) 0.0063 (0.85)
Number of clubs parent member of at 33 0.0129 (3.54) 0.0135 (3.58) 0.0273 (7.90)
Pseudo R Squared 0.2083 0.1964 0.0678
Log Likelihood χ2
( )
22 11,510.61 p=[0.000] 9,076.34 p=[0.000] 2,076.22 p=[0.000]Observations 2,721 2,958
Table 6: Intergenerational Skill Transfer, Parental Social Interaction and Intra-Family Interaction (Sample = Child of the Respondent)
DEPENDENT VARIABLES
PIAT READING TEST SCORE PIAT MATHS TEST SCORE PPVT-R TEST SCORE
PANEL A
COEFFICIENT T STATISTIC COEFFICIENT T STATISTIC COEFFICIENT T STATISTIC Intercept 3.1155 (128.59) 3.0171 (119.94) 3.5572 (151.89)
Number of clubs parent member of at 33 0.0121 (3.20) 0.0113 (2.89) 0.0201 (4.72) Social capital of the child
Bullies other children -0.0776 (6.11) -0.0289 (2.27) -0.0258 (2.26)
Number of friends -0.0026 (1.96) -0.0045 (3.21) 0.0026 (1.96)
Index of shyness with children -0.1454 (2.33) -0.1317 (9.18) 0.0134 (3.75)
Index of shyness with adults -0.0168 (2.11) -0.0145 (1.81) 0.0187 (3.12)
Child belongs to club: sports; music; art etc. 0.1654 (20.09) 0.1416 (16.63) -0.0081 (0.92) Intra-family interaction
Number of hours child watches TV Alone -0.0059 (8.16) -0.0031 (4.27) -0.0028 (3.75)
Child watches TV with parents -0.1348 (14.12) -0.1314 (3.32) 0.0312 (3.12)
How frequently child eats meal with parents -0.0089 (3.32) -0.0089 (3.20) -0.0001 (0.38)
Frequency child visits shops with parents -0.0268 (3.60) -0.0255 (3.32) 0.0314 (5.41)
Frequency child taken on outings by parents -0.0285 (6.32) -0.0261 (5.62) 0.0319 (8.06)
Frequency family meets with relatives 0.0332 (5.75) 0.0291 (3.30) -0.0010 (0.44)
Time child spends with father 0.0408 (12.67) 0.0474 (14.25) 0.0068 (1.95)
Pseudo R Squared 0.2214 0.2100 0.0711
Log Likelihood χ2
( )
30 12,236.02 p=[0.000] 9,703.13 p=[0.000] 2,177.98 p=[0.000]PANEL B PIAT READING TEST SCORE PIAT MATHS TEST SCORE PPVT-R TEST SCORE
COEFFICIENT T STATISTIC COEFFICIENT T STATISTIC COEFFICIENT T STATISTIC Predicted Club Membership of Parent 0.0290 (4.24) 0.0286 (4.04) 0.0304 (4.60)
Pseudo R Squared 0.2215 0.2101 0.0707
Log Likelihood χ2
( )
30 12,243.74 p=[0.000] 9,711.10 p=[0.000] 2,167.58 p=[0.000]Observations 2,721 2,958
Table 7: Correlation between Measures of Parents’ Social Capital
Number of clubs parent is a member of Frequency parent undertakes sport Frequency parent attends religious meetings Frequency parent attends political meetings
Parent can trust most people
Number of friends/neighbors for advice
Number of clubs
parent is a member of 1
Frequency parent undertakes sport 0.3421 p=[0.0000] 1 Frequency parent attends religious meetings 0.6214 p=[0.0000] 0.2366 p=[0.0000] 1 Frequency parent attends political meetings 0.3598 p=[0.0000] 0.0258 p=[0.0000] 0.6259 p=[0.0000] 1
Table 8: Intergenerational Skill Transfer, Parental Social Interaction and Other Measures of Social Capital (Sample = Child of the Respondent)
DEPENDENT VARIABLES
PIAT READING TEST SCORE PIAT MATHS TEST SCORE PPVT-R TEST SCORE COEFFICIENT T STATISTIC COEFFICIENT T STATISTIC COEFFICIENT T STATISTIC
PANEL A
Frequency parent undertakes sport 0.0038 (2.87) 0.0102 (4.84) 0.0052 (2.58)
PANEL B
Frequency parent attends religious meetings 0.0045 (1.20) 0.0005 (0.12) 0.0169 (4.92)
PANEL C
Frequency parent attends political meetings -0.0002 (0.06) -0.0034 (0.79) 0.0161 (4.23)
PANEL D
Parent can trust most people 0.0288 (4.40) 0.0275 (4.08) 0.0624 (9.74)
PANEL E
Number of friends/neighbors for advice 0.0221 (4.84) 0.0164 (3.46) 0.0086 (1.96)
PANEL F
Frequency parent undertakes sport 0.0023 (1.12) 0.0100 (4.61) 0.0041 (1.98)
Frequency parent attends religious meetings 0.0056 (1.20) 0.0021 (0.45) 0.0105 (2.38)
Frequency parent attends political meetings -0.0053 (1.02) -0.0059 (1.11) 0.0081 (1.66)
Parent can trust most people 0.0082 (1.04) 0.0109 (1.34) 0.0380 (4.99)
Number of friends/neighbors for advice 0.0134 (2.48) 0.0115 (2.05) 0.0009 (0.17)
Observations 2,721 2,958
Table 9: Intergenerational Skill Transfer, Parental Social Interaction and Causality (Sample = Child of the Respondent)
DEPENDENT VARIABLES
PIAT READING TEST SCORE PIAT MATHS TEST SCORE PPVT-R TEST SCORE PARENT SOCIAL ACTIVITY AGED 23
COEFFICIENT T STATISTIC COEFFICIENT T STATISTIC COEFFICIENT T STATISTIC
PANEL A
Number of clubs parent member of 0.0129 (2.81) -0.0045 (1.20) 0.0110 (3.43)
PANEL B
Frequency parent undertakes sport -0.0009 (0.36) 0.0052 (2.05) 0.0058 (2.59)
PANEL C
Frequency parent attends religious meetings 0.0155 (3.36) 0.0014 (0.29) 0.0219 (5.39)
PANEL D
Frequency parent undertakes voluntary work 0.0021 (0.47) 0.0073 (2.60) 0.0047 (2.16)
PANEL E
Frequency parent goes to the cinema -0.0009 (0.02) 0.0161 (2.61) 0.0233 (5.02)
PANEL F
Frequency parent meets friends -0.0008 (0.30) 0.0017 (0.62) -0.0009 (0.36)
Observations 2,721 2,958