The Sea Urchin Regulome in Development
Thesis by
Meredith Ashby
In Partial Fulfillment of the Requirements
for the Degree of
Doctor of Philosophy
California Institute of Technology
Pasadena, California
2007
© 2007
Meredith Ashby
Acknowledgements
So many people have contributed to the success of this effort. I would foremost
like to thank my advisor, Eric Davidson, for creating an intellectual atmosphere where I
could indulge my passion for science. Thank you for all the discussions about both the
big picture and the fine details, probing questions, encouragement, and especially all the
delicious cookies.
I would also like to acknowledge Stefan Materna, Titus Brown, Andy Cameron,
Rachel Gray, and Lili Chen for their work on the research presented here, and the whole
Davidson Group, for making the lab such a fun place to work. Many of you I owe
particular thanks to: Cathy Yuh and Titus Brown, who sacrificed hours of potentially
productive time helping me out when I first joined the lab; Gabriele Amore, for being the
best labmate ever, silly walk and opera singing included; the whole crazy crew who made
it fun to get up at 4 am to filter gallons of urchin embryos; and Deanna Thomas and Jane
Rigg, for making everything happen smoothly, from the magical appearance of supplies,
to travel arrangements without bankruptcy, to publications with beautiful figures and
accurate references.
Finally, I would like to thank all my friends in Pasadena, who have become
family to me ─ Jen Ma, Lara, Raffi, Natasha, Maro, Sevan, and Nancy ─ I never would have made it without all of you; Stefan again, for being the best roommate ever; Mom
and Dad, for undying patience and encouragement; and Jen, to whom I still owe three
weeks of vacation. And most of all, Ashby, thank you for bringing new magic into my
Abstract
During development an organism undergoes many rounds of pattern formation,
generating ever greater complexity with each ensuing round of cell division and
specification. The instructions for executing this process are encoded in the DNA, in cis
-regulatory modules that direct the expression of developmental transcription factors and
signaling molecules. Each transcription factor binding site within a cis-regulatory
module contributes information about when, where or how much a gene is turned on, and
by dissecting the modules driving a given gene, all the inputs governing expression of the
gene can be accurately identified. Furthermore, by mapping the output of each gene to the
inputs of other genes, it is possible to reverse engineer developmental circuits and even
whole networks, revealing common bilaterian strategies for specifying progenitor fields,
locking down regulatory states, and driving development forward. The S. purpuratus
endomesodermal gene network is one of the best-characterized developmental networks,
with interactions between over 40 regulatory genes mapped by perturbation experiments.
With the sequencing of the sea urchin genome, it is possible to move towards the
definitive completion of this network. By identifying all the transcription factors in the
genome and determining their expression patterns, any previously unrecognized players
can be incorporated into the network. In addition, such a comprehensive examination of
transcription factor usage in maximally indirect development has not been done and will
itself yield interesting conclusions.
Table of Contents
Acknowledgements ... iii
Abstract... iv
Table of Contents ...v
Introduction...1
Chapter 1 Indentification and Characterization of Homeobox Transcription Factor Genes in Strongylocentrotus purpuratus, and Their Expression in Embryonic Development...31
Chapter 2 Gene Families Encoding Transcription Factors Expressed in Early Development of Strongylocentrotuspurpuratus ...68
Chapter 3 High Regulatory Gene Use in Sea Urchin Embryogenesis: Implications for Bilaterian Development and Evolution...109
Appendix 1: Supplementary Material for Chapter 1...129
Appendix 2: Supplementary Material for Chapter 2...138
Introduction
Understanding Development through Gene Regulatory Networks
Molecular biology has illuminated how DNA encodes amino acid sequences, and
how the cell is able to translate those blueprints into proteins. Understanding in similar
detail how DNA also encodes where, when and how much each protein will be expressed
has yet to be achieved. Written into genomic DNA is a self-executing set of instructions
which precisely directs developmental pattern formation and cell division, ultimately
producing the complex body plan of the adult organism. Decrypting that information is
one of the most interesting problems in biology. Only recently, with the availability of
large amounts of genomic DNA sequence and the advent of high throughput cis
-regulatory analysis, has it become possible to peer into the black box, and begin to
understand at the molecular level how cis-regulatory information is processed to generate
complexity during development, both at the individual gene level and at the gene network
level.
In essence, cis-regulatory elements are information processing devices hardwired
into the genomic DNA sequence, the function of which is to regulate gene expression
(Davidson, 2006b). Most commonly, cis-regulatory elements or modules are several
hundred base pairs long and are located within a few kilobases of the exons or within the
introns of the gene they control, though there are many examples of modules which exert
their influence over distances as great as 100 kb. A cis-regulatory module is comprised of
specific binding interaction having a functional meaning. A cis-regulatory module
typically includes many sites for ubiquitous DNA binding proteins, some of which are
involved in DNA looping or required for interaction with the basal transcription
apparatus. On average, a module will have binding sites for four to eight different
transcription factors (Arnone and Davidson, 1997), and several sites may be present for
some factors. To a rough approximation, more sites for a given factor afford the module
greater sensitivity to a given regulator. Frequently two or more different transcription
factors must be bound to a module in order for a gene to be activated (AND logic).
Alternately, any one of several different transcription factors may be sufficient to
generate an output, and the strength of the module’s regulatory activity depends
additively on the number of relevant interactions (OR logic). Repressor binding sites
(NOT logic) are often used to delineate expression boundaries.
A gene receives information about when and where it is in the course of
development by way of these transcription factor binding interactions. For example,
when a signal is received from a neighboring cell at a receptor, it typically causes a
cascade of protein-protein interactions, and the information conveyed by the signal
ultimately arrives at the nucleus in the form of a DNA binding transcription factor. If the
transcription factor is present at sufficient concentration, it will occupy target sites in an
array of target cis-regulatory modules, and thus communicate important spatial data to
the regulatory apparatus of the cell. Information about the current developmental state of
the cell itself is expressed via other transcription factors, which may be turned on or off
as a result of previous regulatory events. In this way, cis-regulatory elements read cellular
into a single directive to the basal transcription apparatus, thereby specifying the
appropriate outputs.
The recent wealth of genomic data has confirmed that bilaterians as simple as
nematodes and as complex as humans use the same basic tool kit of transcription factors
and signaling molecules to process spatial and temporal information during development
(Erwin and Davidson, 2002). The qualitative complexity of the developmental regulatory
tool kit is thus not correlated with genome or proteome size. Rather than relying upon a
vastly larger tool kit, complexity is increased with remarkable economy by reusing
transcription factors in additional unique ways in the course of later rounds of pattern
formation. Every regulatory gene has not just one but many cis-regulatory modules
which control the expression of the transcription factor it encodes in different spatial
domains at different times in development. One module may activate a gene in one
embryonic domain, while other modules assure that the same gene is repressed
simultaneously in neighboring domains. Yet another module may direct the gene’s later
involvement in patterning specialized structures or organs, while a late-acting module is
involved in cell differentiation. Hardwired into these individual modules is the correct
response of the gene to every diverse circumstance the cells of the organism will
encounter, throughout development and the lifetime of the organism. While to date only a
few cis-regulatory modules have been mapped in fine detail, it is clear that the same
strategies are used across the bilaterians to encode when and where in development genes
even-skipped
One of the first cis-regulatory modules to be characterized at the target site level
is the Drosophila gene even-skipped, or eve. The early Drosophila embryo is syncytial:
the nuclei exist within a common cytoplasm. Maternal mRNA localized at the anterior of
the embryo generates a diffusion gradient of Bicoid (Bcd) protein, a maternally encoded
transcription factor. Likewise, the transcription factor Caudal diffuses from the posterior
of the embryo, uninhibited by cellular membranes. These opposing gradients are used to
generate gradients of additional regulatory proteins, including Hunchback (Hb), Krüppel
(Kr), and Giant (Gt). By the early blastoderm stage, the syncytial nuclei have migrated to
the periphery of the embryo in preparation for the specification of territories
corresponding to future segments. The formation of individual cell membranes occurs
late in cleavage, but eve is activated in seven thin circumferential stripes only a few
nuclei wide prior to this (fig. I.1A), in response to the earlier established transcription
factor gradients.
The five cis-regulatory modules responsible for the expression of these stripes
have been identified (Andrioliet al., 2002; Frasch and Levine, 1987; Fujiokaet al., 1999;
Hardinget al., 1989; Macdonaldet al., 1986; Smallet al., 1996). Three modules drive the
expression of one stripe each, while two other modules control two stripes each (fig.
I.1B). The eve stripe 2 module is understood in the most detail, and is an excellent
example of how both positive and negative inputs can be combined to delineate very
precise spatial expression patterns. Two activators, Bicoid and Hunchback, are required
for stripe 2 expression, and four functional binding sites for Bcd plus one for Hb are
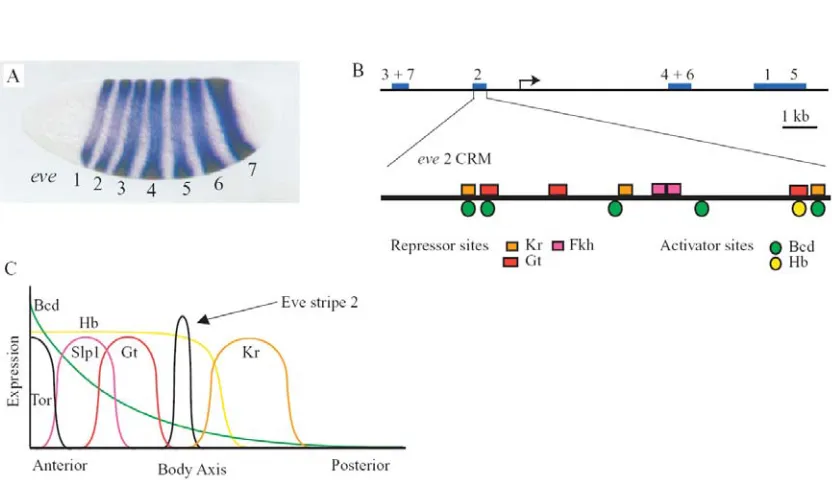
Figure I.1. The cis-regulatory module of eve stripe 2. A. RNA in situ hybridization with a
digoxigenin-labelled antisense probe reveals the seven stripes of expression in the Drosophila embryo (Small et al.,
1996). B. The five cis-regulatory modules that direct expression are located both upstream and downstream
of the transcription start site. Below is an expanded view of the eve stripe 2 module. The squares above the
line show the location of repressor binding site; circles below the line mark activator sites. Adapted from Andrioli et al., 2002. C. A qualitative graph summarizing the expression domains of transcription factors that are inputs to the eve stripe 2 regulatory module. Adapted from Stanojevic et al., 1991.
transcription factors are present in a broad section of the anterior embryo, they alone are insufficient to produce the narrow band seen in stripe 2. The gap gene repressors Giant, acting with an unknown corepressor, and Krüppel, are required to constrain the anterior and posterior boundaries of the stripe, respectively (Arnosti et al., 1996; Gray and Levine, 1996; Small et al., 1992). Accordingly, three binding sites for each repressor can also be found in the module. Mutation of these repressor sites results in the ectopic expansion of stripe 2. Anterior of the Giant domain, yet another repressor acts on the eve
2 module. Repression is actuated through two adjacent TTTGTTT motifs, most likely by the forkhead factor Sp1 and an unknown corepressor (Andrioli et al., 2002). Finally, repression of eve in the anterior tip of the embryo is controlled by a tyrosine receptor
combination of AND and NOT logic hardwired into the DNA upstream of the gene. The
eve 2 module draws on an array of spatial inputs established in the previous round of
specification, and it integrates this information into a single new transcriptional output, activatingthe gene in the spatial domain that it uniquely specifies.
dorsal and pha-4
As part of a network, regulatory genes not only take in multiple inputs, but also
make numerous downstream connections. It is via these downstream outputs that
information from the previous round of specification is both locked in and combined with
neighboring specification events. One mechanism by which a single gene can directly
activate a whole range of regulatory genes within an embryonic territory while adding
new information is by making use of a gradient. The importance of gradients in
development also illustrates how cis-regulatory elements can be tuned to respond to
precise cellular conditions.
Dorsal directs a well-known gradient network in Drosophila development.
Maternal Dorsal is most concentrated in the presumptive mesoderm in the ventral region
of the embryo, with the concentration falling off steeply in the lateral regions of the
embryo at the future neurogenic ectoderm boundary (Stathopoulos and Levine, 2002).
Genes downstream of dorsal have target sites with an array of sensitivities such that
individual genes are activated only in specific spatial territories of the embryo (Levine
and Davidson, 2005). For example, dorsal activates twist in only the most ventral region
of the embryo via a pair of low-affinity sites; in other regions the concentration of Dorsal
Dorsal gradient directly specifies between four and seven different thresholds of
activation.
C. elegans pharynx development is another example of how a regulatory gene
gradient can be used to orchestrate a gene network. In this case, the organ identity gene
pha-4 presides over temporal, rather than spatial, specification patterns. It has been
shown that the regulatory regions of most genes expressed during pharyngeal
development carry copies of the Pha-4 consensus binding sequence TRTTKRY (Gaudet
and Mango, 2002). Furthermore, higher and lower affinity Pha-4 sites are correlated with
earlier and later pharyngeal activation, respectively, and the onset of expression can be
advanced or delayed by altering the affinity of these sites. A picture emerges in which
pha-4 is at the nexus of pharynx development. Cued by rising Pha-4 levels, sets of genes
with differing Pha-4 sensitivity are sequentially activated, perhaps helping to coordinate
organogenesis among the five different cell types present in the mature pharynx. Because
pha-4 is so central to pharynx development, disabling it results in ablation of the whole
organ. Both dorsal and pha-4 exemplify how a concentration gradient can enable one
gene to send different signals to an array of targets over either developmental time or
space. They also demonstrate that cis-regulatory modules can be sensitive to not just the
presence or absence of key regulators, but can be set to respond to only very precise
cellular conditions.
endo16
The upstream regulatory region of endo16 in the sea urchin, Strongylocentrotus
modules function as hardwired information processing devices during development. The
endo16 gene is first expressed in the vegetal plate of blastula-stage embryos in a ring of
cells that will give rise to endodermal and mesodermal cell types. Expression is
specifically repressed in the skeletogenic progenitors at the center of the vegetal plate,
and in the surrounding ectoderm. During gastrulation, endo16 is expressed throughout the
archenteron. Subsequently, expression is turned off in the foregut, then in the hindgut,
[image:13.612.113.523.289.595.2]while intensifying in the midgut. A 2300 bp region upstream of the coding region
Figure I.2. The cis-regulatory logic of the endo16 promoter. Whole mount in situ hybridization shows endo16 expression at 30 h and 48 h. B. A detailed map of transcription factor binding sites within the 2300
bp region which correctly recapitulates endo16 gene expression. C. The behavior of modules A and B can
recapitulates this expression pattern when fused to a CAT reporter gene (Yuh et al.,
1994). The protein binding sites within the region were mapped in detail and it was
determined that nine different proteins bind at unique sites, and five additional proteins
bind at multiple sites within the regulatory domain.
The 2300 bp regulatory region can be understood as a collection of discrete cis
-regulatory modules A–G (fig. I.2B), each having a distinct role in defining correct spatial
and temporal expression of endo16. Likewise, within each module, every target site has a
specific function. As seen in figure I.2B, the overall domain naturally divides into
clusters of binding sites, with one or two uniquely occurring sites within each cluster.
Target sites for the architectural protein SpGCF1 are scattered throughout the regulatory
region and probably act to facilitate communication between non-adjacent modules;
SpGCF1 enables DNA looping by forming multimers once bound to DNA (Zeller et al.,
1995).
The most proximal subregion, module A, has a dual role as both gatekeeper and
activator. At all stages, it relays the output of the other modules to the basal promoter
(Yuh and Davidson, 1996). Also, boosted synergistically by module G, it drives the
initial appearance of endo16 in the vegetal plate. The primary activating input to module
A, SpOtx, is widely expressed in the early embryo (Yuh et al., 2001). Hence module DC
is required to repress ectopic endo16 expression in the skeletogenic precursors, while
modules E and F repress expression in the ectoderm. Mutagenesis studies indicate that
these repression signals are transmitted via site Z, directly adjacent to the SpOtx target in
Module B is the second main activator of endo16 and controls the late surge in
expression during gastrulation and differentiation of the midgut. The gut-specific
transcription factor Brn1/2/4 is the primary driver of the module, though interactions at
the CY, CB1, and CB2 target sites provide additional boosts in expression (Yuh et al.,
2001; Yuh et al., 2004). Module G continues to exert its synergistic influence. Once
again, the output of this module passes through module A, in this instance from the CB2
site in module B to sites P and CG1 in module A. If any of these sites is abolished, the
strong late rise in expression driven by module B is entirely absent.
Perhaps the most interesting aspect of the endo16 regulatory system is the manner
in which control of expression is handed off from module A to module B in the late
blastula stage. The switching function is encoded at target site R in module B, such that
when the output from Brn1/2/4 exceeds some threshold, a protein bound at R blocks
further input from the SpOtx site in module A (Yuh et al., 2001; Yuh et al., 2004). The
role of module A in this condition is then only to amplify the output of module B linearly,
by a factor close to four, and it is this enhanced regulatory impetus that is passed on to
the basal transcription apparatus. Throwing the “R”-mediated Otx vs. Brn1/2/4 switch
relieves the ongoing dependence of the system on the repressors binding in modules E, F,
and DC. These are needed for correct specification when the gene is driven by the
ubiquitously present SpOtx factor. Once under control of the gut-specific Brn1/2/4 in
module B, endo16 is enrolled in the process of gut differentiation.
In summary, the most important general aspects of the endo16cis-regulatory
system revealed by the experimental and computational analyses of Yuh et al. are
important regions of the system was tested, and each was demonstrated to play a specific
regulatory role. Second, these roles are distinct, and are qualitatively unique with respect
to one another. Third, as a whole, the system functions in a conditional manner,
depending on the inputs, and its operation can be summarized and predicted accurately by
a set of conditional logic statements. The endo16cis-regulatory system is thus an
example, indeed the best known such example, of a developmental logic processor that
equips the gene it controls to respond appropriately to all regulatory conditions it will
encounter in any cell of the embryo, over all developmental time.
Regulatory circuits and networks
Of course, no one gene can convey sufficient spatial information to generate
complex morphologies. Rather, morphology is generated by successive rounds of pattern
formation directed by networks of regulatory genes encoding transcription factors and
signaling proteins. A single tissue or structure in a bilaterian organism is the result of the
expression of hundreds or thousands of genes. Each node of a developmental network is a
cis-regulatory element, which translates upstream regulatory gene outputs into the more
refined expression of the next transcription factor in the cascade. Networks allow
complexity to be built up, with each round of specification adding information about the
structure of the developing body part.
A useful way to visually depict information flow in developmental gene
regulatory networks is by use of “logic maps,” treating various cis-regulatory interactions
Davidson, 2005). The object of a gene regulatory network model that portrays the logic
map for a given aspect of development is to connect the inputs and outputs of network.
Network logic can only be appreciated in this larger context. Depicting gene networks
this way highlights some common strategies that organisms use to achieve the remarkable
level of precision and control seen in developmental gene expression.
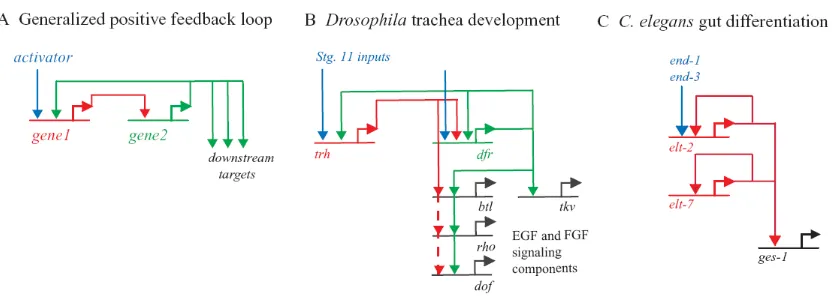
Positive feedback loops are one such mechanism, and are commonly used to
enforce the strictly forward progress of development (Bolouri and Davidson, 2002b;
Davidson et al., 2002b). In the generalized scheme depicted in figure I.3A, a signal from
an initial activator turns on gene 1. Gene 1 in turn activates gene 2, which passes the
activation signal to a group of downstream genes. However, gene 2 also generates a
[image:17.612.113.529.392.546.2]feedback loop with gene 1, such that when the initial activator subsides, genes 1 and 2
Figure I.3 Circuit diagrams of positive feedback loops. A. Once turned on by an activator, gene 1 (shown
in red) activates gene 2 (shown in green). In addition to acting on downstream targets, gene 2 activates gene 1, forming a positive feedback loop. When the initial activator signal fades, these genes will remain active. B. In an example from Drosophila trachea development, trh and dfr form a feedback loop. trh (red)
activates dfr (green), which completes the loop by in turn activating trh. The In this example, dfr also feeds
back on itself. C. In this variation of the circuit, the intermediary between the first activated gene and downstream target genes is dispensed with altogether: elt-2 (red) is directly activated by a transient signal
remain locked on, maintaining the new regulatory state of the cell. By
constructing the circuit this way, the initiating signal needs only be transient. Once the
feedback loop is in place, the downstream genes in developmental subsystems that are
constructed in this manner have no further dependence on the initiating transcription
factors. A benefit of this strategy is that early regulatory proteins are then free to be
enrolled in later specification and differentiation events without conflict.
Many variations on this type of positive feedback loop can be found in the
literature (Davidson et al., 2003). In one such example from Drosophila development, a
positive feedback loop is used to lock down tracheal specification within the initial field
of progenitor cells (fig. I.3B). Expression of the genes trachealess (trh) and drifter (dfr)
define the ten tracheal placodes in the postgastrula embryo, the cells of which will
invaginate and migrate to form the trachea (Metzger and Krasnow, 1999). Both genes are
activated by an array of A/P and D/V spatial inputs present in the stage 11 embryo
(Zelzer and Shilo, 2000). By the beginning of gastrulation, however, these cues have
been supplanted by a mutual and feedback circuit, as depicted in figure I.3B. Given the
incipient complex migration of these cells, establishing a self-sustaining regulatory state
is critical. This feedback loop locks down tracheal specification and in turn provides the
regulatory input to critical signaling pathways needed for migration and morphogenesis
(Zelzer and Shilo, 2000).
In C. elegans endoderm development, an intergenic feedback loop is used to
initiate and maintain gut differentiation (fig. I.3C). The activators of this circuit are the
GATA transcription factors end-1 and end-3, which drive elt-2 and elt-7 (Fukushige et
(Maduro and Rothman, 2002; Marshall and McGhee, 2001). This regulatory mechanism
varies slightly from the canonical loop in that elt-2 completes the circuit itself with an
auto-feedback loop. The defining feature of the circuit is the same, however: long after
the initial signals from end-1 and end-3 fade, the elt-2 gene maintains gut specification.
In fact, throughout the lifetime of the organism, disruption of elt-2 results in the loss of
gut specification (Fukushige et al., 1998). As shown in figure I.3C, the feedback loop is
the key to maintaining this persistence.
Another kind of architectural motif often found in gene regulatory networks
involves the use of repressors to create boundaries between cells with differing fates.
Gradients of positive inputs by themselves rarely suffice to define the sharp boundaries of
expression seen for genes that specify cell fates or given progenitor fields; these crisp
demarcations are generally imposed by repressors. An excellent example is found in
rhombomere (r) specification during mouse hindbrain development. Correct hox gene
expression is required to establish the identity of each rhombomere, namely hoxa2 and
hoxb2 in r3, and hoxb1 and hoxb2 in r4 (Barrow et al., 2000). As shown in figure I.4, the
activation of hoxa1 and hoxb1 in the future r4-r6 region simultaneously represses krox20
there, while causing the expression of a signal that results in the activation of krox20 in
the prospective r3 region (Barrow et al., 2000). krox20 activates a feedback loop that
drives the two hox genes which specify r3 identity, hoxa2 and hoxb2. Thus repression by
hoxb1 sharply divides the boundary between r3 and r4, locking off r3 fate in r4 cells.
These network devices, and several others that can be identified, are seen over and over
in bilaterian development. They provide explanations at the genomic level for observed
Figure I.4 Repression and boundary formation. Gene regulation in mouse rhombomeres is an example of
how repression can give rise to sharp boundaries between regions having different cell fates. krox20 is
instrumental in specifying r3 fate as a conditional input to hoxa2 and hoxb2, but in r4 it is repressed by the
same gene (hoxb1) that activates r4 specific hox genes.
regulatory genes interacting via cis-regulatory modules illuminates how static
information written in the DNA translates into the dynamic process of embryogenesis.
Furthermore, just as cis-regulatory modules draw on a tool kit of AND, OR, NOT, and
many other kinds of logic inputs, large developmental networks can be understood as
assemblies of smaller sub-circuits, or recurrent architectural motifs.
The S. purpuratus endomesoderm gene network
The most extensive gene regulatory network model constructed to date pertains to
encompasses regulatory events up to 20 - 24 h post-fertilization and just before
gastrulation, and includes linkages among about 50 genes, of which over 40 encode
transcription factors or signaling molecules (Davidson et al., 2002a; Davidson et al.,
2002b). The logic map connecting these many genes specifies how the instructions
distributed among the cis-regulatory modules of these genes work together to generate an
information cascade directing sea urchin development. Each cis-regulatory module
functions as a node in the network, with each module performing regulatory calculations
using inputs from other genes in the network. Several such nodes linked together function
as sub-circuits that establish discrete territories in the developing embryo, lock down
regulatory states or launch differentiation subroutines. Zooming out one step further, the
sum of these sub-circuits amounts to a specific proposition of the genomic code
indicating when, where, and why each gene is expressed so as to execute the specification
of three prominent domains of the embryo, namely the skeletogenic domain, the
remaining mesodermal domain, and the endodermal domain.
At 24 h, the S. purpuratus embryo is to the microscopist a still largely
unremarkable hollow ball of cells, except that the future skeletogenic cell population has
by now ingressed into the blastocoel. However, in terms of the spatial expression of
defined regulatory states, by this stage almost all cells in the embryo are already
specified, though of course their states of specification will further alter as development
proceeds. A recent version of the network model for endomesoderm specification is
shown in figure I.5 (the model is continuously updated on our website,
http://sugp.caltech.edu/endomes/; see legend for symbolism and details). The model
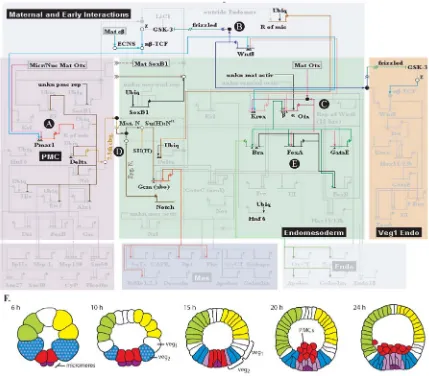
Figure I.5 The S. purpuratus endomesodermal gene regulatory network before gastrulation. The diagram
was assembled using qPCR data from a variety of perturbation experiments including injection of sea urchin eggs with morpholino anti-sense oligonucleotides, reporter constructs with wild-type and mutated
cis-regulatory DNA, and engrailed fusion constructs. Each gene is represented by a short horizontal line
veg2 lineage and specification is maintained by a Wnt8 feedback loop. C. The veg2 regulatory state is
locked down by progressive regulatory loops involving krox1, otx, and gataE. D. The inner veg2 cells are
specified as mesoderm precursors by a Delta signal originating in the micromeres. E. In the outer veg2
cells, GataE activates other endoderm genes which will prime the embryo for gastrulation. F. A map of the progressive specification of the sea urchin embryo.
occurring off the DNA are only indicated where necessary to make inputs into model cis
-regulatory elements intelligible, i.e., to denote maternal inputs or biochemical linkages
between signal receptors and the downstream transcription factors they animate. The
purpose of the model is the same as the purpose of the individual cis-regulatory analyses
discussed above: to make explicit the functional significance of each participating
element of the genomic DNA regulatory code. It is neither a kinetic transcription model
nor a biochemical transcription model. It is not about how these transcriptional systems
work, but rather about the structure/function relationships within the DNA that encodes
the guiding program for this aspect of development.
S. purpuratus development up to 24 h can be summarized briefly (Davidson et al.,
1998). The zygotic regulatory processes can first be tracked at fourth and fifth cleavage,
when the small and large micromeres are formed at the vegetal pole of the embryo. The
invariant fate of the large micromeres is to serve as the skeletogenic precursor lineage of
the embryo. After sixth cleavage, the veg2 and veg1 lineages arise as concentric rings of
cells surrounding the micromeres. By 15 h the veg2 cells have begun the process of
specification into future endoderm or mesoderm. By 24 h, the skeletogenic precursors
have ingressed into the blastocoel, endoderm and mesoderm specification is complete,
and the embryo is primed for gastrulation. This apparent morphological simplicity up to
figure I.5 is launched at the moment of fertilization, guiding the embryo through an ever
more complex succession of regulatory states. In figure I.5, early maternal inputs are
depicted in the gray box at top, while programs running in the large or skeletogenic
micromeres are illustrated in the pink box at left. The central green area includes genes
running in endoderm or mesoderm from cleavage through 24 h.
The first regulatory event of note depicted in the model is the specification of the
micromeres via a dual repression circuit, an unexpected and almost counterintuitive
mechanism for imposing a state of specification on an early embryonic cell lineage. In all
other territories of the embryo, primary skeletogenic regulatory and signaling genes,
including delta, alx1, ets1, and tbrain (tbr), are actively repressed by the product of a
gene which has yet to be identified. In the micromeres, however, nuclearization of
maternal β-catenin and Otx activates pmar1, deactivates the gene encoding the repressor,
and thus launches the skeletogenic subroutine in only these cells (Oliveri et al., 2002;
Oliveri et al., 2003). This linkage is most likely direct, as the cis-regulatory module
driving pmar1 expression in the micromeres contains putative TCF and Otx target sites.
A few hours later, these initial skeletogenic regulatory genes activate several additional
regulatory genes, viz., deadringer (dri), foxb, and goosecoid. These genes, together with
the initial regulators tbr, alx1 and the ubiquitously expressed activator hnf6, constitute the
known immediate governors of the terminal skeletogenic genes (see fig. I.5).
The network model also provides an explanation of how the adjacent veg2 lineage
is initially specified (Davidson et al., 2002b). In this domain, an early signal from the
micromeres and nuclearization of maternal factors set up the initial endomesodermal
developmental process. For example, maternal β-catenin activates the gene encoding the
signaling molecule Wnt8, which in turn results in further β-catenin nuclearization. This
circuit creates a self-sustaining “community effect” among veg2 cells; mediated by the β
-catenin/TCF system, these cells are maintained in a common regulatory state (Gurdon et
al., 1993).
Shortly after the β-catenin/TCF system is thus locked on in the veg2
endomesoderm (about 8th cleavage), this input, together with a maternal/early zygotic
form of Otx, activates the endomesodermal regulatory gene krox/blimp11. A few hours
later, krox/blimp1 in turn drives embryonic otx expression via a newly activated zygotic
cis-regulatory element. Remarkably, there follows the institution of an additional
regulatory loop, as the otx gene product is now required to activate the gataE gene, which
then reciprocates by activating the zygotic otx gene control element (see fig. I.5). Soon
thereafter the krox1 gene ceases to be expressed in the veg2 endomesodermal domain.
Indeed, its expression is no longer necessary there, as otx and gataE are now locked in a
positive regulatory embrace and no longer require the inputs needed for their initial
activation. The net effect of these positive feedback loops is to transfer control of the
induced regulatory state to the embryo, and relieve the system of its dependence on
maternal and ephemerally expressed early zygotic inputs. Once these feedback loops are
in place, veg2 endomesodermal specification is locked in.
In another coincident specification event, a combination of signaling and
repression is used to subdivide the veg2 lineage into mesoderm and endoderm precursors.
The regulatory subroutine running in the micromeres includes among its targets a gene
between the seventh and ninth cleavages, when it is received in the innermost cells of the
veg2 domain (Amore et al., 2003; Davidson et al., 2002b). The Delta signal provides the
spatial cue that specifies the mesoderm, by causing the adjacent cells receiving it to
activate the Notch pathway. One immediate effect is the activation of gcm in a single ring
of cells abutting the micromeres. Once activated, this gene also utilizes an auto-feedback
loop to lock itself on, one of the most common regulatory motifs. Its function is to drive a
battery of differentiation genes specific to mesoderm pigment cells, in which it continues
to be expressed throughout embryogenesis (Ransick et al., 2002a).
In the more outer veg2 domain, GataE activates many other endomesodermal
regulatory genes, its expression having been stabilized, as noted above, by a feedback
relationship with the otx gene (Davidson et al., 2002b). GataE targets perform several
important roles in the ongoing specification of the endoderm. It activates the repressor
foxA, which will establish the correct boundary for brachyury (bra) and foxB expression
during gastrulation. Later, bra will directly control a battery of endoderm motility genes
required for gastrulation (Rast et al., 2002). In conjunction with a late wnt8 signal, gataE
also plays a role in specifying cells of the inner veg1 domain as endoderm (Ransick and
Davidson, 1998). The function of the feedback circuitry upstream of gataE is thus
ultimately to ensure the stable expression of this centrally important regulator of the
endomesoderm.
The logic map for endomesoderm specification in S. purpuratus shows explicitly
how common regulatory subcircuits have been assembled to produce a unique and
complex developmental program. The regulatory network operates progressively (for a
cytoplasmic, and it uses these to set in motion the initial tier of zygotic gene expression.
These genes are in turn utilized to generate more and more spatially precise cues. The
culmination of the specification process is the activation of specific differentiation
batteries throughout the embryo. The individual circuits each make a contribution to the
system, but the overall logic of the network can truly only be appreciated as a whole.
This perspective has proven useful in understanding specification events in
diverse models of development, and several other systems have been described in detail
as multigene networks of interacting transcription factors. The Drosophila Dorsal
gradient network maps interactions between nearly 60 genes, and the system uses a
distinctive set of logic circuits that may be specific to syncytial embryos (Levine and
Davidson, 2005; Stathopoulos and Levine, 2002). In C. elegans, in addition to the Pha-4
network described above, a network of genes directing specification of the C-blastomere
lineage has been elaborated, beginning with the homeobox transcription factor Pal-1
(Baugh et al., 2005). Most recently, a provisional gene network describing specification
of the Ciona intestinalis embryo has been laid out, describing connections between 76
zygotically expressed regulatory genes. As more networks are mapped in detail,
interspecies comparisons will shed light on the mechanics of evolution. Knowledge of the
cis-regulatory modules of different genes in different species, and of the network
connections between these modules, will offer insight into how the evolution of
A genomic approach to completing the network
While the sea urchin endomesodermal gene networks is one of the best
characterized developmental gene regulatory networks, the model is not complete.
Indeed, the identities of several key regulators are still not known. In addition, there may
be other nodes in the network that are completely missing. If the goal is to fully
understand the logic of this network, we must be certain that there are no gaps in our
model.
In the past, a difficulty with uncovering additional genes relevant to this network
has been that transcription factors are sometimes expressed in only a few cells or at very
low levels, meaning even important factors can be rare in EST and macroarray libraries
(Davidson, 1986). Overcoming this problem generally involves laborious and
time-consuming methods. An example is the method used to identify upstream activators of
endo16. Embryonic nuclear extracts from the appropriate time points were passed
through a DNA column consisting of target sites from the endo16 cis-regulatory region.
The captured proteins were then digested and partially sequenced, and the corresponding
macroarrayed clones were identified using degenerate, complementary probes. However,
in addition to being very time consuming, this method is limited to identifying upstream
regulators of known network genes. To identify downstream targets, a subtractive cDNA
assay was developed to deplete housekeeping gene messages and concentrate specifically
up-regulated transcripts from perturbed vs. control embryos. A macroarray library of the
expressed network genes (Rast et al., 2002). However, this strategy can never definitively
demonstrate that all relevant low-copy transcripts have been found.
In this work, we have made use of the recent sequencing of the
Strongylocentrotus purpuratus genome to move towards the definitive completion of the
endomesodermal gene network by identifying all the transcription factors in the genome.
The beauty of this new approach lies in the fact that the DNA binding domains present in
transcription factors are generally very conserved between species. Hence, an exhaustive
search for these sequence motifs in the genome can be used to generate a reliable, nearly
complete list of regulatory genes. Once found, all the uncovered factors can then be
assessed for embryonic expression, revealing any still unrecognized players in
endomesoderm specification as well as creating a database that will be useful in
describing patterning in other parts of the embryo.
A compilation of data on transcription factor usage in sea urchin development will
also be interesting in itself. Microarray experiments have become common tools for
studying gene usage patterns in organisms with sequenced genomes, and a number of
these studies provide interesting comparisons between regulatory gene usage and that of
other classes of genes during development. In one such study of Drosophila
melanogaster gene expression, 4028 assayed genes were sorted by functional class (about
one-third of predicted genes), and it was noted which classes were used lightly or heavily
during the major life stages of the organism (Arbeitman et al., 2002). Interestingly,
transcription factors, signaling molecules, and cell cycle genes were all found to have
their overall peak expression usage during embryogenesis, with overall expression levels
used a microarray incorporating 25,000 unique genes from embryonic and adult tissues to
track transcription from embryonic day 8 to birth. Grouping the genes by their gene
ontology classification revealed that transcription factors and cell cycle genes were
similarly expressed at their highest level during early embryogenesis (Wagner et al.,
2005). Microarrays have also been used to examine overall gene expression in C. elegans
development. One very thorough study looked at gene expression over a range of time
points encompassing most specification events in C. elegans development (4-cell through
190-cell stages), and found similar biases in transcription factor usage (Baugh et al.,
2003). In this study, genes were grouped by functional class and it was asked whether
specific classes were overrepresented at various embryonic time points. Again, while the
focus was not specifically on regulatory gene usage, as a group these genes are
consistently overrepresented among transiently expressed genes at a number of
embryonic time points, and under-represented among genes expressed only maternally.
These results emphasize the central role the tool kit of signaling and regulatory genes
plays in patterning the embryo.
To date, the most comprehensive study of transcription factors in development
has been done in Ciona intestinalis. Transcription factors and signaling molecules were
systematically identified in the Ciona genome, and the expression of 352 regulatory and
signaling genes was determined by in situ hybridization up to the mid-late tailbud stage
(Imai et al., 2004; Miwata et al., 2006; Satou and Satoh, 2005). The result of this analysis
shows that the majority of these genes are used during development. Strikingly, 74% are
expressed as maternal messages in the egg, and 56% are expressed zygotically; only 14
then used to lay the foundations for a gene regulatory network describing the patterning
of the early ciona embryo (Imai et al., 2006). Since the sea urchin will be only the second
organism with such a detailed accounting of transcription factor usage during
embryogenesis, it will be interesting to see if similar or different patterns emerge. The
comparison between these two organisms will be particularly interesting as the sea urchin
develops through a maximally indirect mechanism: the larval structure laid out during
embryogenesis is ultimately completely reabsorbed and the adult body plan arises from
only a small subset of set-aside cells.
Conclusion
Cis-regulatory architecture lies at the heart of fundamental questions in biology.
In a causal sense, cis-regulatory and gene network architecture provide the explanation of
how development is determined by the regulatory DNA sequence. From emerging
developmental gene regulatory networks in several model organisms, it is clear that these
networks are built up from certain basic subroutines. With the sequencing of the sea
urchin genome, it now becomes practical to fully describe one such system, the sea
urchin endomesodermal gene regulatory network. Identifying and characterizing the
developmental expression of all the transcription factors in the organism’s genome will
highlight any players still missing from the network. Furthermore, the compiled statistics
on regulatory gene expression will provide further insight into how these genes as a
References
Amore, G., Yavrouian, R. G., Peterson, K. J., Ransick, A., McClay, D. R., Davidson, E. H., 2003. Spdeadringer, a sea urchin embryo gene required separately in
skeletogenic and oral ectoderm gene regulatory networks. Dev. Biol. 261, 55-81. Andrioli, L. P. M., Vasisht, V., Theodosopoulou, E., Oberstein, A., Small, S., 2002.
Anterior repression of a Drosophila stripe enhancer requires three
position-specific mechanisms. Development 129, 4931-4940.
Arbeitman, M. N., Furlong, E. E. M., Imam, F., Johnson, E., Null, B. H., Baker, B. S., Krasnow, M. A., Scott, M. P., Davis, R. W., White, K. P., 2002. Gene expression during the life cycle of Drosophila melanogaster. Science 297, 2270-2275.
Arnone, M. I., Davidson, E. H., 1997. The hardwiring of development: Organization and function of genomic regulatory systems. Development 124, 1851-1864.
Arnosti, D. N., Barolo, S., Levine, M., Small, S., 1996. The eve stripe 2 enhancer
employs multiple modes of transcriptional synergy. Development 122, 205-214. Barrow, J. R., Stadler, H. S., Capecchi, M. R., 2000. Roles of Hoxa1 and Hoxa2 in
patterning the early hindbrain of the mouse. Development 127, 933-944. Baugh, L. R., Hill, A. A., Claggett, J. M., Hill-Harfe, K., Wen, J. C., Slonim, D. K.,
Brown, E. L., Hunter, C. P., 2005. The homeodomain protein Pal-1 specifies a lineage-specific regulatory network in the C. elegans embryo. Development 132,
1843-1854.
Baugh, L. R., Hill, A. A., Slonim, D. K., Brown, E. L., Hunter, C. P., 2003. Composition and dynamics of the Caenorhabditis elegans early embryonic transcriptome.
Development 130, 889-900.
Bolouri, H., Davidson, E. H., 2002a. Modeling DNA sequence-based cis-regulatory gene
networks. Dev. Biol. 246, 2-13.
Bolouri, H., Davidson, E. H., 2002b. Modeling transcriptional regulatory networks. Bioessays 24, 1118-1129.
Davidson, E. H. 1986. Gene Activity in Early Development. Academic Press, Orlando. Davidson, E. H. 2006. Genomic Regulatory Systems. Academic Press, San Diego. Davidson, E. H., Cameron, R. A., Ransick, A., 1998. Specification of cell fate in the sea
urchin embryo: summary and some proposed mechanisms. Development 125, 3269-3290.
Davidson, E. H., McClay, D. R., Hood, L., 2003. Regulatory gene networks and the properties of the developmental process. Proc. Natl. Acad. Sci. USA 100, 1475-1480.
Davidson, E. H., Rast, J. P., Oliveri, P., Ransick, A., Calestani, C., Yuh, C. H.,
Bolouri, H., 2002a. A genomic regulatory network for development. Science 295, 1669-1678.
Davidson, E. H., Rast, J. P., Oliveri, P., Ransick, A., Calestani, C., Yuh, C. H.,
Minokawa, T., Amore, G., Hinman, V., Arenas-Mena, C., Otim, O., Brown, C. T., Livi, C. B., Lee, P. Y., Revilla, R., Schilstra, M. J., Clarke, P. J. C., Rust, A. G., Pan, Z. J., Arnone, M. I., Rowen, L., Cameron, R. A., McClay, D. R., Hood, L., Bolouri, H., 2002b. A provisional regulatory gene network for specification of endomesoderm in the sea urchin embryo. Dev. Biol. 246, 162-190.
Erwin, D. H., Davidson, E. H., 2002. The last common bilaterian ancestor. Development 129, 3021-3032.
Frasch, M., Levine, M., 1987. Complementary patterns of even-skipped and fushi-tarazu
expression involve their differential regulation by a common set of segmentation genes in Drosophila. Genes & Development 1, 981-995.
Fujioka, M., Emi-Sarker, Y., Yusibova, G. L., Goto, T., Jaynes, J. B., 1999. Analysis of an even-skipped rescue transgene reveals both composite and discrete neuronal
and early blastoderm enhancers, and multi-stripe positioning by gap gene repressor gradients. Development 126, 2527-2538.
Fukushige, T., Hawkins, M. G., McGhee, J. D., 1998. The GATA-factor elt-2 is essential
for formation of the Caenorhabditis elegans intestine. Dev. Biol. 198, 286-302.
Gaudet, J., Mango, S. E., 2002. Regulation of organogenesis by the Caenorhabditis elegans, FoxA protein Pha-4. Science 295, 821-825.
Gray, S., Levine, M., 1996. Transcriptional repression in development. Curr. Opin. Cell Biol. 8, 358-364.
Gurdon, J. B., Lemaire, P., Kato, K., 1993. Community effects and related phenomena in development. Cell 75, 831-834.
Harding, K., Hoey, T., Warrior, R., Levine, M., 1989. Autoregulatory and gap gene response elements of the even-skipped promoter of Drosophila. EMBO J 8,
1205-1212.
Imai, K. S., Hino, K., Yagi, K., Satoh, N., Satou, Y., 2004. Gene expression profiles of transcription factors and signaling molecules in the ascidian embryo: Towards a comprehensive understanding of gene networks. Development 131, 4047-4058. Imai, K. S., Levine, M., Satoh, N., Satou, Y., 2006. Regulatory blueprint for a chordate
embryo. Science 312, 1183-1187.
Istrail, S., Davidson, E. H., 2005. Logic functions of the genomic cis-regulatory code.
Proc. Natl. Acad. Sci. USA 102, 4954-4959.
Jiang, J., Levine, M., 1993. Binding affinities and cooperative interactions with bHLH activators delimit threshold responses to the Dorsal gradient morphogen. Cell 72, 741-752.
Levine, M., Davidson, E. H., 2005. Gene regulatory networks for development. Proc. Natl. Acad. Sci. USA 102, 4936-4942.
Macdonald, P. M., Ingham, P., Struhl, G., 1986. Isolation, structure, and expression of
even-skipped – a 2nd pair-rule gene of Drosophila containing a homeobox. Cell
47, 721-734.
Marshall, S. D. G., McGhee, J. D., 2001. Coordination of ges-1 expression between the Caenorhabditis pharynx and intestine. Dev. Biol. 239, 350-363.
Metzger, R. J., Krasnow, M. A., 1999. Development – Genetic control of branching morphogenesis. Science 284, 1635-1639.
Miwata, K., Chiba, T., Horii, R., Yamada, L., Kubo, A., Miyamura, D., Satoh, N., Satou, Y., 2006. Systematic analysis of embryonic expression profiles of zinc finger genes in Ciona intestinalis. Dev. Biol. 292, 546-554.
Oliveri, P., Carrick, D. M., Davidson, E. H., 2002. A regulatory gene network that directs micromere specification in the sea urchin embryo. Dev. Biol. 246, 209-228. Oliveri, P., Davidson, E. H., McClay, D. R., 2003. Activation of pmar1 controls
specification of micromeres in the sea urchin embryo. Dev. Biol. 258, 32-43. Ransick, A., Davidson, E. H., 1998. Late specification of veg(1) lineages to endodermal
fate in the sea urchin embryo. Dev. Biol. 195, 38-48.
Ransick, A., Rast, J. P., Minokawa, T., Calestani, C., Davidson, E. H., 2002. New early zygotic regulators expressed in endomesoderm of sea urchin embryos discovered by differential array hybridization. Dev. Biol. 246, 132-147.
Rast, J. P., Cameron, R. A., Poustka, A. J., Davidson, E. H., 2002. Brachyury target genes in the early sea urchin embryo isolated by differential macroarray screening. Dev. Biol. 246, 191-208.
Satou, Y., Satoh, N., 2005. Cataloging transcription factor and major signaling molecule genes for functional genomic studies in Ciona intestinalis. Dev. Genes Evol. 215,
580-596.
Small, S., Blair, A., Levine, M., 1992. Regulation of even-skipped stripe-2 in the Drosophila embryo. EMBO J 11, 4047-4057.
Small, S., Blair, A., Levine, M., 1996. Regulation of two pair-rule stripes by a single enhancer in the Drosophila embryo. Dev. Biol. 175, 314-324.
Stanojevic, D., Small, S., Levine, M., 1991. Regulation of a segmentation stripe by overlapping activators and repressors in the Drosophila embryo. Science 254,
1385-1387.
Stathopoulos, A., Levine, M., 2002. Dorsal gradient networks in the Drosophila embryo.
Dev. Biol. 246, 57-67.
Wagner, R. A., Tabibiazar, R., Liao, A., Quertermous, T., 2005. Genome-wide
expression dynamics during mouse embryonic development reveal similarities to
Drosophila development. Dev. Biol. 288, 595-611.
Yuh, C. H., Bolouri, H., Davidson, E. H., 1998. Genomic cis-regulatory logic:
Experimental and computational analysis of a sea urchin gene. Science 279, 1896-1902.
Yuh, C. H., Bolouri, H., Davidson, E. H., 2001. Cis-regulatory logic in the endo16 gene:
switching from a specification to a differentiation mode of control. Development 128, 617-629.
Yuh, C. H., Davidson, E. H., 1996. Modular cis-regulatory organization of endo16, a
gut-specific gene of the sea urchin embryo. Development 122, 1069-1082.
Yuh, C. H., Dorman, E. R., Howard, M. L., Davidson, E. H., 2004. An otxcis-regulatory
Yuh, C. H., Ransick, A., Martinez, P., Britten, R. J., Davidson, E. H., 1994. Complexity and organization of DNA-protein interactions in the 5'-regulatory region of an endoderm-specific marker gene in the sea-urchin embryo. Mech. Dev. 47, 165-186.
Zeller, R. W., Britten, R. J., Davidson, E. H., 1995. Developmental utilization of Spp3a1
and Spp3a2 – 2 proteins which recognize the same DNA target site in several
sea-urchin gene regulatory regions. Dev. Biol. 170, 75-82.
Zelzer, E., Shilo, B. Z., 2000. Cell fate choices in Drosophila tracheal morphogenesis.
Bioessays 22, 219-226.
Zhu, J. W., Hill, R. J., Heid, P. J., Fukuyama, M., Sugimoto, A., Priess, J. R., Rothman, J. H., 1997. end-1 encodes an apparent GATA factor that specifies the endoderm
precursor in Caenorhabditis elegans embryos. Genes & Development 11,
Chapter 1
Identification and Characterization of Homeobox Transcription Factor Genes in S.
purpuratus, and Their Expression in Embryonic Development
Meredith Howard-Ashby, Stefan C. Materna, C. Titus Brown, Lily Chen, R. Andrew
Cameron, and Eric H. Davidson
In press, Developmental Biology.
Abstract
A set of 96 homeobox transcription factors was identified in the
Strongylocentrotus purpuratus genome using permissive blast searches with a large
collection of authentic homeodomain sequences from mouse, human and fly. A
phylogenetic tree was constructed to compare the sea urchin homeobox gene family to
those of vertebrates, with the result that with the only a few exceptions, orthologs of all
vertebrate homeodomain genes were uncovered by our search. QPCR time course
measurements revealed that 65% of these genes are expressed within the first 48 hours of
development (late gastrula). For genes displaying sufficiently high levels of transcript
during the first 24 hours of development (late blastula), whole mount in situ hybridization
was carried out up to 48 hours to determine spatial patterns of expression. The results
developmental functions, in that they are used at a range of time points and in every
Introduction
Transcription factors are the key players in the gene networks directing
development. These networks consist essentially of genes encoding sequence specific
regulatory proteins, the targets of which encode other transcription factors, thereby
initiating cascades of overlapping directives which ultimately specify the many
embryonic territories. To solve the architecture of developmental gene networks requires
primary knowledge of which transcription factors are active in the embryo and when and
where they are expressed. The availability of the Strongylocentrotus purpuratus genome
sequence, which has just been obtained by the Human Genome Sequencing Center at
Baylor College of Medicine (http://www.hgsc.bcm.tmc.edu/projects/seaurchin/;
http://www.ncbi.nlm.nih.gov/genome/guide/seaurchin/), has made it possible to identify
systematically all the transcription factors encoded in the genome. Thus we sought to find
and annotate all genes encoding sequence specific DNA binding proteins predicted by the
genome sequence. We then determined whether each is expressed in the early to
mid-stage embryo, and, for active genes, established the temporal and spatial modes of
expression.
Transcription factors fall into several large families defined by the structures of
their DNA binding domains. The largest of these families in S. purpuratus is the Zn
Finger family, an analysis of which is described in another paper of this series (Materna
et al., 2006). The next largest is our present subject, the homeodomain family. Here we
consider all subclasses of homeodomain regulatory genes except for the hox and parahox
transcription factors are dealt with in additional papers (Ets family factors, (Rizzo et al.,
2006); Forkhead family factors, (Tu et al., 2006); and all other families (Howard-Ashby
et al., 2006).
Materials and methods
Identification of transcription factor sequences
Most of the transcription factors considered here were initially identified from the
unassembled sea urchin genome traces and the November, 2004 Baylor University draft
genome assembly using a reference database of known transcription factors (excluding
zinc fingers). This “rake,” was assembled from two sources: nr human, mouse and fly
sequences tagged as “transcription factor” and the GO seqdblite databases GO:0003700,
GO:0000130, GO:0030528, GO:0003705, GO:0003702, and GO:0003677. Entries were
removed if they contained the descriptors “general transcription factor II,” “TFII,”
“TFIII,” “protease,” “histone,” “reverse transcriptase,” “nucleosome,” “RNA
polymerase,” “DNA replications,” “chromatin,” “helicase,” “DNase,” or “exonuclease.”
Any nonhomeodomain/nonGATA zinc finger proteins were also removed from the rake
database. The final rake contained approximately 4900 protein sequences.
Tblastn (Altschul et al., 1990) of the protein sequences in the rake against the
individual traces, as well as the translated Baylor draft assembly (cutoff = e-10) was used
to coarsely identify all traces or contigs potentially encoding transcription factors. Blastx
highlight the locations of exons encoding transcription factor specific conserved domains
(e.g., bHLH, homeodomain, sox). Finally, the isolated conserved domains were blasted
(tblastn) against NCBI’s nr database to establish the closest known homologues. To avoid
redundancy, efforts were made to group multiple exons from the same protein.
Complementary exons from the same large contig as well as complementary exons from
smaller contigs with the same closest homologues were assigned one unique
number/gene name. PCR of sea urchin cDNA was used to confirm that different exons
were in fact part of the same transcript. Our set of newly identified genes was then
compared to those in the Baylor GLEAN3 gene models. There were approximately 30 of
our genes not present in the GLEAN3 database. Similarly, we added approximately 25
new transcription factors to our data set after finding them among the GLEAN3 models.
All of the data obtained in this study were incorporated in the sea urchin genome
annotation effort orchestrated by HGSC at Baylor College of Medicine.
Phylogenetic analysis
A phylogenetic tree comparing sea urchin homeobox genes and homologues from
multiple other species was constructed in order to name accurately the newly identified
genes. Reference homeodomain sequences from H. sapiens, C. elegans, C. briggsae, D.
rerio, D. melanogaster, and M. mus were obtained from the supplementary materials of
Nam and Nei (Nam and Nei, 2005) and from NCBI by BLAST 2.2.12 (Altschul et al.,
1990) search of nr with S. purpuratus homeobox sequences. Multiple sequence alignment
The tree was constructed with MEGA version 3. (Kumar et al., 2004) using the neighbor
joining method and 1000 bootstrap replications. In addition to the data shown here, a
more exhaustive tree including sequences from all the above species can be found in the
supplementary materials, along with all the homeodomain sequences used.
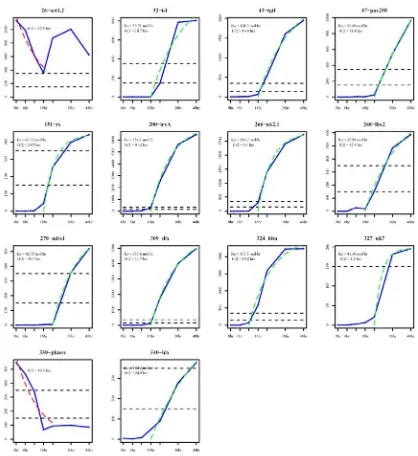
QPCR data
QPCR was used to determine the expression profile of each identified
transcription factor from unfertilized egg to 48 h. mRNA was isolated from egg, 6, 12,
18, 24, 36, and 48 h embryos with the Sigma GenElute Mammalian Total RNA Miniprep
Kit, per the manufacturers instructions. Residual DNA was digested with DNase I using
the DNA-free kit (Ambion, Austin, TX). cDNA was prepared from 38.5 μL of mRNA
sample using the TaqMan Reverse Transcription Reagents Kit (Applied Biosystems,
Foster City, CA) in a 100 μL reaction, following the kit instructions. QPCR primers were
chosen such that amplicons were preferably between 100 and 140 bp long, though in
some cases amplicons were as short as 80 bp or as long as 160 bp. Primer and amplicon
sequences can be found online at http://sugp.caltech.edu. To avoid primer inefficiency
due to the high rate of polymorphism in the sea urchin genome, primers were chosen to
be within the most conserved DNA binding domain of each transcription factor.
Amplification reactions were analyzed on an ABI 5700 sequence detection system using
SYBR Green chemistry (PE Biosystems, Foster City, CA). All primer pairs were
validated by QPCR against a positive (genomic DNA) and negative (water) control. Each
primer mix (5 μM each), 1 μL digested genomic DNA (40 ng) or water, and 6.6 μL
water. Template genomic DNA was a mixture of KpnI and EcoRI digested genomic
DNA. Expression was measured at six time points in triplicate: egg, 6, 12, 18, 24, 36, and
48 h. Each 10 μL reaction included 5 μL SYBR Green reagent, 2.5 μL forward and
reverse primer mix (5 μM each), 0.5 μL cDNA, and 3.3 μL. Thermal cycling parameters
were 95 °C for 30 s, 60 °C for 1 min, 40 cycles, followed by a denaturation step to verify
a single product. All QPCR experiments were performed in triplicate against two
preparations of cDNA.
A QPCR experiment measures the number of cycles needed to attain a threshold
concentration of QPCR product (Ct). The number of cycles needed for the standard to
reach a specified (Ct) can be compared to the Ct for an unknown. A higher Ct for the
unknown implies a lower initial concentration in the sample, and vice versa. The
threshold value is chosen to fall within the exponential amplification phase, before
limiting reagents become a factor in the efficiency of each cycle. Given that ubiquitin
sequence domains are present at a constant 87,000 copies/embryo (Nemer et al., 1991;
Ransick et al., 2002), and assuming a QPCR amplification rate of 1.9-fold per cycle, the
difference in Ct between an unknown and ubiquitin for a given sample can be translated
directly into the number of copies per embryo. Our QPCR data were compared to the
genome tiling array data as an external control for the identification of unexpressed genes
(Samanta et al., 2006). While the tiling data are not quantitative, genes which are not
expressed in the early embryo should not give any signal. The two data sets are in strong
signal according to the tiling array data. Alternately, positive QPCR results were always
supported by the tiling array data.
The time course data were plotted on a logarithmic scale to simplify comparison
of expression profiles with very different minimum and maximums. Each gene was
categorized as to whether expression was maternal only, maternal and zygotic, zygotic
only, constant, or null up to 48 h. Genes expressed zygotically were further categorized
as to the time by which expression is first activated. Complete time course data can be
found online at http://sugp.caltech.edu/ .
Whole mount in situ hybridization
In situ probes were designed for genes with zygotic expression within the
minimum significant range by 24 h post-fertilization. We attempted to use probes at least
600 bp long, though in some cases shorter probes were used if they gave a positive,
specific result. The sequence of the probes was derived either from a sufficiently long
exon or multiple exons discovered in our blast searches, or from message sequence
identified by blastn against cDNA libraries submitted to NCBI, or from a Genscan
prediction of additional exons present on the same contig as a known exon.
All probe sequences were initially amplified using the Expand Hi-Fidelity PCR
System (Roche) and sea urchin cDNA and confirmed by sequencing using ABI Prism
BigDye Terminator Cycle Sequencing on an ABI 377 sequencer (Applied Biosystems,
Foster City, CA). Probes were transcribed either from linearized plasmid after cloning the