This is a repository copy of The restructuring and future of the British Rail system. White Rose Research Online URL for this paper:
http://eprints.whiterose.ac.uk/2288/
Monograph:
Merkert, Rico (2005) The restructuring and future of the British Rail system. Working Paper. Institute of Transport Studies, University of Leeds , Leeds, UK.
Working Paper 586
[email protected] https://eprints.whiterose.ac.uk/
Reuse See Attached
Takedown
If you consider content in White Rose Research Online to be in breach of UK law, please notify us by
White Rose Research Online
http://eprints.whiterose.ac.uk/Institute of Transport Studies
University of Leeds
This is an ITS Working Paper produced and published by the University of Leeds. ITS Working Papers are intended to provide information and encourage discussion on a topic in advance of formal publication. They represent only the views of the authors, and do not necessarily reflect the views or approval of the sponsors.
White Rose Repository URL for this paper: http://eprints.whiterose.ac.uk/2288/
Published paper
Rico Merkert (2005) The Restructuring and Future of the British Rail System.
Institute of Transport Studies, University of Leeds, Working Paper 586
INSTITUTE FOR TRANSPORT STUDIES
UNIVERSITY OF LEEDS
ITS Working Paper 586 February 2005
The Restructuring and Future of the
British Rail System
Author
Rico Merkert
ITS Working Papers are intended to provide information and encourage discussion on a topic in advance of formal publication. They represent only the views of the authors, and do not
necessarily reflect the views or approval of the sponsors.
The Restructuring and Future of the British Rail System
RICO MERKERT
Institute for Transport Studies, University of Leeds Department for Economic Policy, University of Potsdam
email: [email protected]
Abstract
The paper focuses mainly on reviewing and analysing the restructuring of Britain’s railways, including the re-cently published proposals for its future. The objective is to investigate the current market structure, the market behaviour and the overall performance of the British rail system over time. In order to learn what other people think about the problems of the industry and their solutions, interviews with key people associated with the in-dustry and several submissions of some key interest parties to the 2004 railway structure review are used in this paper. The results are that all major characteristics of the rail reform in Britain are seen as workable and empiri-cal data reveal that they have worked comparatively successfully, before Hatfield. Because of bad implementa-tion some of the features, and in particular the private infrastructure manager, have not worked well. Most of the problems have arisen because of indecision over refranchising and the disruption following Hatfield. Further-more the policy of the Government after Hatfield created an extremely risk averse culture within the industry, at a time when Railtrack had not enough insights about the state of the rail network. Although empirically unjusti-fied, safety improvement became the main issue, costs escalated and reliability and productivity experienced a huge fall. The current White Paper “The Future of Rail” is seen as partially misleading and not at all detailed. At present it is only clear that the proposals will result in further increase of political interference. Much will depend on the precise implementation of the proposed measures and therefore the future of British rail remains unclear.
Contents
TU1 IntroductionUT...1
TU2 Methodology/ ApproachUT...1
TU3 Policy reviewUT...2
TU3.1WAS THERE ANYTHING WRONG WITH BRITISH RAIL?UT... 2
TU3.2DEREGULATION AND PRIVATISING PROCESS – THE RAILTRACK ERA (1994-2001)UT... 3
TU3.3THE PROBLEMS OF RAILTRACK AND THE INTRODUCTION OF ITS SUCCESSORSUT... 7
TU4 Review of the current systemUT...10
TU4.1 MAIN PLAYERS IN THE FIELD AND THEIR RELATION TO EACH OTHERUT... 10
TU4.2 MARKET STRUCTUREUT... 18
TU4.3 BEHAVIOUR OF THE MAIN PLAYERSUT... 20
TU5 The change of performance since 1994UT...21
TU6 What’s the current plan for the future?UT...34
TU7 What has worked and problems to be solvedUT...38
TU8 ConclusionUT...44
The Restructuring and Future of the British Rail System
RICO MERKERT
TPF1 FPT
Institute for Transport Studies, University of Leeds Chair for Economic Policy, University of Potsdam
email: [email protected]
1 Introduction
Britain has today the fastest growing passenger rail market in Europe when measured in
pas-senger kilometres and the rail network is very densely used (ATOC, 2004). Nevertheless the
British Government published its White Paper “The Future of Rail” (DfT, 2004) in July this
year, supposing again some fundamental changes in the administration of the railway
indus-try. The question arises whether all the changes since 1994 had any impact on the
perform-ance of the whole system and if there is anything wrong with the current structure of the
in-dustry? Sir Christopher Foster (1994) one of the architects of the initial rail reform, points out
in his recent submission to the White Paper that it is widely acknowledged that Britain’s
rail-ways are in a mess these days (see Foster/Castles, 2004). There has been alrail-ways a highly
con-cerned press and there have been always opponents of the privatisation, in first row Christian
Wolmar (1996, 2001). Economists and key player of the industry became even more critical
after the actions undertaken by the Labour Government since 1997 (see Glaister, 2002 or
Shaw/Walton/Farrington, 2003). The critics did not fall silent and probably will not do in the
future (see Wolmar, 2005). Especially the inability of the Government to set appropriate
in-centives for the industry to deliver value for the money was often critically reviewed (see e.g.
Nash, 2002a). But there are as well articles concluding that the initial privatisation or at least
single measures were appropriate at that time and successful pre Hatfield. The aims of this
paper will be to assess the performance of the rail system over time and to examine whether
there was something fundamentally wrong with the post-privatisation structure or if its main
characteristics could have worked and can work in the future under different circumstances.
2 Methodology/ Approach
First a pragmatic policy review will be given to provide a short overview over all the changes
and their initial aims during the last decade. As the British rail industry was fundamentally
TP
1
PTThis paper was prepared during a Research Fellowship at the Institute for Transport Studies, Leeds University.
transformed in 1994, in 2001 and is going to be transformed again by the end of this year the
focus will be on questions about potential problems with the pre-changed systems. Because
the British rail reform is now relatively well known, the policy review will be rather short and
the attention will lay on the current system, on recent developments as well as on the
pro-posed changes. To assess whether all the structural changes were necessary and in any sense
effective the paper will also draw published statistical material. The objective for using some
empirical data in some kind of descriptive cost benefit analysis is to examine significant
trends in the change of performance of Britain’s railways. The literature and empirical
find-ings are then supplemented by interviews with key people associated with the industry and by
submissions of the various interest parties to the 2004 rail structure review. This paper
inves-tigates some major indicators for the overall performance of the British rail system over time.
It examines the main problems which led the Government to publish the White Paper (DfT,
2004) and takes a critical view on the proposed measures.
3 Policy review
3.1 Was there anything wrong with British Rail?
The British railway system is not only known as the most liberalised railway system in
Europe (see IBM/Kirchner, 2004), but sometimes also as an example that privatisation as a
single step is not enough to ensure a sustainable railway system. It is important to set the right
frame for competition, for appropriate incentives to cost efficient production and for
maintain-ing and renewmaintain-ing a qualitative and quantitative reliable infrastructure.
Following a series of privatisations in Britain carried out by successive Conservative
admini-strations, railways were the last network sector to privatise, and probably the most complex
one. Since nationalisation in 1948, British Rail (BR) the state owned vertical integrated
infra-structure manager experienced four major shifts in the way it was controlled by the state (Joy,
1998, pp. 27). There was the “sectorisation” in 1981 which tried to establish market-facing
business sectors within BR (Charlton, 2000) and before it came to the actual privatisation in
1994 most activities of BR, which did not belong to its core business, were sold off between
1981 and 1993 (e.g. Sealink UK, BR Hotels). The biggest problem of BR and the main reason
for selling off its non-core businesses was the weak profitability of the railways (Welsby and
Nichols, 1999, p. 56). Since the 1950s Britain’s railways have been in a loss-making position
continued to deteriorate. At the same time the railway’s market share both in passenger and in
freight has been in long-term decline. Although Cowie (2002, p. 34) reveals that efficiency of
the railways had improved between 1985 and 1990, the performance of railways was
gener-ally perceived as too little especigener-ally when it came to service quality (DoT, 1992). Before that
background the government aims of the railway privatisation process, as stated in the White
Paper (DoT, 1992) “New Opportunities for the Railways” were: to make better use of the
rail-ways, to ensure greater responsiveness to the customer, to provide higher quality of service
and to provide better value for money. The key to succeed in achieving these aims was seen
(similar to previous privatisations of network industries) in improving reliability, efficiency
and in strengthening the financial position of the industry. The introduction of competition
through greater involvement of the private sector and ending BR’s monopoly in the operation
of services was the proposed instrument for achieving this. The general idea of the
Conserva-tive party was to lead the industry towards more efficient network (the unspoken aim was a
smaller network) and it was seeing competition as the most appropriate tool to improve
effi-ciency: “Introducing competition, innovation and the flexibility of private sector management
will enable the railways to exploit fully all the opportunities open to them.” (DoT, 1992). It is
worth to mention that railways are not only a very complex industry but that the assets
(tracks, rolling stock etc.) which were going to be privatised were in an unknown state. There
was a need for increased renewal activity with the high volumes of track renewed in the 1970s
now becoming due for renewal. Although Ford (2004, p. 15) reveals that only the last decade
has experienced underinvestment most people believe that BR spent too little on maintenance
and renewals for a long time pre privatisation.
3.2 Deregulation and privatising process – the Railtrack era (1994-2001)
Because the British rail reform is now widely known and exhaustively discussed in the
exist-ing literature, this section will provide only a brief description over the steps undertaken by
the British Government. Between 1994 and 1997 the organisational structure of the rail
indus-try was fundamentally rebuilt (Kain, 1998 as well as Harris and Godward, 1997, provide
comprehensive overviews). The principal change was the separation of BR’s infrastructure
from its transport operations. Under the Railways Act (1993) a new government owned
com-pany, Railtrack, took ownership and management of almost all BR’s railway infrastructure in
1994. All other BR activities were split into more than 100 companies and then transferred to
the private sector, mainly by tendering. Railtrack was sold in 1996 to the private sector
infrastruc-ture monopoly. By following the European Directive 91/440, Shaw (2000) argues that this
directive was used to support the government’s plan for vertical separation. In result, the
or-ganisational change undertaken by the Conservative government went far beyond the
direc-tives requirements, and was completed just before the election in 1997 which the
Conserva-tives were expecting to lose (Freeman & Shaw, 2000). By then all railway activities were
pri-vatised. Railtrack staff undertook signalling and control, but did not carry out engineering
tasks. For those tasks, mainly infrastructure renewal and maintenance, the approach was to
subcontract former BR units, which were, after outsourcing and sale, now individual private
companies. To introduce more competition and reduce market entry barriers the other
essen-tial asset, rolling stock, was sold off to three private Rolling Stock Companies (ROSCOs). For
the transport market a franchise model with 25 Train Operating Companies (TOC) was
cho-sen for pascho-senger transport, while the freight operations were sold off to Freight Operating
Companies (FOC). Whilst the franchised passenger market was regulated, there was open
access in the freight market. After a while there was also severely limited open access on a
few passenger transport lines. As part of the reform two regulatory bodies were installed. The
Office of Rail Regulator (ORR) was responsible for economic regulation and mainly focused
on Railtrack as the monopoly player of the industry. The Office of Passenger Rail Franchising
(OPRAF) was primarily responsible for awarding franchises and, through that, paying
subsi-dies as well as regulating the TOCs. Safety regulation was given to the Health and Safety
Ex-ecutive (HSE). As a result, there have been three bodies involved in regulation, in order to
separate the roles of economic and safety regulation from determining subsidy levels and in
theory there was not much overlapping of responsibilities. This regulatory structure was
com-pleted with a complex compensation regime and a fare regulation as well as a track access
charge regime. In general the privatisation and reorganisation of the industry was very
con-troversial and had strong opponents (Winsor, 2004a, p. 12). When Labour came into power in
1997, it announced, changes in policy and administration with a trend of renationalisation of
the industry. In contrast to the Conservatives, the Labour government was putting railways at
its centre of transport policy. In its 10 Year Transport Plan (DETR, 2000) Labour envisaged
50 per cent increase in passenger traffic and 80 per cent increase in freight traffic. Given that
there had already been substantial increases in rail traffic since privatisation, the network was
faced with scarce capacity. The Labour party expected enormous investments, especially from
the private sector to enhance the network, which was ambitious and as Glaister (2002) shows,
little else than the announcement was achieved. To realise this fundamental growth, the
ex-panded to take on a strategic role in the industry and in 2001 it was re-named to Strategic Rail
Authority (SRA). The purpose of the SRA was according to the White Paper of the
Govern-ment in 1998, to provide “a clear, coherent and strategic programme for the developGovern-ment of
our railways” (DETR, 2000). Following the new plans of the Labour government (using still
with the same legislation) the SRA will be abolished by the end of 2004. Therefore one could
argue that either the abolishment or the set up of this agency was a mistake on itself. Although
there have been substantial cost savings and performance improvements (Pollitt and Smith,
2002) there has been much criticism regarding many aspects of the rail reform. Most failures
are widely known today. Therefore only some of the main failures from the early
post-privatisation period will be captured in this section.
One source of problems during the early post-privatisation period was the overachievement of
one of the aims of the rail reform. Growth on passenger as well as on freight markets was
much more than anticipated. Privatisation was expected to result in some, generally modest,
traffic growth through filling trains, especially off peak. Instead the growth on some lines was
by far too much for the existing capacity, especially on the routes into London. At the same
time the industry was faced with problems related to service quality, investment, safety (at
least perceived as problem) and profitability (Nash, 2002a). Most of the problems were
caused by the rushed implementation and combination of the initial franchise system, the
regulatory regime and the incentive structure (e.g. performance regime). Foster (2005) argues
that for political reasons too much was attempted too quickly (only five years until the next
election), but this is a standard problem in regulatory economics and not specific for the
Brit-ish market. In the first franchise round the TOCs with the highest revenue forecasts or lowest
cost succeeded. Some TOCs had therefore ambitious revenue targets and others were building
their franchise bids around big reductions in operating cost, and a reduction of the subsidy
was included in the contract. The TOCs had in both cases a strong interest to increase their
revenue. Because almost 50 per cent of the fares were regulated (RPI price caped) and
be-cause the marginal cost of train operation were low, due to the 91% fixed part of the track
access charges (Crompton and Jupe, 2003, p. 405), the TOCs were trying to increase the
traf-fic on the network, which was already on its capacity limit on certain lines. On the other hand
Railtrack had no incentives to enable the TOCs to operate more trains on its network. One
reason for that was the structure of the track access charges, another was the complex penalty
regime which was part of the track access agreements. Railtrack was forced to compensate the
in-crease of probability that Railtrack could not provide that certain level. Because TOCs had to
pay Railtrack as well if they were the cause of delays, they were not waiting anymore for
other TOCs who were running late and in result the delays multiplied. At the end most TOCs
were not able to increase revenues and tried therefore to save money in service, staff cost
(in-cluding training). Many of the TOCs went into financial trouble. Instead of allowing some of
them to go bankrupt the SRA moved to the “cost plus” franchises contracts, and therefore the
subsidies to the industry increased. These “cost plus” contracts were always seen as a
tempo-rary measure, but changing franchising policy and the post-Hatfield crisis delayed things.
With its Periodic Review the ORR (2000) made a major change of the incentive structure to
realign the interests of Railtrack with the TOCs. To incentivise Railtrack to facilitate growth
on the network, the proportion of variable charges (including a new capacity charge) was
in-creased to 20%. Other problems occurred as a result of too much fragmentation both in
ad-ministration (overlapping responsibilities) and in the private sector. Concerning rolling stock,
Preston (1999) points out that there was a virtual freeze in rolling stock investment in the
early years post privatisation. Current figures reveal that recovery is underway and that there
is substantial investment at present (SRA, 2004a, p. 51). NAO (1998) argues that the rolling
stock was initially sold for £1.7bn by the Government, and subsequently sold on for around
£2.7bn, which could be seen as a substantial loss for the taxpayer.
To sum up, although there were some sceptics especially regarding vertical separation (see
e.g. Preston, 1996) and privatisation (Wolmar, 2001) it is now acknowledged that the early
post- privatisation experience was better than perceived by many people (see e.g. Pollitt and
Smith, 2002). Preston (1999) draws 20 lessons from the British rail reform, the majority being
positive. He highlights the positive effects of the (although limited) on-the-track competition,
like product differentiation, increased service frequency and selective fare cuts. Van de Velde
et al., (1998) point out that there have been important entrepreneurial initiatives since
privati-sation, with the most important concern in ticketing and distribution. Nash (2002b) concludes
that the industry structure adopted at privatisation was the best way of introducing
competi-tion to the railways. The new structure clearly increased complexity and created some
prob-lems. However they have occurred, mainly due to the rushed implementation and were mostly
related to contractual design. Additionally these problems have to be weighted against the
benefits of competition. In total the increased performance, the growth in traffic and the
3.3 The problems of Railtrack and the introduction of its successors
Because many of the difficulties of the British railways were related to the infrastructure
manager, this section will provide a brief introduction to the weaknesses of Railtrack and its
successors. Since its flotation in 1996 Railtrack was a private company on the stock market,
knowing neither its assets (there hasn’t been any asset register) nor its cost drivers, nor having
a management experienced in railways, because most of the top managers were appointed by
the Government from outside the industry. Instead of realising that there had been
underin-vestment in the asset base (mainly due to the inunderin-vestment cycle), and instead of concentrating
on its day to day business, the management was focused on serving the shareholders, after the
unexpected growth in traffic and in line with a satisfactory development of the share price in
the early years. Although Railtrack welcomed the unanticipated growth at the beginning, it
was weak incentivised to enhance the network and to ensure appropriate capacity.
As mentioned in section 3.2, Railtrack sub-contracted all its maintenance and renewal
activi-ties and the maintenance and renewal companies sub-contracted many tasks as well. By
out-sourcing these former BR units, there were at some point more than 2000 subcontractors, the
infrastructure manager lost skilled engineering staff and valuable information about the
condi-tion of the infrastructure (Grayling, 2001, p. 23). The split between the Infrastructure
Mainte-nance and the Track Renewal Companies was perceived as particularly inefficient and as an
example of too much fragmentation in the private sector (Wolmar, 2001, p. 92). In Lord
Cul-len’s report on railway safety (Cullen, 2001) the poor management of the maintenance and
renewal contracts by Railtrack is highlighted too and it is concluded that better co-ordination,
clearer lines of accountability and fewer subcontractors are desirable, but vertical integration
is not a necessary prerequisite. Foster (2005) highlights that BR had already reduced
mainte-nance substantially in 1992 and kept it that way for two years. This was the result of massive
pressure from the Treasury and he argues that this could have been a cause for the Hatfield
crash. Already, the accident at Ladbroke Grove had changed the mindset of ministers, who
were under pressure from the opposition to resign and finally the Hatfield accident changed
the whole story of the British rail reform. Whilst Hatfield was demonstrating some
inadequa-cies of the system, the Labour government used the media attention to support their position
against the privatisation done by the former Conservative government and made safety
politi-cal issue without considering any cost or the reliability of the railways. Even more damaging
that similar things were said post Clapham in 1989, and that BR handled the situation a lot
better, but after the Hatfield crash it was not enough, as it had been before, that the railways
deplored what happened and promised a careful investigation. Instead Railtrack board
mem-bers were vilified, their home address displayed and the whole rail system became risk averse,
encouraged by the perception at all levels that managers would be sued or even criminally
prosecuted. Given that background, one could possibly understand the actions of Railtrack
managers after the Hatfield derailment, even if they seem insufficiently considered. Trying to
avoid every risk, with poor understanding of the condition of the network but knowing that
the cause for the accident was a broken rail, every metre of the network was inspected for
gauge-corner cracking. One could argue that the management lost its confidence after Hatfield
completely (safety was actually increasing since privatisation), which led to a multitude of
re-railing initiatives and temporary speed restrictions "just in case" anything was wrong (Foster
2005). By doing so, Railtrack restricted the ability of the TOCs to run their advertised
timeta-bles and freight, as well as passenger travel, collapsed (passenger number fell by up to 40%
within the early days, CFIT, 2001). In result, Railtrack was obliged to pay more than £500m
in compensation to train operators (Kennedy and Smith, 2004, p. 158). Because the
derail-ment heightened concerns over the condition of Britain’s rail infrastructure maintenance and
renewal activity was also intensified, which resulted in Railtrack facing an even sharper
in-crease in cost. At the same time, the cost of high profile intensification projects as the upgrade
of the West Coast Line went out of control and escalated from an initial estimate of £2.3bn in
1996 to £5.8bn in 2000 (ORR, 2000). All these costs undermined Railtrack’s finances,
devas-tated its share price and compromised its capacity to raise capital. Hence Railtrack was forced
to request direct financial support from the government, and as the offered funding (£1.5bn
under various conditions) was thought to be not enough, the government withdrew support for
Railtrack and placed it in administration in October 2001 (Shaw et al., 2003, p. 148). It is
worth mentioning that Railtrack could have been rescued through a TAC-review by the ORR,
but neither the government nor Railtrack did ask for it until the last minute (Winsor, 2004a).
The administrators of Railtrack plc – the accountancy firm Ernst & Young - planed to run the
company as normally as possible while it was under their control. During that time there was
a political driven demand for massive safety improvements on the network and, because there
were not enough companies to cover all the demand, the subcontractors could increase the
price. In result, the maintenance and renewal cost increased dramatically during the time of
this company now owns and manages the infrastructure. This not-for-dividend company is
limited by guarantee and its members are rather stakeholders than shareholders. Network Rail
has a profit motive but it reinvests any profit, instead of paying a dividend to its members.
The decision to place Railtrack into administration, and replace it with a not-for-dividend
company, may have weakened incentives for cost control at a critical time for the industry.
The British infrastructure manager has seen three different ownership models within less than
ten years and many difficulties of the British rail reform were related to the infrastructure.
Key findings of a Mercer Management Consulting and DTLR (2002) study which are mainly
based on more than 50 interviews with key persons of the industry and related professionals,
reveal four major problems, all related to the infrastructure manager and a general lack of
consideration of value for money. They point out the failure to implement correctly
mainte-nance and renewal of the network, stemming from a loss of knowledge and expertise,
com-pounded by historic under-investment. Furthermore they highlight the poor investment
plan-ning and strategies, the inefficient capacity utilisation on a congested network and the onerous
and bureaucratic safety concern without a balance of benefits and costs of safety regulation.
To get cost and the maintenance difficulties under control NR recently has been taking
main-tenance back into house. To achieve further efficiency improvements NR recently has been
changing its organisation structure. Since 1996 Railtrack was based around seven
geographi-cal zones and this structure remained under NR. Since the 24P
th
P May 2004 NR has what they
call a functional structure (interview Marlee). On top of the people in charge of operations or
maintenance in their 18 areas, there are now people who are in charge for 8 major routes and
5 asset management territories. For the 8 routes a central department of operations and
cos-tumer services has the responsibility and the asset management territories report to a central
maintenance unit. Internally, NR also changed its bonus regime. Under Railtrack, the bonus
regime was based on individual performance, now it cascaded down to NR’s performance,
which is supposed to motivate individuals more around the core company objectives.
To sum up, it was shown that there have been difficulties with the rail infrastructure. However
most of them were caused by management failures and weak incentive structures, but not
much related to the fundamental structure. Many things have been changed in relatively little
time, and it is even today difficult to fully understand such a complex system as the British
railways. Hence the next section will provide a detailed overview of the current organisation
4 Review of the current system
4.1 main players in the field and their relation to each other
As Accenture (2003) has done it for Network Rail, it might be worth examining the supply
chain of the whole British rail industry. On top there are public bodies setting the framework
for the private industry to deliver what customers and the government are demanding. As
[image:14.595.89.519.278.763.2]il-lustrated in Figure 1 there are basically six key parts to the structure of public bodies.
Figure 1:
Financial flows and relations within the British Rail Industry in 2004
Network Rail
(116 public & industry members incl. SRA) Infrastructure Maintenance back in house
Rail Safety Regulator (HMRI)
Office of Rail Regulator (ORR)
4 Freight Operators (FOCs) & Other Operators
(e.g. Eurostar, Heathrow Express)
23 Passenger Train Operating Companies (TOCs)
e.g. GNER, ScotRail
Strategic Rail Authority (SRA)
3 Rolling Stock Companies (ROSCOs) Heavy Maintenance Suppliers e.g. Bombardier, Siemens Other Service Providers Track Renewal Companies
e.g. Raleyfast, Jarvis
Customer
Passenger Transport Executives (PTEs )
Contractual relationship
Department for Transport (DFT )
public private
Office of Fair Trading (OFT )
The Department for Transport (DfT) is on top of the whole system and is responsible for
the overall policy for the railways, setting it within a wider transport context. It issues
fur-thermore direction and guidance to the Strategic Rail Authority (SRA) and gives general
guidance to the Office of Rail Regulation (ORR). The SRA and the ORR have common
statu-tory purposes and different powers by which those purposes are to be achieved. The SRA
(which will be abolished by next year and the DfT will take over its responsibilities) depends
on directions and guidance from the Government. It provides the overall strategic direction
for the railway’s, lets and manages passenger franchises as well as freight grants and is
re-sponsible for the development, sponsoring and monitoring of major infrastructure projects. It
promotes the use of the railway network, as it secures and contributes to its development and
has general responsibility for consumer protection matters. Furthermore the SRA publishes an
annual ‘Strategic Plan’, that the DfT probably will not publish in future, which could mean a
loss in transparency within the rail system (see interview Glaister). The ORR focuses more on
the monopoly and dominant elements of the railway industry. Its main function is to regulate
Network Rail's stewardship of the national rail network, including reviewing and setting its
access charges. The ORR also licenses operators of railway assets, approves agreements for
access by operators to tracks, stations, and light maintenance depots, and enforces domestic
competition laws. The model of regulatory regime which the Conservatives devised was one
of an individual regulator, appointed by the Government but through its five year contract,
independent of the Government. Tom Winsor (2004a) who was the regulator for the last five
years describes mainly two functions for a rail regulator: first to protect users of networks
from abuse of monopoly power by their owners and operators and second to protect the
pri-vate sector (for example from unjustified political interference) to ensure a stable, predictable
and fair financial and operating environment for the enterprises in question. Following his
experiences regarding his attempt to rescue Railtrack using his right to reassess the financial
needs of the infrastructure provider and what would have enabled Railtrack to charge more
from its customers and therefore to strength its financial position and to prevent the
bank-ruptcy. The regulator has this right under the Railways Act (1993) usually every five years or
in specific circumstances like it was the case with Railtrack in 2001. On the other hand
Rail-track has to ask for such a review and it did not until the last minute. It seems to be
question-able whether this was a deal between the senior manager of Network Rail and the DfT behind
Tom Winsor’s back and whether the regulator had real power to use his certain degree of
in-dependence for doing what’s best for the railway industry. It seems to be the case that the
Gov-ernment to take Railtrack back into administration. On the 5P
th
P of July 2004, just after the term
of Tom Winsor ended, the Government changed the model of the regulatory regime and
ap-pointed a new nine member regulatory board. Like in all other British regulated sectors it is
no longer a single-person regulator but a board with a separate chairman, chief executive,
executive and non-executive directors. Time will show whether this new board will have the
same degree of independence and power as the former single regulator had.
The Health & Safety Executive and more precisely its department for railway sector issues
Her Majesty's Railway Inspectorate (HMRI, now transferring to ORR) is the regulatory
authority for health and safety on the railways. It is mainly responsible for protecting the
health and safety of workers and the public in respect to risks arising from railway operations,
but also ensures that the risks are properly controlled. The SRA, ORR and HMRI are
sup-posed to work together to tackle the problems facing the rail industry. This structure and the
behaviour of these three public bodies in interaction with each other have been however the
source of much controversy especially about overlapping responsibilities.
The Office of Fair Trading (OFT) delegated most of its rail responsibilities to the ORR but
is generally in charge for all regulation matters and enforcement of competition acts in the
UK, including railways. It works jointly with the Competition Commission (CC).
The local authorities in metropolitan areas outside London (‘Transport for London’ has got a
unique status) are organised as Passenger Transport Executives (PTEs) and are funded by a
combination of local council taxes and grants from the Government. The provision of regional
services on a metropolitan-wide basis existed as well pre-privatisation. The objectives of this
regionalisation are to give local authorities responsibility and to place them in competition
with each other for the allocation of public resource from central government (see Docherty,
2000). The seven PTEs of England and Scotland which serve between them more than 13
million people in Greater Manchester (GMPTE), Merseyside (Merseytravel), West Midland
(Centro), South Yorkshire (SYPTE), West Yorkshire (Metro), Strathclyde (SPT), Tyne and
Wear (Nexus) have the power to secure passenger rail services in their areas and can make
their own local franchise contracts with TOCs to provide these additional services. The PTEs
are mainly responsible for implementing the Passenger Transport Authority’s (PTA) policies
and administrating the funding for public transport. Merseytravel is most independent from
Besides the government the main demanding party and source of revenue are the customers.
The customers are part of the public. Every customer will judge the perceived overall
per-formance of the rail services and will compare it with the fares. The perception of the railway
will assumingly influence their voting behaviour, because the government is still responsible
for funding and setting the transport policy. But customers pay not only fares, they pay taxes
as well, which are partially used for (local) railway services. Therefore the users demand to
play a certain role in the system as well as protection of their rights. The Rail Passenger
Council (RPC) co-ordinates the workof eight regional Rail Passenger Committees (now to
be abolished). All nine bodies are funded by the SRA andtry to protect and promote the
inter-ests of rail passenger mainly in respect to the TOCs.
On the supply side there can be three levels of value added elicited. The supply chain can be
roughly distinguished into transport provider, asset provider and service provider. The first
level, the level of transport provider, consist of 23 franchised train operating companies, 4
freight operating companies and other operators. The passenger transport market is
organ-ised by a strict franchise model for most of the network. The SRA awards franchises on the
basis of competitive tenders, however beside these core services there is room for open access
operators, for example Heathrow Express or Hull trains who run services without a franchise
agreement. (all operators without a number in the TAC-column in Table 1). For the freight
market there is open access since 1994. The customers of the FOCs include Network Rail and
the track renewal companies, due to the providing of haulage for them.
There are several relations between the administration and the transport provider. This paper
will focus on the contractual relations which imply financial transactions. The TOCs receive,
at first, money from the PTEs and from the central government (SRA grants=subsidies) to
provide certain services at agreed levels of performance. However some TOCs, for example
Great North Eastern Railway Ltd, who operate in profitable areas don’t receive any subsidies
through their franchise agreements but have to pay a premium to SRA for the allowance to
run business in the areas in question. The level of subsidies/premiums is determined through
competitive bids (competition for the market) to win franchises with significant protection
from on-rail competition. The TOCs are regulated through the provisions specified in the
rele-vant franchise agreement and detailed in depth in the franchise plans. Hence the level of
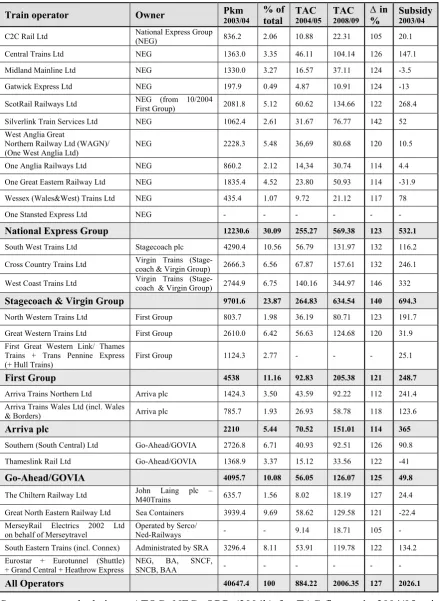
Table 1
TOCs and their current Pkm (in mio.), TAC & subsidies on main network (£ in mio.)
Train operator Owner Pkm
2003/04 % of total TAC 2004/05 TAC 2008/09 ∆ in %
Subsidy
2003/04
C2C Rail Ltd National Express Group
(NEG) 836.2 2.06 10.88 22.31 105 20.1
Central Trains Ltd NEG 1363.0 3.35 46.11 104.14 126 147.1
Midland Mainline Ltd NEG 1330.0 3.27 16.57 37.11 124 -3.5
Gatwick Express Ltd NEG 197.9 0.49 4.87 10.91 124 -13
ScotRail Railways Ltd NEG (from 10/2004
First Group) 2081.8 5.12 60.62 134.66 122 268.4
Silverlink Train Services Ltd NEG 1062.4 2.61 31.67 76.77 142 52
West Anglia Great
Northern Railway Ltd (WAGN)/ (One West Anglia Ltd)
NEG 2228.3 5.48 36,69 80.68 120 10.5
One Anglia Railways Ltd NEG 860.2 2.12 14,34 30.74 114 4.4
One Great Eastern Railway Ltd NEG 1835.4 4.52 23.80 50.93 114 -31.9
Wessex (Wales&West) Trains Ltd NEG 435.4 1.07 9.72 21.12 117 78
One Stansted Express Ltd NEG - - -
National Express Group 12230.6 30.09 255.27 569.38 123 532.1
South West Trains Ltd Stagecoach plc 4290.4 10.56 56.79 131.97 132 116.2
Cross Country Trains Ltd Virgin Trains
(Stage-coach & Virgin Group) 2666.3 6.56 67.87 157.61 132 246.1
West Coast Trains Ltd Virgin Trains
(Stage-coach & Virgin Group) 2744.9 6.75 140.16 344.97 146 332
Stagecoach & Virgin Group 9701.6 23.87 264.83 634.54 140 694.3
North Western Trains Ltd First Group 803.7 1.98 36.19 80.71 123 191.7
Great Western Trains Ltd First Group 2610.0 6.42 56.63 124.68 120 31.9
First Great Western Link/ Thames Trains + Trans Pennine Express (+ Hull Trains)
First Group 1124.3 2.77 - - - 25.1
First Group 4538 11.16 92.83 205.38 121 248.7
Arriva Trains Northern Ltd Arriva plc 1424.3 3.50 43.59 92.22 112 241.4
Arriva Trains Wales Ltd (incl. Wales
& Borders) Arriva plc 785.7 1.93 26.93 58.78 118 123.6
Arriva plc 2210 5.44 70.52 151.01 114 365
Southern (South Central) Ltd Go-Ahead/GOVIA 2726.8 6.71 40.93 92.51 126 90.8
Thameslink Rail Ltd Go-Ahead/GOVIA 1368.9 3.37 15.12 33.56 122 -41
Go-Ahead/GOVIA 4095.7 10.08 56.05 126.07 125 49.8
The Chiltern Railway Ltd John Laing plc –
M40Trains 635.7 1.56 8.02 18.19 127 24.4
Great North Eastern Railway Ltd Sea Containers 3939.4 9.69 58.62 129.58 121 -22.4
MerseyRail Electrics 2002 Ltd on behalf of Merseytravel
Operated by Serco/
Ned-Railways - - 9.14 18.71 105 -
South Eastern Trains (incl. Connex) Administrated by SRA 3296.4 8.11 53.91 119.78 122 134.2
Eurostar + Eurotunnel (Shuttle) + Grand Central + Heathrow Express
NEG, BA, SNCF,
SNCB, BAA - - -
All Operators 40647.4 100 884.22 2006.35 127 2026.1
Source: own calculations; ATOC; NEG; ORR (2004b) for TAC-figures in 2004/05 prices;
In general are all the contracts illustrated in Figure 1 performance based contracts. Therefore
every arrow in Figure 1, with the exception of the two arrows within the administration,
should be a back arrow. A crucial part of that contract is that if one contract partner (e.g. one
TOC), fails to deliver the pre-agreed minimum service the other partner (e.g. SRA) will get a
certain amount of compensation.
The TOCs have as well contracts with the customers, which are the main source of revenue
for them. If a customer is buying a ticket, he is agreeing to a contract which ensures him a
certain service and protects him if the TOC fails to deliver. In Britain the fares, the price the
user has to pay for the services, depend widely on the time of purchasing the ticket (how
much time in advance), the distribution channel (e.g. internet), the quality of the services (e.g.
first class). There is as well a large variety in fare types for different market segments, like
long distance versus regional journeys. A certain amount of tickets, at present all Saver fares,
standard class weekly season tickets and most commuter fares in and around London, are
regulated by the SRA and since January 2004 only increases of 1 per cent more than the
Re-tail Price Index (RPI+1%) are permitted on those national railway fares (from 1996 to 1999 it
was RPI and from 1999-2004 it was RPI-1%, see SRA 2003). Due to this price cap regulation
the possibilities for TOCs to increase their revenues are limited to getting more passengers on
their trains or better market segmentation.
The second level of the supply chain includes two asset providing players, the infrastructure
provider Network Rail and the three rolling stock companies. The last provide the train
op-erators with rolling stock and receive through a performance based contract pre-agreed lease
and maintenance charges. Network Rail owns and operates the national rail network (16553
track km open for traffic), about 2500 stations as well as interchange facilities. Network Rail
is the only player in the supply chain which is not entirely private. This not-for-dividend
com-pany is limited by guarantee and his 116 members are rather stakeholders than shareholders.
There are just 12 TOCs plus 3 FOCs among the industry members and there is the SRA
among the public members. However most of the members are just ordinary people. The
members have clearly defined and limited powers, but the board in which the SRA has a seat
as well is directly accountable to the members. NR finances itself partially through the form
of grants issued by the SRA and the other part through the track access charges (TAC) paid by
the TOCs and FOCs for the use of network. In March 2004 the company got the approval of
deter-mines the level of TAC and the amount of government funding as well) over the next five
years for operation, maintenance and renewal of the core national network (Winsor, 2004a).
This is an increase of approximately £7bn over the regulators October 2000 settlement for
Railtrack. These proposals do not change the December 2003 determination (ORR, 2003a)
that NR's net revenue requirement between 2004 and 2009 is £21.45bn. NR will receive this
money through three different ways. Most of the money will come through grants direct from
the SRA or in the future from DfT (£9.35bn). The rest will come to a largely from track
ac-cess charges from train operators (£8.96bn) and the rest from additional borrowing (£3.14bn).
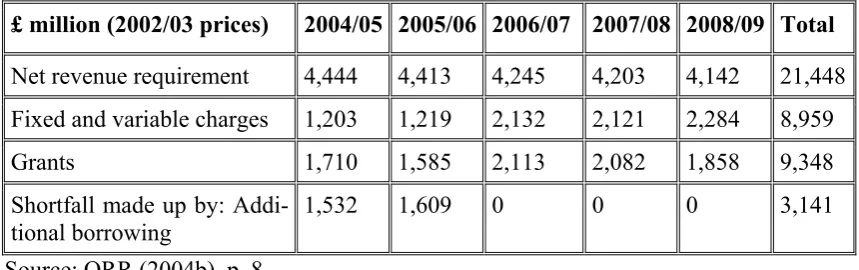
Table 2 shows the proposed year-by-year split of the net revenue requirement established by
[image:20.595.97.527.331.466.2]the ORR’s 2003 final conclusions.
Table 2
Composition of net revenue requirement under Network Rail's proposal
£ million (2002/03 prices) 2004/05 2005/06 2006/07 2007/08 2008/09 Total
Net revenue requirement 4,444 4,413 4,245 4,203 4,142 21,448
Fixed and variable charges 1,203 1,219 2,132 2,121 2,284 8,959
Grants 1,710 1,585 2,113 2,082 1,858 9,348
Shortfall made up by: Addi-tional borrowing
1,532 1,609 0 0 0 3,141
Source: ORR (2004b), p. 8.
Table 2 reveals that 42% of Network Rail’s income will come from track access charges. The
TAC paid by franchised TOCs can be divided into a variable track usage charge, a variable
traction electricity charge, a variable capacity charge and a fixed charge (Nash et al., 2003, p.
4). Whilst the variable charges are designed to incentivise and to reflect marginal cost, the
fixed part is insulated through the franchise agreements. The level of franchised passenger
operators track access charges is determined by the rail regulator and the last determination
was the access charge review in 2003 (see ORR, 2003a). The new TAC will be allocated by
the cost of enhancement and upgrading, and therefore every franchisee will experience
differ-ent changes of its TAC. The cap of permitted increases is regulated by the regulator as RPI-X,
whereby X is a factor for performance improvement (e.g. the efficiency target set by the ORR
for NR for the next five years is 41%) As Table 1 illustrates the TAC for franchised TOCs
will increase through four steps within the next five years and will be already doubled in
2006/07 compared to 2004/05. Because the proposed increase of TAC only affects the fixed
part of the TAC, and as this part is insulated, the rise will be matched by growing subsidies
The structure of TAC for open access passenger and freight operators is roughly the same as
for TOCs with the difference that open access passenger and FOCs only pay the variable of
the TAC. Therefore the proposed increase of TACs will not affect those operators in short
term. In long term all operators will have to renegotiate their contracts either with SRA/DfT
or with Network Rail and will be affected by higher TACs either way. As well as track access
charges the train operators have to pay for the use of stations and light maintenance depots.
Because of wrong incentives for the TOCs in the 2000 Periodic Review, the ORR increased
the variable part of the TAC to 20 per cent. The supposed substantial increases of the TAC
published in the 2003 Review by the ORR will only affect the fixed part of the TAC.
There-fore the variable part will be by definition, again, much less than 20 per cent.
All passenger train operators have a clause in their track access agreement which compensates
them when NR takes possession of the rail network to carry out engineering work. This is
unique in Europe and of great value to the TOCs (see interview Bastow). In every track access
agreement there is, as well, a performance regime included, which provides financial
incen-tives for both the train operators and NR. This performance regime draws on the recorded
causes of delay and cancellations distinguished into infrastructure or operation failure.
The third level on the supply chain consists of heavy maintenance suppliers (rolling stock),
track renewal & infrastructure maintenance companies and other service companies. All
of them provide services for the ROSCOs and for Network Rail. The heavy maintenance
sup-pliers provide in some cases direct services to train operators too. Until the beginning of 2004
there have been privately owned infrastructure maintenance companies, but those are now
back in house of Network Rail.
To sum up, the current British rail system seems to be a coherent one, with many interactions
and many bodies in the administration. It is furthermore very transparent compared to most
European rail markets (e.g. interview Bastow). The Government sets the framework for a
pri-vate rail sector and seems to have, not only through the main player in the industry Network
Rail, a lot of power and tools to control the railways. The regulation of fares is done by SRA
and all other regulation issues are the responsibility of the ORR. The performance system and
the contracts within the supply chain are sensible to provide incentives for delivering
appro-priate services. The main characteristics of the British rail market are private ownership,
franchis-ing for passenger operators (competition for the market), open access for freight and a few
passenger operators (competition in the market), incentive-compatible charges as well as
per-formance penalties and bonuses and an independent regulator. These characteristics are
con-sistent since 1994 and will not be affected by the White Paper.
4.2 Market structure
The British national rail network and about 2500 stations, as well as interchange facilities, are
owned and managed by Network Rail. The British Government decided to have a regulated
monopoly for the infrastructure. With maintenance back in house and due to the proposed
changes in the White Paper (2004), Network Rail will become the major player within the
British rail sector and will set most of the strategic and operational agenda (e.g. long term
investment planning, day-to-day-operation, timetabling).
For the train operating companies in the passenger rail market the Government has chosen a
franchise model for most of the national rail network. The SRA awards franchises on the basis
of competitive tenders and under their current franchising policy the term of a franchise
con-tract will be between five to eight years. After British Rail was privatised in 1994, 11
compa-nies owned the 25 franchises. The National Express Group was the most successful franchise
bidder and was awarded five franchises. Since then, National Express Group has acquired
Prism Rail, which was awarded four franchises, making it the largest train operator in the UK
with more than 30 per cent market share (see Table 1). Because First Group has won the
Sco-trail franchise and started operations in October 2004, National Express Group is losing about
5 per cent market share, but is still the biggest player. Stagecoach, working jointly with Virgin
Group, is the second major player with almost 25 per cent market share in the rail passenger
market. The three other companies who control more than one franchise are First Group,
Ar-riva plc and Go-Ahead/GOVIA. The Great North Eastern Railway Ltd. is the biggest
stand-alone TOC and the South East Trains Ltd. is administrated directly by the SRA. Today the 23
franchises are controlled by 9 companies (see Table 1). Therefore it seems to be reasonable to
conclude that much of the rail passenger market is controlled by a few companies. Because it
is planned to reduce the number of franchises from 23 to 15 (see interview Shaw) it can be
assumed that the ongoing consolidation process will continue. There will be less competition
The open access passenger operators, the three biggest are Hull trains, Eurostar and Heathrow
Express, play a minor role in British rail market and have only a little market share. There is
nevertheless a strong inter-modal competition. Most of the big railway companies for example
National Express Group and Stagecoach control as well big parts of the complete deregulated
bus market. There is strong competition between the bus and the rail market and some
com-panies try to make use of a multimodal approach to control all the modes of transport. One
example for that is the attempt of First Group to acquire the Scottish Rail Franchise (SRF) in
2003. First Group operates buses and rail services in the UK and is the largest bus operator in
Scotland. In March 2003 First Group was short-listed to bid for the SRF and in January 2004
the Office of Fair Trading referred that case to the Competition Commission. In April of this
year the Competition Commission (2004) published its provisional findings which confirmed
the OFT’s concerns that the proposed acquisition may be expected in a substantial lessening
of competition in the relevant markets. As First Group won this franchise and started to
oper-ate on the 17th October 2004, it might be interesting to see whether they are forced by the
Competition Commission to sell bus businesses like National Express was, when it started to
operate SRF in 1997. In result, it can be concluded that there are sufficient bodies to prevent a
change towards an anti-competitive market structure in both rail and bus passenger transport.
Although there is open access to freight since privatisation there are just four major freight
operating companies within the British rail freight sector today. In February 1996, British
Rail’s bulk freight operations were sold to North and South Railways – now called English,
Welsh and Scottish Railway (EWS) who is the main player in the field. The other three major
freight operating companies are Freightliner Ltd (formerly the BR container business), Direct
Rail Services (mainly operating nuclear waste trains) and GB Railfreight (owned by First
Group). There are some smaller companies like Advenza Freight, but due to their insignificant
market share they play a small role in the freight rail market.
Other issues of the market structure are often related to discrimination as seen in many
Euro-pean countries and as particularly experienced by Arriva International (interview Bastow). In
a particular kind of market structure for example it may be difficult for companies who want
to enter the rail transport market to get access to rolling stock, to stations and to interchange
facilities, to depot and maintenance facilities, access to subsidies and, also important, to
ap-propriate trained employees. These issues are mainly solved through the structure of the
contract includes even maintenance) and by not leaving any essential facilities in control of a
single TOC or FOC (Preston, 1999). However, as Nash and Toner point out (see interviews),
there might be a lack of competition between the three ROSCOs. In total, the structure of the
British rail system is fairly transparent and designed to introduce as much competition as
pos-sible on every chain of supply. Nevertheless there are still some market entry/exit barriers e.g.
getting a safety case (might be cost and time intensive), and within the franchised passenger
market it is very difficult for small companies to enter the market and will become even more
difficult by the proposed reduction in number of franchises and the increasing of their size.
4.3 Behaviour of the main players
There is no reason to believe that there is any discrimination of the infrastructure manager
against his customers regarding access to the network. Due to the separation of infrastructure
from operations, Network Rail or Railtrack have no benefit in discriminating TOCs or FOCs
on the network. Nevertheless it can be assumed that the bigger train or freight operating
com-panies use their market and financial power to influence decisions made by the infrastructure
company. In fact the ORR has not made any infringement decisions at the present time. It has
made three non-infringement decisions, though. These are decisions which, following a
for-mal investigation under its competition law powers, the ORR has decided that the conduct
complained about does not infringe the Competition Act 1998. One of these decisions was
regarding to the alleged abuse of a dominant position by Network Rail against his
Subcontrac-tor Welding Federation in June 2004 (ORR, 2004c). There is no evidence that there was any
discriminating behaviour of Network Rail against a single operator. The other two
non-infringement decisions made by ORR were related to behaviour among the TOCs and FOCs
where there have been complaints that bigger companies tried to use their power. First, in
November 2003 the ORR (2003b) made a decision, in relation to complaints against English
Welsh and Scottish Railway (EWS) received by the ORR in April 2003 and June 2003, that
EWS had not infringed the prohibition contained in Chapter II of the Competition Act 1998
by engaging in predatory pricing or selective discounting. In the second case the ORR
re-ceived 32 complaints from passengers and their representatives alleging abusive behaviour by
Virgin West Coast (providing services on the West Coast Main Line) concerning changes to
the level and conditions applying to certain fares for services on various routes, including
those between London to Manchester and London to Liverpool. In the end, the ORR (2001)
concluded that there were no reasonable grounds for suspecting Virgin of having infringed the
suspi-cious anti-competitive known case quoted in literature (see e.g. Preston, 1999) happened in
1997. That year Virgin and Railtrack negotiated a package with respect to the Passenger
Up-grade II of the West Coast Main Line. This package included a revenue sharing arrangement
between the train operator and Railtrack as well as additional protection from competition to
protect remuneration on the investment. They submitted this package for regulatory approval
and although there had been concerns that this investment incentive scheme was potentially
anti-competitive, they got the approval (see ORR, 1998, p. 25).
The behaviour of every single party is controlled by the ORR, so that there is only little space
for anti-competitive behaviour within the British rail market. Furthermore there is only little
evidence that there have been significant problems with discrimination since privatisation.
Toner (see interview) points out that there has been some kind of cartel operating among the
four biggest maintenance companies, at the time when the CTRL project was eating up
capac-ity. As a result the costs of that project were ten times bigger than expected. Most of the
con-tractual relationships between all players within the rail sector have some kind of
compensa-tion scheme. There have been some doubts about the behaviour incentives set by those
com-pensation schemes, but at the end of the day most of key players in the industry believe the
compensation regime is complex, but useful and necessary as it is set up today. Moreover, it
is widely acknowledged that the British rail market is the most transparent one in Europe. It
can be summarised that anti-competitive behavior is not a big issue in the British rail market.
5 The change of performance since 1994
If the White Paper (2004) is pointing out so many problems within the current rail system,
there has to be some evidence in the main performance indicators. To examine the
perform-ance change since 1994 one could use parametric measurement techniques or other
economet-ric tools to examine gains in allocative or technical efficiency and productivity. The most
re-cent papers for Britain using those kind of techniques are Affuso, Angeriz and Pollitt (2002),
Cowie (2002), Pollitt and Smith (2002), Kennedy and Smith (2004) and Rivera C. (2004).
Within this paper the aim is to show some trends without putting everything in a complicated
model with a lot of assumptions underlying it. The focus will be on important, and widely
used input and output factors (for the key indicators see Table 3) giving in result a
on recent data, will show whether there were considerable achievements in improving the
[image:26.595.81.547.161.298.2]overall performance of the railways.
Table 3
Used data set/ key indicators for cost benefit trend
Output Input
• Passenger train kilometres
• Freight net tonne kilometres
• Percentage of trains arriving on time
• Number of train incidents per train-km
• Number of broken rails
• Price level/fares
• Government support to the rail industry
• Investment in the rail industry
• Cost (operating cost, capital expenditure)
• Number of employees
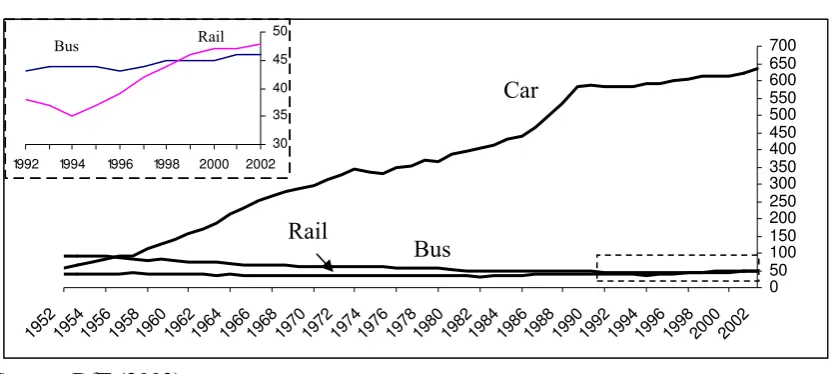
When measured in passenger kilometres, the standard and accepted industry growth
meas-ure, Britain has the fastest growing railway in Europe. As illustrated in Figure 2 the car has
been the dominant mode of transport since the late 1950s and has today an overwhelming
market share. Nevertheless, more recent data show that Britain’s railways have experienced
unprecedented levels of growth over the past decade and have overtaken the Bus in terms of
market share (see the enlarged part of Figure 2).
Figure 2
Passenger transport by mode 1952-2002 in billion passenger kilometres
0 50 100 150 200 250 300 350 400 450 500 550 600 650 700
1952 19541956 19581960 19621964 19661968 19701972 19741976 19781980 19821984 19861988 19901992 19941996 19982000 2002
Car
Bus Rail
Rail Bus
30 35 40 45 50
1992 1994 1996 1998 2000 2002
Source: DfT (2003).
Over the past 10 years, since privatisation there has been a rise of over 36% in the number of
passenger kilometres travelled on Britain’s railways (but starting from a bad year in 1994).
[image:26.595.103.520.498.685.2]ac-cident and the resulting disruption precipitated a significant decrease at passenger rail travel in
the year 2001/02. A comparison of pre and post-Hatfield figures identifies up to 40% railway
passenger loss on some franchises in the early days (CFIT, 2001). But since then the number
of passenger kilometres is climbing again and has reach a record number in 2003 of more than
40.9 billion Pkm (SRA, 2004a). Figures from Network Rail about passenger traffic on their
[image:27.595.123.501.232.414.2]network show the same trend (see Figure 3).
Figure 3
Passenger train kilometres 1995/96-2003/04 (in million)
320 340 360 380 400 420 440
1995/96 1996/97 1997/98 1998/99 1999/00 2000/01 2001/02 2002/03 2003/04
Source: Network Rail (2004).
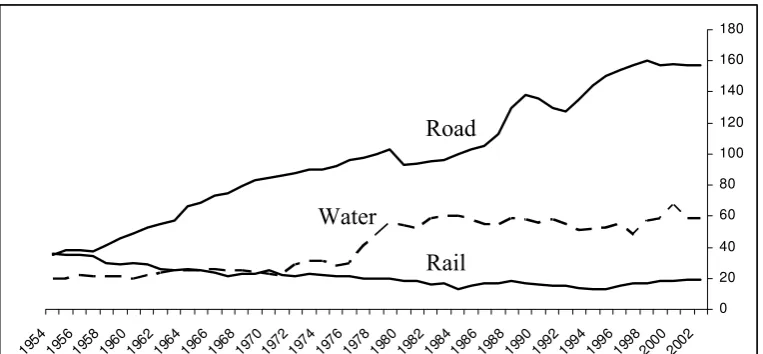
In freight rail transport there has been a similar development. Since the 1960s freight on road
is clearly the major mode of transport in the UK as Figure 4 points out. Data from UIC and
DfT (2003) proves that rail lost market share between the late 1950s and 1994.
Figure 4
Domestic freight transport by mode 1954-2002 in billion tonne kilometres
0 20 40 60 80 100 120 140 160 180 195 4 195 6 195 8
19601962196 4
196 6
196 8
19701972197 4
197 6
197 8
19801982198 4 198 6 198 8 199 0
1992199 4 199 6 199 8 200 0 2002 Road Water Rail
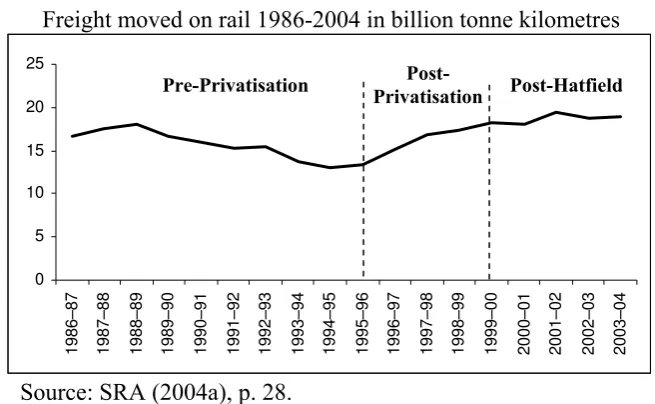
[image:27.595.122.504.567.744.2]Since privatisation the growth in rail freight was significant higher than that of freight
trans-port on road (see also Figure 5). In the six years between 1997 and 2003 rail freight kept off
the road and the freight operating companies recognise their market as a strong growing one
with even more potential for improvement as Smith, G. (2004) shows. In the year 2003/04 the
total number for freight moved was 18.9 billion net tonne kilometres (SRA, 2004a).
Al-though not as much freight is being carried as in previous years in terms of absolute tonnage,
what is being carried is travelling significantly longer distances. In total, rail freight traffic in
Britain measured in tonne kilometre has grown substantially in the last 10 years (by 32.6%),
[image:28.595.146.474.296.498.2]making it the fourth highest performer in Europe (ATOC, 2004).
Figure 5
Freight moved on rail 1986-2004 in billion tonne kilometres
Pre-Privatisation Post-
Privatisation Post-Hatfield
0 5 10 15 20 25 1986 –87 1987 –88 1988 –89 1989 –90 1990 –91 1991 –92 1992 –93 1993 –94 1994 –95 1995 –96 1996 –97 1997 –98 1998 –99 1999 –00 2000 –01 2001 –02 2002 –03 2003 –04
Source: SRA (2004a), p. 28.
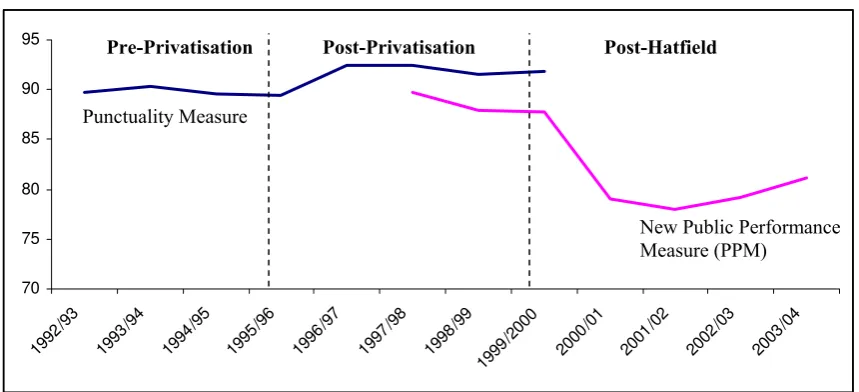
In both passenger and freight transport, traffic has improved since privatisation. Because of
the not increasing rail network it might be questionable how the scarce capacity on the
net-work is allocated and whether the increasing number of trains had any impact on the overall
punctuality. Figure 6 shows evidence that the punctuality improved post privatisation. There
are two measures illustrated in Figure 6. This is due to the circumstances that the Shadow
Strategic Rail Authority (SSRA) – now the SRA – introduced a new Public Performance
Measure (PPM) in June 2000 to give a better indication of the actual performance of Britain’s
passenger railways. The PPM combines figures for punctuality and reliability into a single
performance measure. Unlike the replaced Charter Punctuality measure, it covers all
sched-uled services, seven days a week. The PPM measures the performance of individual trains
against their planned timetable and is therefore the percentage of trains ‘on time’ (within five
Figure 6
Punctuality/ Percentage of trains arriving on time (all operators)
70 75 80 85 90 95 1992 /93 1993 /94 1994 /95 1995 /96 1996 /97 1997 /98 1998 /99 1999 /2000 2000 /01 2001 /02 2002 /03 2003 /04 New Public Performance Measure (PPM)
Punctuality Measure
Pre-Privatisation Post-Privatisation Post-Hatfield
Source: DfT (2002); SRA (2004a), p. 15.
There had been some early success in improving punctuality post-privatisation. However
Fig-ure 6 reveals that Hatfield had a strong negative impact on the punctuality of the trains and
that since then, the percentage of trains on time is recovering rather slowly. Although there
are improving numbers in the last two years the level of punctuality still remains below pre
Hatfield numbers and can therefore be seen as not sufficient.
The quality related performance indicator with the most publicity in Britain is certainly safety.
The opponents of the privatisation, including politicians in key positions, used every train
accident to convince the public that the whole rail reform was a disaster (e.g. Wolmar, 2001)
and there has been a highly critical press. And of course, there have been massive train
acci-dents in the UK since 1994, but none caused by the railway system in the past two years. The
ones with the highest number of fatalities and therefore with most public awareness have been
Ladbrooke Grove on the 5P
th
P
October 1999 with 31 fatalities, Hatfield on the 17P
th
P October
2000 with 4 fatalities, Potters Bar on the 10P
th
P May 2002 with 7 fatalities and most recently
Berkshire on the 11P
th
P November 2004 with 6 fatalities. Investigations found evidence that the
last accident at the Berkshire level crossing was caused by a motorist committing suicide, but
in Hatfield and Potters Bar poorly maintained infrastructure was most likely the cause for the
derailments (e.g. HSE, 2003a). This might be an argument stating that there were weak
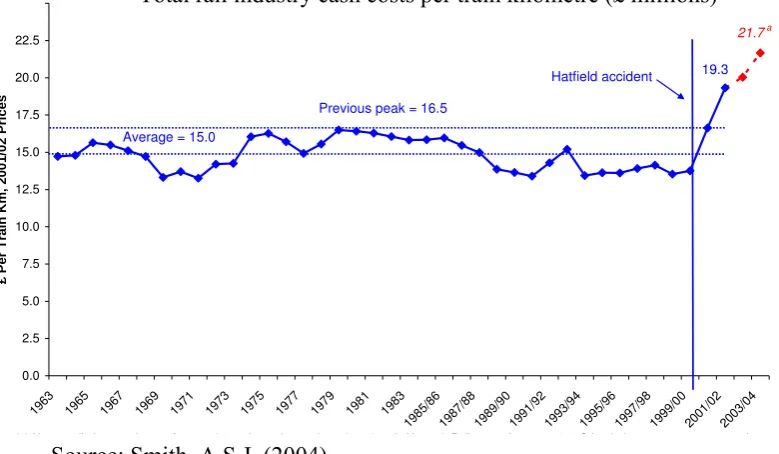
incen-tives to maintain the network, but if one looks at historical data it becomes obvious that those