2008
Method development for the quantification of
ferritin in staple food crops
Rebecca Jane Lukac Iowa State University
Follow this and additional works at:https://lib.dr.iastate.edu/rtd
Part of theMedical Nutrition Commons, and theNutrition Commons
This Thesis is brought to you for free and open access by the Iowa State University Capstones, Theses and Dissertations at Iowa State University Digital Repository. It has been accepted for inclusion in Retrospective Theses and Dissertations by an authorized administrator of Iowa State University Digital Repository. For more information, please [email protected].
Recommended Citation
Lukac, Rebecca Jane, "Method development for the quantification of ferritin in staple food crops" (2008).Retrospective Theses and Dissertations. 14916.
Method development for the quantification of ferritin in staple food crops
by
Rebecca Jane Lukac
A thesis submitted to the graduate faculty
in partial fulfillment of the requirements for the degree of
MASTER OF SCIENCE
Major: Nutritional Sciences
Program of Study Committee: Manju B. Reddy, Major Professor
Kevin Schalinske M. Paul Scott
Iowa State University
Ames, Iowa
1453050
2008
UMI Microform
Copyright
All rights reserved. This microform edition is protected against unauthorized copying under Title 17, United States Code.
ProQuest Information and Learning Company 300 North Zeeb Road
P.O. Box 1346
Ann Arbor, MI 48106-1346
TABLE OF CONTENTS
LIST OF FIGURES iv
LIST OF TABLES v
ACKNOWLEDGEMENTS vi
CHAPTER 1. GENERAL INTRODUCTION 1
INTRODUCTION 1
THESIS ORGANIZATION 2
REFERENCES 2
CHAPTER 2. LITERATURE REVIEW 3
IRON 3
Importance of Iron 3
Iron Metabolism 5
Iron Distribution and Utilization 5
Regulation of Iron Metabolism 7
Iron Requirements 9
Iron Deficiency 12
Prevalence and Causes 12
Adverse Effects 13
Strategies to Alleviate Iron Deficiency 14
Supplementation 15
Fortification 15
Biofortification 16
Biotechnology 19
Iron Bioavailability 21
Dietary Iron Absorption 21
Heme and Nonheme Iron 22
Factors Affecting Nonheme Iron Bioavailability 23
PHYTOFERRITIN 33
Ferritin Structure 33
Role of Phytoferritin 34
Regulation of Phytoferritin Synthesis 36
Iron and Ferritin Accumulation in Plants 37
Analyzing Ferritin in Food Crops 40
REFERENCES 41
CHAPTER 3. ELISA METHOD DEVELOPMENT FOR THE 49
QUANTIFICATION OF FERRITIN IN STAPLE FOOD CROPS
ABSTRACT 49
MATERIALS AND METHODS 52
RESULTS AND DISCUSSION 57
LITERATURE CITED 64
FIGURES 68
TABLES 69
CHAPTER 4. GENERAL CONCLUSIONS 74
GENERAL DISCUSSION 74
REFERENCES 74
LIST OF FIGURES
Figure 2.1. Classification of major iron-containing proteins 4
Figure 2.2. Distribution of total body iron 6
Figure 2.3. Regulation of transferrin receptor and ferritin expression 8
by iron regulatory protein and iron regulatory element
Figure 2.4. Iron homeostasis with hepcidin 9
Figure 2.5. Dietary iron uptake 21
Figure 2.6. Representation of spherical ferritin protein 33
Figure 2.7. Role of nicotianamine as an iron chelator in the plant cell 38
Figure 3.1. Immunoblots of seed ferritins using polyclonal and 69
monoclonal antibodies
Figure 3.2. Densitometry of western blots to quantify ferritin in red beans 70
Figure 3.3. Determination of protein working range for ferritin 71
quantification in red beans using indirect enzyme-linked immunosorbant assay
Figure 3.4. Ferritin content for red beans, white beans, wheat, maize, 72
and brown rice determined using indirect enzyme-linked immunosorbant assay
LIST OF TABLES
Table 2.1. Several functions of iron-sulfur clusters 5
Table 2.2. Recommended daily allowance for iron among different 11
life stage groups according to dietary iron bioavailability
Table 2.3. Risk factors for iron deficiency 13
Table 2.4. Iron compounds used for iron fortification in order of 16
preference
Table 2.5. Dietary substances that influence iron bioavailability and 23
their major dietary sources
Table 2.6. Summary of ferritin and soybean iron bioavailability studies 30
Table 2.7. Comparison of genetic target and signals that regulate ferritin 36
synthesis in plants, animals, and bacteria
Table 3.1. Sequence alignment of a 30-amino acid region in maize, 68
production
ACKNOWLEDGEMENTS
I give my sincere thanks to my major professor, Dr. Manju Reddy, for her guidance and support throughout my graduate school experience. I am grateful for the opportunity to have worked with her on my research and thesis; it has been an invaluable experience.
I acknowledge Drs. Kevin Schalinske and M. Paul Scott for serving on my Program of Study Committee and for their review of my thesis.
I acknowledge Maneesha Aluru as a collaborator on the study. Her insightful contributions, patience, and willingness to teach me various purification and immunoblotting techniques were much appreciated.
A big thank you to my lab mates for their friendships and assistance with my study; to Amy Proulx, for reviewing my thesis and for her insights on life and research. I am fortunate to have worked with such inspiring people.
With gratitude, I acknowledge the International Food Policy Research Institute (IFPRI)/HarvestPlus for their financial support.
I thank Matthies Hoppler from the Institute of Food Science and Technology, Human Nutrition Lab, Zurich, Switzerland, for kindly donating recombinant pea ferritin.
I acknowledge Dr. Matthew Nonnenmann, Assistant Professor, University of Texas Health Science Center at Tyler, for review of my thesis.
CHAPTER 1. GENERAL INTRODUCTION
INTRODUCTION
Iron deficiency (ID) is the most prevalent nutritional deficiency worldwide, afflicting
people of all ages and populations with an array of health complications and accompanying
socioeconomic implications (Provan, 1999). The consequences of iron deficiency to both
individuals and nations are considerable (Micronutrient Initiative, 2004). Several strategies
such as supplementation and food fortification have been used to combat this problem
(Zimmermann and Hurrell, 2007). However, these efforts have fallen short of making any
significant improvements in the iron status of the global population (Micronutrient Initiative,
2004).
The use of biofortification to nutritionally enhance staple food crops through
traditional breeding or genetic modification may provide a high source of bioavailable iron
(Theil, 2004). As a highly sustainable strategy with the potential to reach even remote
populations, biofortification shows potential as a complementary strategy for combating ID.
Increasing the ferritin content of these food crops may help accumulate iron in the seed in a
relatively bioavailable form (Zimmermann and Hurrell, 2007). However, an efficient method
of measuring ferritin in the staple food crops is necessary prior to the implementation of
biofortification. Therefore, the aim of this study was to develop a method to quantify ferritin
in a large number and variety of food crops. Furthermore, the development of this method
THESIS ORGANIZATION
The thesis consists of a review of literature on the importance of iron, iron
requirements, iron deficiency, iron bioavailability, and phytoferritin, and a paper entitled,
“ELISA development for the quantification of ferritin in staple food crops.” This study
involved the development of a method to quantify ferritin in a large number and variety of
food crops using a crude ferritin extraction procedure, antigen selection for antibody
production, immunoblotting, and enzyme-linked immunosorbant assay (ELISA)
development.
REFERENCES
Micronutrient Initiative and UNICEF. Vitamin & Mineral Deficiency: A Global Progress Report. Ottowa, Canada: The Micronutrient Initiative/UNICEF, 2004.
Provan D. Mechanisms and management of iron deficiency anaemia. Br J Haematol 1999; 105:19-26.
Theil EC, Briat, J-F. Plant Ferritin and Non-Heme Iron Nutrition in Humans. HarvestPlus Technical Monograph 1. Washington, DC and Cali: International Food Policy Research Institute and International Center for Tropical Agriculture (CIAT). 2004.
CHAPTER 2. LITERATURE REVIEW
IRON
Importance of Iron
Iron is an essential element involved in a variety of biochemical processes in
the human body (Provan, 1999). Some of these processes include electron transfer reactions,
gene regulation, cell growth and differentiation, oxygen binding and transport, immune
defense, enzyme reactions, and neurotransmitter and protein synthesis (Provan, 1999; Beard,
2001). Since iron is a highly reactive, potentially toxic metal in its free form (McCord,
1998), it must be transported, stored and utilized in proteins to minimize damage to cells
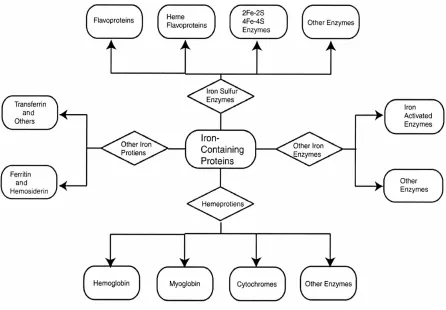
(Ponka, 1999). The major iron-containing proteins may be categorized into four classes
(Beard, 2001): iron-containing nonenzymatic proteins (transferrin, ferritin, and
hemosiderin), sulfur (Fe-S) enzymes, hemoproteins, and nonheme nonsulfur
iron-containing enzymes (Figure 2.1). Iron functions as a cofactor for several enzymes, wherein
iron commonly exists in the form of heme or Fe-S clusters.
Heme iron is an oxygen carrier in hemoglobin and myoglobin for the transport and
storage of oxygen. Hemoglobin consists of four globin chains, each containing a heme group
that facilitates oxygen transport throughout the body. Myoglobin is a single globin chain
protein that facilitates the transport of oxygen in myocytes. Other hemoproteins include
oxidases, peroxidases and catalases for immune defense, and cytochromes in the electron
Figure 2.1. Classification of major iron-containing proteins. From Beard (2001).
Iron exists in either ferrous (Fe+2) or ferric (Fe+2) oxidation states in the body. With
its oxidation-reduction potential, iron can bind ligands (oxygen, nitrogen, and sulfur atoms)
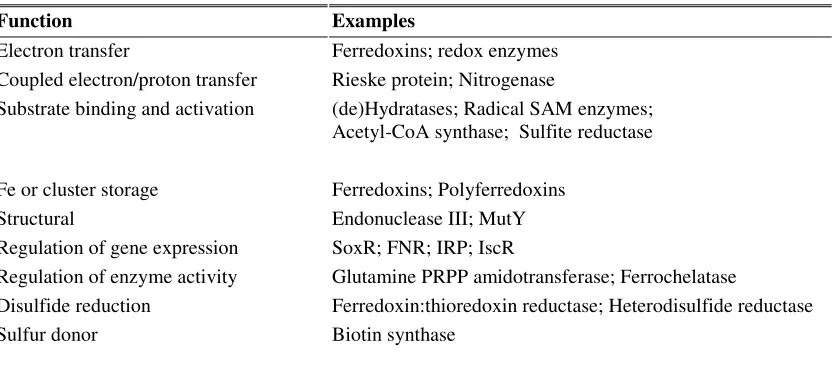
and participate in electron transfer reactions (Beard, 2001). Nonheme iron in the form of
Fe-S clusters has several functions (Table 2.1) (Johnson et al., 2005). These functions include:
electron transfer (ferredoxins), substrate binding/activation, gene regulation, enzyme
activation (Johnson et al., 2005), and energy metabolism (aconitase and proteins of the ETC)
(Beinert and Kiley, 1999). Iron is also important for porphyrin metabolism, collagen
synthesis, lymphocyte and granulocyte function (FAO and WHO 2002), and required by
enzymes for various brain functions involving myelination (Ortiz et al., 2004) and
neurotransmitters serotonin (tryptophan hydroxylase) (Martinez et al., 2001) and dopamine
(tyrosine hydroxylase) (Nagatsu, 1995).
Table 2.1. Several functions of Fe-S clusters. From Johnson et al. (2006).
Function Examples
Electron transfer Ferredoxins; redox enzymes
Coupled electron/proton transfer Rieske protein; Nitrogenase
Substrate binding and activation (de)Hydratases; Radical SAM enzymes; Acetyl-CoA synthase; Sulfite reductase
Fe or cluster storage Ferredoxins; Polyferredoxins
Structural Endonuclease III; MutY
Regulation of gene expression SoxR; FNR; IRP; IscR
Regulation of enzyme activity Glutamine PRPP amidotransferase; Ferrochelatase
Disulfide reduction Ferredoxin:thioredoxin reductase; Heterodisulfide reductase
Sulfur donor Biotin synthase
a
Abbreviations used: SAM, S-adenosylmethionine; acetyl-CoA, acetyl coenzyme A; FNR, fumarate and nitrate reduction; IRP, iron-regulatory protein; IscR, iron-sulfur cluster assembly regulatory protein; PRPP,
phosphoribosylpyrophosphate.
Iron Metabolism
The average adult requires about 3-5 g of iron, but this may vary depending on the
physiological state, age, weight, and gender of the individual (Aisen, 2001). Iron
homeostasis in the body is determined by the uptake, transport, management, storage, and
export of iron. The regulation of these mechanisms is important for maintaining adequate
iron for metabolic functions and to prevent iron overload and subsequent oxidative damage
(Hentze et al., 2004).
Iron Distribution and Utilization
Following export from enterocytes, iron is immediately taken up into carrier proteins
[image:13.612.92.509.177.362.2]Figure 2.2. Distribution of total body iron. From Hentze et al. (2004).
Transferrin proteins only account for less than 1 percent of the total body iron, but they
transport up to about 20 to 25 mg of iron each day. For cellular iron uptake,
transferrin-bound-iron binds transferrin receptor-1 (TfR1) on the surface of the cell and complexes
clathrin-coated pits for endocytosis (Aisen et al., 2001). The acidic pH of the endosome
releases the iron from Tf, which is eventually released back into the circulation for another
cycle of iron transport. The major destination for transferrin is the bone marrow, because
iron is required for the synthesis of hemoglobin. Therefore, erythrocytes contain about
two-thirds of the total iron in the body (Beard, 2001). When the erythrocytes are degraded, the
iron is reused by the reticuloendothelial system and again cycled back to Tf (Fairbanks,
myoglobin and in a variety of enzymes. Excess iron is stored as ferritin and hemosiderin in
the liver, spleen, bone marrow, and other tissues and can be utilized to meet daily
requirements when dietary iron intake is insufficient (Aisen et al., 2001).
Regulation of Iron Metabolism
Preservation of iron homeostasis is largely achieved by the body’s ability to regulate
the rate of intestinal iron absorption to accommodate the body iron needs. A change in the
iron absorption rate generally occurs in response to the body’s iron stores, level of
erythropoietic activity in the bone marrow, hemoglobin concentration, blood oxygen content,
and presence of inflammatory cytokines (Miret et al., 2003). Any indication of low iron
status, such as low iron stores, initiates an increase in iron absorption (Andrews, 1999).
Therefore, iron absorption is the means by which the body replaces the 1-2 mg iron losses
that occur each day (Andrews, 1999). Alternatively, iron absorption is reduced in response
to inflammation or iron overload (Lynch, 2007).
Iron regulatory proteins (IRPs) control multiple aspects of iron metabolism through
the posttranscriptional regulation of proteins involved in iron export (ferroportin), iron uptake
(Tf), iron storage (ferritin), erythroid heme synthesis (eLAS), and the citric acid cycle
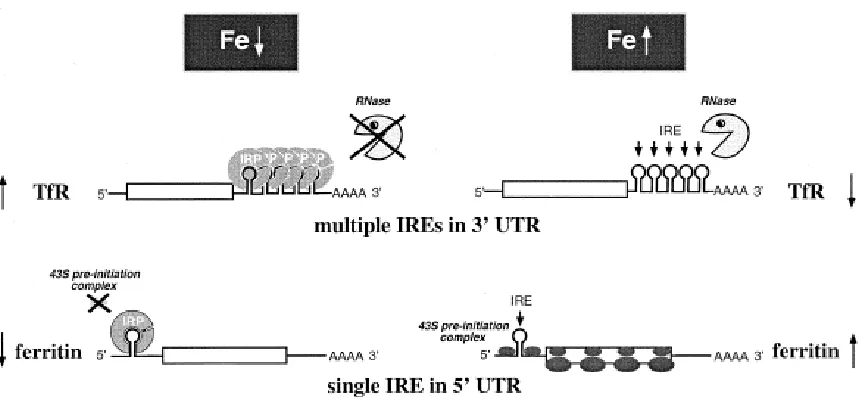
(aconitase) (Hentze et al., 2004). The mRNAs of these proteins have stem-loop structures
called iron response elements (IREs) that play a key role in the regulation of translation. In
the absence of iron or with iron depletion, IRPs have an open cap-like confirmation that
allows it to bind IREs on the mRNA. The mRNAs either have multiple IREs at the
3’-untranslated region (UTR) or a single IRE at the 5’-UTR (Figure 2.3). Transferrin receptor
is an example of a protein that has multiple IREs in 3’-UTR of mRNA, where the binding of
IRPs bind the IREs in 5’-UTR of ferritin mRNA (for example), it prevents translation. If
there is excess iron in the cells, IRP binds iron and becomes inactive, which results in the
degradation of TfR mRNA and the increased expression of ferritin to respectively minimize
[image:16.612.93.526.210.410.2]the cellular uptake of iron and sequester iron into storage.
Figure 2.3. Regulation of TfR and ferritin expression by IRE/IRP. From Pantopoulos (2004).
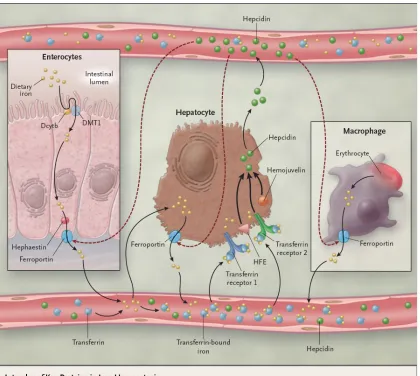
Hepcidin is a key hormone for iron regulation (Figure 2.4). It is an antimicrobial
peptide that is regulated similarly to intestinal iron absorption in that its expression is
controlled by iron stores, erythropoietic activity, hemoglobin, oxygen content, and
inflammation (Flemming and Bacon, 2005). Hepcidin is secreted from the liver in response
to high levels of circulating iron to negatively regulate ferroportin-1 and functions by
preventing the release of iron from macrophages, hepatocytes, and enterocytes (Nemeth et
Figure 2.4. Iron homeostasis with hepcidin. From Fleming and Bacon (2005).
Iron Requirements
Iron requirements depend on the amount of iron lost and the metabolic need for iron.
Daily iron losses occur from the sloughing of cells from the skin, intestines, urinary tract, and
Therefore, a 55 kg non-menstruating woman requires about 0.8 mg Fe/day and a 70 kg man
requires about 1 mg Fe/day to accommodate for daily iron losses. Additional iron is required
during various physiological stages of life to accommodate increases in demand for
metabolic function, which often occur during child and adolescent growth and development,
pregnancy/lactation, and menstrual blood loss.
A newborn has about 75 mg Fe/kg body weight, which is sufficient for the infant
during the first 4-6 months of life. However, premature infants often miss the high supply of
iron offered during the last trimester of pregnancy and therefore require supplemental iron
(FAO/WHO, 2002). The need for body iron doubles after 4-6 months and doubles again
from 1-6 years (FAO/WHO, 2002). Iron is especially important during these early stages of
life for brain development (Beard, 2001).
Adolescents also have increased iron needs due to spurts of rapid growth; however,
requirements are highly variable, often depending on growth rate and gender
(Rossander-Hulthen and Hallberg, 1996). Pubescent girls that are menstruating and still growing may
have iron needs that reach up to 3.2 mg/day. Requirements are also high for pubescent boys
due to increases in blood volume, muscle mass, and myoglobin (CDC, 1998; Wharton,
1999). Menstrual blood loss varies for each woman, but based on average menstrual iron
losses and basal iron loss, the total iron requirement is about 1.5 mg/day for menstruating
women, but may reach up to 2.8 mg/day (Hallberg and Rossander-Hulthenm, 1991).
Postmenopausal women have the same iron requirements as men (FAO/WHO, 2002).
Pregnancy requires an increase of iron from 0.8 mg/day to about 10 mg/day,
primarily during the final trimester to increase blood volume and hemoglobin concentration
difficult for mothers (FAO/WHO, 2002). Therefore, the mother must build iron stores prior
to pregnancy and take iron supplements to prevent depletion of iron. Lactating women lose
about 0.3 mg/day of iron in the milk, so based on these losses and the basal iron loss, the total
iron required for lactating women is about 1.1 mg/day (Hallberg, 1992).
Recommendations for dietary iron intake are based on the iron needs of the
individual, but vary depending on the bioavailability of iron in the meal and the iron status of
the individual. The recommended daily allowance (RDA) for individuals at various life
stages are summarized in Table 2.2, at three levels of iron bioavailability (FAO/WHO,
2002).
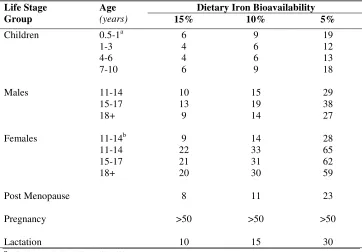
Table 2.2. Recommended daily allowance (mg/d) for iron among different life stage groups according to dietary iron bioavailability. From FAO/WHO (2002).
Dietary Iron Bioavailability Life Stage
Group
Age
(years) 15% 10% 5%
Children Males Females Post Menopause Pregnancy Lactation 0.5-1a 1-3 4-6 7-10 11-14 15-17 18+ 11-14b 11-14 15-17 18+ 6 4 4 6 10 13 9 9 22 21 20 8 >50 10 9 6 6 9 15 19 14 14 33 31 30 11 >50 15 19 12 13 18 29 38 27 28 65 62 59 23 >50 30 a
Highly variable bioavailability b
[image:19.612.86.448.386.638.2]Iron Deficiency
Iron deficiency occurs in three progressive stages: iron depletion, iron deficient
erythropoiesis, and iron deficiency anemia (WHO, 2001). Iron depletion is defined by a
depletion of iron stores. Iron deficient erythropoiesis occurs with the depletion of iron stores
and reduced transport of iron, characterized by an increase in transferrin receptor
concentration. Iron deficiency anemia (IDA) occurs with severe ID and is characterized by
both depleted iron stores and a low hemoglobin concentration (WHO, 2001).
Prevalenceand Causes
Iron deficiency is the most prevalent nutritional problem, affecting an estimated 4 to 5
billion people worldwide (WHO, 2004). IDA is a major problem in developing countries,
where about 90 percent of the anemic population resides. Even in the United States, IDA
afflicts about one-third of the low-income pregnant women and about three-fourths of
adolescent females do not meet dietary iron requirements (CDC, 1998). By reducing the
work capacity in adults by 10-15 percent, IDA has also been estimated to have a global
economic effect in the billions of dollars, causing an estimated 1.5 percent loss in gross
domestic product (FAO, 2002).
Iron deficiency and ultimately IDA generally develop because of increased iron
requirements or losses and inadequate iron intake, absorption, or utilization (Table 2.3)
(Stang and Story, 2005). The increased iron requirements for infants, children, adolescents
and pregnant women due to increased growth and development are previously discussed.
Blood loss is the main cause of iron loss, generally due to heavy bleeding during menses,
hemorrhage, or parasitic infection (hookworms and flukes), which are common in developing
In developing countries, the major cause of ID is an inadequate iron intake. The high
cost and inaccessibility of iron-rich foods, such as meat and fish, may limit the diet to consist
primarily of staple food crops, such as wheat, maize, and rice in certain populations (Welch
and Graham, 2004). Rice alone provides up to 80 percent of the caloric intake for half of the
global population (Meng et al., 2005). Such a diet is not diversified enough to provide all of
the nutrients necessary for good health. Staple food crops are generally considered to be
poor sources of iron due to the low iron content and bioavailability (WHO, 1996). This poor
bioavailability is due to the inhibition of nonheme iron absorption by dietary factors such as
phytic acid and polyphenols, which are commonly found in staple crops (Hallberg et al.,
1987).
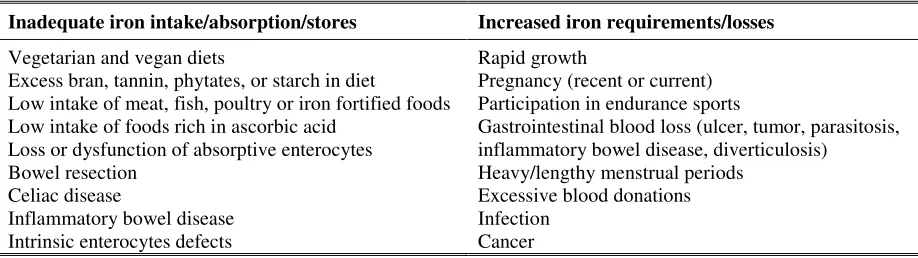
Table 2.3. Risk factors for iron deficiency. Modified from Stang and Story (2005); Andrews (1999).
Inadequate iron intake/absorption/stores Increased iron requirements/losses
Vegetarian and vegan diets
Excess bran, tannin, phytates, or starch in diet
Low intake of meat, fish, poultry or iron fortified foods Low intake of foods rich in ascorbic acid
Loss or dysfunction of absorptive enterocytes Bowel resection
Celiac disease
Inflammatory bowel disease Intrinsic enterocytes defects
Rapid growth
Pregnancy (recent or current) Participation in endurance sports
Gastrointestinal blood loss (ulcer, tumor, parasitosis, inflammatory bowel disease, diverticulosis)
Heavy/lengthy menstrual periods Excessive blood donations Infection
Cancer
Adverse Effects
Given the wide array of physiological functions that require iron during various
stages of life, a deficiency of iron consequently causes an array of adverse health effects.
Impaired cognitive development, growth, and behavior may occur among infants and
children from ID during the early stages of life (final trimester of pregnancy to the age of
[image:21.612.86.545.398.527.2]believed to decrease motor activity and school performance (Sachdev et al., 2005). Iron
deficiency may also increase the risk of heavy-metal (lead and cadmium) toxicity in children
(Zimmermann et al., 2006), due to an increased absorption capacity.
Iron deficiency anemia afflicts more than 500 million women each year and
contributes to more than 60,000 deaths during childbirth (Micronutrient Initiative, para. 1).
During pregnancy, IDA increases the risk for premature birth, low birth weight, prenatal and
perinatal neonatal loss, and maternal mortality (Schorr and Hediger, 1994). In people of all
ages, ID can impair immune function, leading to an increased risk of infection, morbidity,
and mortality. Fatigue is also a common symptom of IDA that may result in reduced
physical capability, work performance, and productivity (Baynes and Bothwell, 1990), which
may consequently have socioeconomic implications (Provan, 1999). Altered hormone
production and metabolism that affect neurotransmitter synthesis and thyroid hormones
ultimately impairs neurological, muscular, and temperature-regulatory systems (Beard,
2001).
Strategies to Alleviate Iron Deficiency
Reducing the incidence of ID would require the integration of several strategies,
including: dietary education, modification, and diversification to improve iron intake and
bioavailability; control over parasitic infections; supplementation; fortification of food
products; and biofortification or biotechnology to enhance the iron content in staple crops
(Zimmermann and Hurrell, 2007; Welch and Graham, 2003). Improving iron intake and
bioavailability through dietary modification and diversification would be among the most
consumption of highly bioavailable iron-containing foods is often not financially feasible for
many population groups and there are difficulties associated with changing traditional dietary
practices (Zimmermann and Hurrell, 2007). As a treatment option, dietary modification and
diversification would also require improvements in the processing, production, and
distribution of a variety of foods (Huma et al., 2007; Marfo et al., 1990).
Supplementation
Iron supplementation is generally used as a short-term strategy for controlling or
preventing ID, especially in high-risk groups such as pregnant women (Cogswell et al.,
2003). For individuals with IDA, supplementation has been found to be highly effective for
improving iron nutritional status (Cavalli-Sforza et al., 2005). The iron compounds
commonly used in supplements (ferrous sulfate and ferrous gluconate), are both low cost and
highly bioavailable (Zimmermann and Hurrell, 2007). However, there are several challenges
associated with using supplementation as an ID reduction intervention. Some include,
distribution, dosage compliance, and adverse side effects (e.g., nausea, abdominal pain)
(Stolzfus and Dreyfus, 1998).
Fortification
Iron fortification is a long-term, cost-effective intervention to reduce ID incidence
(WHO/FAO, 2006). However, problems exist when using fortification with iron compounds.
Specifically, identifying bioavailable iron compounds that will be compatible with the food
vehicle is challenging (Mehansho, 2006). Many of the highly bioavailable forms of iron
often react with food components in the food vehicle, causing peroxidation or color and
Consequently, the less bioavailable forms of iron have been used in food fortification. The
iron compound chosen for fortification often depends on the diet of the target population and
the food vehicle (Table 2.4). Part of the practicality of food fortification is the ability to
incorporate iron into foods that are commonly consumed by populations at risk of ID. Some
of the common food fortification vehicles being used globally, include: soy sauce (China),
fish sauce (Vietnam), wheat and maize flour (South Africa), powdered milk (Chile), curry
powder (South Africa), low-grade salt (Africa), rice (India), and wheat flour (worldwide)
(Zimmermann and Hurrell, 2007). There are also self-added fortification products in the
form of powders or sprinkles, crushable tablets, and fat-based spreads that have been found
to be effective treatments (Nestel et al., 2003; Zlotkin et al., 2003). Other challenges of
fortification are measuring the effectiveness of the products and ensuring financial
affordability and accessibility of the products (Hurrell, 2002).
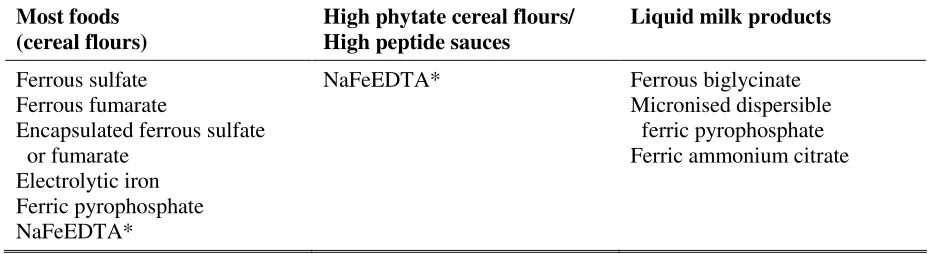
Table 2.4. Iron compounds used for iron fortification in order of preference. Modified from Zimmermann and Hurrell (2007).
Most foods (cereal flours)
High phytate cereal flours/ High peptide sauces
Liquid milk products
Ferrous sulfate Ferrous fumarate
Encapsulated ferrous sulfate or fumarate
Electrolytic iron Ferric pyrophosphate NaFeEDTA*
NaFeEDTA* Ferrous biglycinate
Micronised dispersible ferric pyrophosphate Ferric ammonium citrate
*Ethylenediaminetetraacetic acid
Biofortification
Biofortification involves the use of selective plant breeding techniques to improve the
[image:24.612.82.546.473.600.2]long-term strategy for combating ID, biofortification is believed to be both highly sustainable
and cost-effective (Meenakshi et al., 2007). After research, development, breeding, and
dissemination of iron-rich seeds there are few recurrent costs. This is primarily because once
the seeds are distributed to farmers, the crops could be locally grown; a useful means for
reaching remote areas where there is limited access to other intervention strategies. Since
biofortification is based on improving foods that are commonly consumed, there would be
little need for any behavioral changes of the consumers (Nestel et al., 2006). Therefore,
compliance would not be an issue in this strategy. An important benefit of this strategy,
especially in regards to farmer acceptance, is that the high iron status of the plant seemed to
improve crop yields (Graham et al., 2001). Disease resistance and stress tolerance were also
improved in the seedlings of iron-rich plants, even in iron-poor soils (Welch and Graham,
1999).
There is evidence that it is physiologically feasible to increase the micronutrient
levels of staple foods through breeding (Graham et al., 2001). When several different
cultivars of common beans, wheat, and rice were grown in the same field, the seeds were
found to have a wide genetic variation in the total iron content (Welch and Graham, 2004).
For example, cultivars of common beans (Phaseolus vulgaris) grown in the same field were
found to have iron in the range of 34-89 µg/g (Beebe et al., 2000). This large variation
suggests that it should be possible to increase the iron content through the selective breeding
of food crops (Welch and Graham, 2004). Additional evidence exists that the variations in
iron concentrations among rice cultivars were mostly due to genetic components rather than
environmental (Gregorio et al., 1999). Conversely, maize had a small range of iron
iron-rich maize cultivars may not be feasible using traditional breeding alone. The constancy
of seed iron-density across a variety of environmental conditions should also be considered
for the effective implementation of biofortification as a global strategy (Welch and Graham,
2004).
Both rice (7-23 mg Fe/kg) and wheat (25-56 mg Fe/kg) may have increased iron
content through selective breeding. However, the milling process for these seeds results in a
loss of almost all of the iron, because most of the iron in cereal grains is concentrated in the
bran (Resurreccion et al., 1979; Widdowson, 1975). Therefore, wheat and rice may not be
the best crops for biofortification, unless there was an endosperm-specific iron improvement.
This is due to the difficulty of increasing the iron concentration of milled wheat up to 40
mg/kg, which is the concentration of iron fortified wheat flour (Zimmermann and Hurrell,
2007). A proof of concept study to improve iron status of Filipino women by providing an
extra 1.4 mg Fe/day through the consumption of iron biofortified rice, resulted in a moderate
increase of iron stores (Haas et al., 2005). This study reveals that iron biofortified crops may
improve the iron status of women and contribute to meeting the RDA for iron. However,
there is concern that biofortification using conventional breeding techniques may only
provide moderate increases in iron content, limiting its capacity to make a significant
contribution to iron intake (Haas et al., 2005). The variety of culturally unique preparation
and processing techniques that reduce the iron content or bioavailability in seeds also
remains a major challenge and concern for biofortification (Welch and Graham, 2002). As a
strategy to combat ID, biofortification must be able to increase the iron content high enough
Another issue with biofortification of food crops is the question of iron
bioavailability. Increasing the iron content of the crops for nutritional enhancement would be
futile if the iron is not bioavailable. Cereals and legumes have high concentrations of phytate
and polyphenols that are known inhibitors of iron absorption (Sayers et al., 1973).
Therefore, one strategy to improve iron bioavailability is to reduce phytate concentrations in
the iron-dense varieties (Bouis, 2002). Low-phytate mutants, with a two-thirds reduction of
phytate, have been identified for maize, barley, and rice genotypes (Raboy, 2000). However,
a 90% reduction of phytate may be required to see significant improvements in iron
absorption, which may not be achieved through conventional breeding (Hurrell et al., 1999).
Phytate reduction may also cause anomalies in the yield, germination and growth
characteristics of the plant (Pilu et al., 2005).
Alternatively, some research has found little effect of phytate on iron absorption with
the long-term consumption of soybeans (Murray-Kolb et al., 2003). With about 50% of the
soybean iron distributed to proteins (ferritin), as measured by radioactive label, the good iron
bioavailability may be attributed to the high ferritin concentrations in these soybeans.
(Murray-Kolb et al.,2003). Although the bioavailability of ferritin is still in question, there
is interest in increasing the ferritin concentration of plants to improve the iron content and
possibly iron bioavailability (Theil, 2004).
Biotechnology
Most biofortification efforts have generally involved conventional breeding
techniques, due to the poor acceptance and political barriers associated with genetically
modifying food crops (Jauhar, 2006). However, biotechnology may be a useful strategy for
Several approaches, including the expression of lactoferrin, hemoglobin, phytase, and
ferritin, have been attempted to enhance the iron content and bioavailability in a variety of
plants. Human lactoferrin was expressed in rice and found to have similar bioavailability as
ferrous sulfate-fortified rice (Lonnerdal and Bryant, 2006). The over-expression of maize
hemoglobin as a highly bioavailable iron source is still at its early stages (Proulx et al.,
unpublished). Temperature-resistant Aspergillis niger phytase was inserted in rice
endosperm, but was not able to tolerate the heat from cooking and did not significantly
reduce phytic acid in rice (Lucca et al., 2001). Lucca et al. (2002) was able to increase the
iron content of rice by two fold, by introducing a Phaseolus vulgaris ferritin gene and a
heat-resistant phytase from Aspergillus fumigates that was able to degrade the phytate in the seeds
to produce a potentially bioavailable and high source of iron. Murray-Kolb et al. (2002) also
produced rice over-expressing ferritin and found that the transgenic rice was as effective as
ferrous sulfate for improving the iron status of iron-deficient rats.
Some of the challenges associated with enhancing the iron in the food crops are
related to overcoming the homeostatic control of iron in the plant tissue. The potential
barriers of biotechnology are related to: the absorption of iron from the soil into the root, the
translocation of iron from the xylem and phloem sap to the seed or edible part of the plant,
and the distribution of the iron to different tissues so that the seed is able to accumulate
nontoxic bioavailable iron for human consumption (Lucca et al., 2006). For example, Goto
et al. (2005) reported that the accumulation of iron in the high ferritin-expressing rice may
have been limited by the iron uptake and transport rather than influenced by the expression of
ferritin. The study of transgenic crops and their potential to complement traditional plant
Iron Bioavailability
The absorption of dietary iron largely depends on the iron status of the individual and
the amount and availability of the iron consumed (Hentze et al., 2004). The bioavailability
for a nutrient represents the ability of the nutrient to be taken up or absorbed and used by the
body.
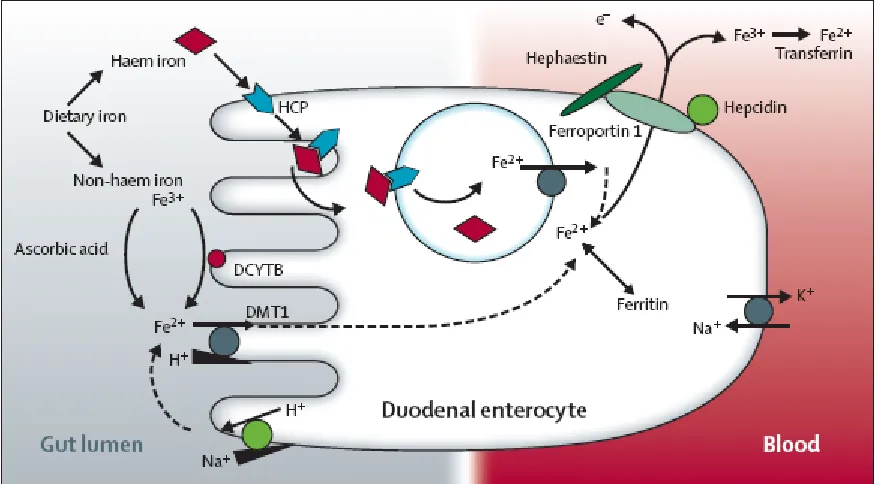
Dietary Iron Absorption
Following ingestion of a meal, digestion breaks up the food to release nutrients for
absorption (Figure 2.5). The mechanism and efficiency of iron absorption largely depends
on the solubility of the iron, the form it is in when it reaches the intestinal lumen, and the
[image:29.612.92.532.402.644.2]presence of other dietary components ingested with the meal (Dunn et al., 2007).
The two major forms of iron in foods are heme and nonheme iron. Before dietary
nonheme iron can be absorbed, Fe (III) must be reduced to Fe (II) by ferrireductase duodenal
cytochrome-b (Dcytb). Fe (II) can then enter the cell through the apical membrane via
divalent metal transporter-1 (DMT-1). Heme iron binds to heme carrier protein-1 (HCP-1),
is internalized by receptor-mediated endocytosis and sent to the endoplasmic reticulum
where the iron is released from heme by heme oxygenase-1 (HO-1) (Shayeghi et al. 2005).
The iron from either source makes up the intracellular iron pool, which is delivered to the
basolateral membrane to be exported by ferroportin-1, and oxidized by ferroxidase
hephaestin (Hp) to Fe(III) for binding to transferrin (Donovan et al., 2005; Chen et al., 2004).
Heme and Nonheme Iron
The iron in our food generally exists in the organic form as heme or as ferric or
ferrous compounds referred to as nonheme iron. Heme and nonheme iron have different
mechanisms for intestinal absorption, but they ultimately contribute to the same intracellular
iron pool. Heme iron primarily comes from the breakdown of hemoglobin and myoglobin in
meat, fish, and poultry and makes up about 10-15 percent of the total iron in Western diets
(Hallberg and Rossander, 1982). Heme iron is directly absorbed into the enterocytes with
virtually no influence by dietary factors, so the bioavailability of heme iron may reach up to
30 percent (Fairbanks, 1994). Nonheme iron is primarily found in grains, vegetables, and
some animal products. Although, about 85-90 percent of the total dietary iron consumed is
nonheme iron (Hallberg and Rossander, 1982), the absorption of nonheme iron is commonly
affected by dietary factors that chelate the iron and either enhance or inhibit absorption
only 1-10 percent (Hallberg and Rossander, 1982), hence nonheme iron makes a smaller
contribution to the total iron absorbed compared to heme iron.
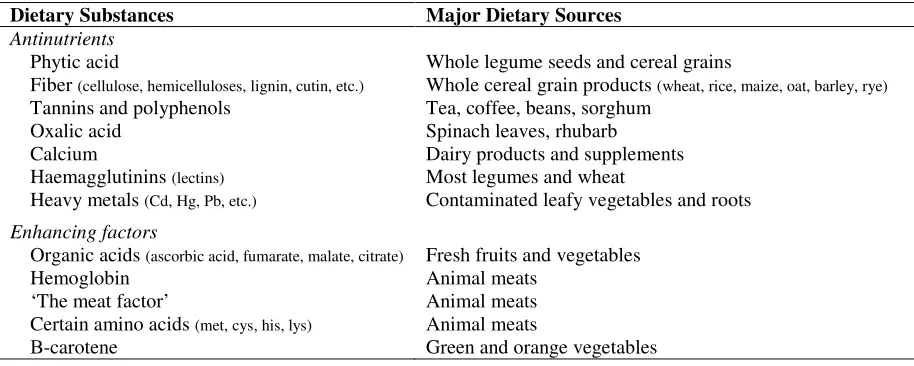
Table 2.5. Dietary substances that reduce or promote iron bioavailability and their major dietary sources. Modified from Graham et al. (2001).
Dietary Substances Major Dietary Sources
Antinutrients
Phytic acid
Fiber (cellulose, hemicelluloses, lignin, cutin, etc.) Tannins and polyphenols
Oxalic acid Calcium
Haemagglutinins (lectins) Heavy metals (Cd, Hg, Pb, etc.)
Whole legume seeds and cereal grains
Whole cereal grain products (wheat, rice, maize, oat, barley, rye) Tea, coffee, beans, sorghum
Spinach leaves, rhubarb Dairy products and supplements Most legumes and wheat
Contaminated leafy vegetables and roots
Enhancing factors
Organic acids (ascorbic acid, fumarate, malate, citrate) Hemoglobin
‘The meat factor’
Certain amino acids (met, cys, his, lys) Β-carotene
Fresh fruits and vegetables Animal meats
Animal meats Animal meats
Green and orange vegetables
Factors Affecting Nonheme Iron Bioavailability
Phytic acid. In plants, phytate is the major storage compound for phosphate and
functions to sequester iron in the seed for growth (Raboy et al., 2001). Found primarily in
seeds, cereal grains, legumes and nuts, phytate is an inhibitor of nonheme iron absorption
(Frossard et al., 2000). Following the ingestion of a meal, phytate is released via digestion
and complexes with nonheme iron in the intestinal lumen, making the iron unavailable for
absorption. The high consumption of phytate, such as with vegetarian diets, has been found
to increase the incidence of IDA (Shaw, 1995). An intake of 5-10 mg of phytate has the
potential to reduce the nonheme iron bioavailability by up to 50 percent (Zhou and Erdman,
[image:31.612.85.542.193.376.2]Soybeans have the potential to be a high source of iron; however, they contain about
10-22.2 g/kg phytic acid (Reddy et al., 1982). The reduction of phytic acid in soybeans was
found to improve the nonheme iron absorption (Graf and Eaton, 1990) and the addition of
meat or ascorbic acid to the diet was found to trump the inhibitory effect of phytate (Hallberg
et al., 1987).
Polyphenols. These are compounds that exist in a variety of foods, such as fruits and
vegetables, but are most commonly found in herbal and black teas, coffee, red wine, and
cocoa (Hurrell et al., 1999). Polyphenols, such as tannins, are major inhibitors of nonheme
iron absorption. Beverages containing 100-400 mg of polyphenols were found to reduce iron
absorption by 60-90 percent (Hurrell et al., 1999). It is thought that once the polyphenols are
released during digestion, they chelate iron in the intestinal lumen, rendering iron insoluble
and thereby reducing uptake. The daily consumption of polyphenols in the Spanish diet was
found to average about 2.6-3 g per person (Saura-Calixto et al., 2007).
Calcium. It is fairly well accepted that calcium from dairy product or supplements
reduces nonheme iron absorption (Cook et al., 1991; Hallberg et al., 1991); however, there is
evidence that dietary calcium may not have an inhibitory effect on iron from a varied diet
(Reddy and Cook, 1997). Otherwise, calcium appears to reduce iron availability by 50-60
percent when a dose of 40-300 mg of calcium is consumed with a food item (Hallberg et al.,
1991). Inhibition is speculated to occur from the formation of a calcium phosphate complex
that binds iron during digestion, subsequently reducing the iron bioavailability (Morck and
Cook, 1981).
Ascorbic acid. With the ability to both reduce and form a stable complex with iron,
Ascorbic acid has a dose-relating effect, whereby a 25-1000 mg dose of ascorbic acid given
in a formula meal with 4.1 mg iron, improved iron absorption by 0.8-7.1 percent (Cook and
Monsen, 1977). Fortification attempts with ascorbic acid effectively improved iron
bioavailability; however, there were problems with oxidation in certain foods. Vitamin C
supplementation (Cook and Monsen, 1977) and ascorbic acid given as part of a complete
meal were each found to only moderately improve iron status (Cook and Reddy, 2001).
Meat. It not only provides highly bioavailable heme iron, but meat also has the
ability to enhance the absorption of all of the nonheme iron in a meal (Conrad and Umbreit,
2000). Populations with a low consumption of meat have a higher incidence of ID, even with
the same total iron intake as meat eaters (Conrad and Umbreit, 2000). Meat apparently
seems to be an important component of the diet as a useful source of iron in regards to iron
absorption. However, the mechanism or factors in meat that influence nonheme iron
absorption are still unknown, but it is thought that they may be related to the amino acid
profile of the meat (Bjorn-Rassmussen and Hallberg, 1979) and the ability to solublize the
iron to improve absorption (Swain et al., 2002).
Ferritin. Soybeans are considered to have high iron content, but the bioavailability of
that iron is in question. The bioavailability of soybean iron largely depends on what form it
is found, in ferric phytate or ferritin, and whether ferritin iron absorption is affected by
dietary factors. Several earlier studies have reported a low bioavailability of iron from
soybeans and have attributed this to the high concentration of phytate in these seeds (Layrisse
et al., 1975; Lynch et al., 1984). However, despite its high phytate content, soybean iron has
also been found to be well absorbed compared to ferrous sulfate in marginally iron deficient
status, the high absorption of soybean iron may be attributed to the poor iron status of the
subjects. For example, when soybeans were fed as a soup to nonanemic men, the iron
bioavailability was low compared to absorption from ferrous sulfate (Lynch et al., 1984).
However, it cannot be ruled out that the high iron absorption may have been due to a high
ratio of ferritin to phytate in the seeds or the good bioavailability of ferritin iron, because the
soybeans used in the Murray-Kolb et al. (2003) study had high concentrations of ferritin with
about 50 percent of the iron bound as ferritin.
Some of the first ferritin bioavailability studies in humans found that ferritin iron
was poorly absorbed when fed either alone or with various food items (Kuhn et al., 1968;
Layrisse et al., 1975; Lynch et al., 1984; Martinez-Torres et al., 1986; Skikne et al., 1997).
Bioavailability of iron in these studies ranged from 0.5-3.8 percent compared to 8.2-24
percent bioavailability of ferrous sulfate, as measured by red blood cell (RBC) incorporation.
Absorption was also affected by many of the same dietary factors (phytate, desferrioxamine,
ascorbic acid, meat) as nonheme iron (Kuhn et al., 1968; Martinez-Torres et al., 1986;
Skikne et al., 1997), even though ferritin iron often had a slightly different bioavailability
than other traditional nonheme iron compounds. The problem with these studies (with the
exception of Lynch et al., 1984) lies with the use of subjects with varying iron needs and iron
statuses for the study of bioavailability, because this likely contributed to a highly variable
iron absorption among the subjects in each study.
In contrast, some more recent ferritin bioavailability studies in humans (Sayers et al.,
1973; Murray-Kolb et al., 2003) and rats (Beard et al., 1996; Chang et al., 1996) have
reported good ferritin iron absorption with 20-33 percent bioavailability (RBC). In a few
(Davila-Hicks et al., 2004; Lonnerdal et al., 2006). Ferrous sulfate is highly soluble and
generally found to have high bioavailability in foods, so any iron source with comparable
bioavailability would be considered a good source of iron. The major ferritin and soybean
iron bioavailability studies are summarized in Table 2.6. Some studies also include the
effects of dietary factors on ferritin and/or soybean absorption.
There are several different factors that may have contributed to the contradictory
results of the ferritin and soybean iron bioavailability studies. First of all, both the iron status
and gender of the human subjects was variable in many of the studies (Skikne et al., 1997;
Martinez-Torres et al., 1986; Layrisse et al., 1975; Cook et al., 1972; Kuhn et al., 1968),
which can greatly affect iron absorption. Another major problem may be due to the method
of radioactive labeling used. An early validity study of intrinsic versus extrinsic labeling of
iron in soybeans reported little difference between the methods, with a 1.3 extrinsic to
intrinsic ratio and no difference between ferrous or ferric forms of iron (Cook et al., 1972).
However, it is currently believed that the iron used to extrinsically label ferritin in foods may
not equilibrate with the natural iron in the protein, which would result in an inadequate
representation of ferritin iron (Welch, 1993; House, 1999). There is also a reportedly
reduced iron absorption observed with extrinsically labeling of a complete meal rather than a
single food item (Reddy et al., 2000). Problems with intrinsic labeling arise when the ferritin
production is induced in the animal, such as through inflammation, whereby the iron is again
not representative of normal ferritin iron (Theil, 2004). The conflicting bioavailability results
may also be due to the type of iron salt used as the source of radiolabel in a meal
(Murray-Kolb et al., 2003), whereby ferric citrate is generally better absorbed than ferrous sulfate or
soybean or ferritin iron was provided may influence the results due to a potential food matrix
effect and competition with various meal components, such as phytate.
As stable proteins found to resist denaturation by heat (85°C), 6 M urea, and
proteolytic enzymes at a neutral pH (Liu et al., 2003), ferritins are suspected to potentially
resist denaturation during gastrointestinal digestion (Theil, 1987). However the stability of
ferritin during digestion remains highly controversial. With the efficacy of ferritin iron
absorption relying strongly on the theory that the stable protective coat prevents the
inhibitions of nonheme iron absorption, it is important to investigate the digestibility of
ferritin and how this may modulate its iron bioavailability.
A recent study measured the uptake of iron from purified pea seed ferritin, digested in
vitro, using a Caco-2 cell model (Bejjani et al., 2007). Despite the loss of higher order
structure of the protein after digestion, the iron uptake was 13.9 ng/mg of protein from
digested ferritin, which was comparable with that of ferrous sulfate (19.3 ng/mg protein) and
correlated with previous bioavailability studies in humans. However, the iron uptake was
significantly reduced with the addition of phytate (4.5 ng/mg protein) and enhanced with the
addition of ascorbic acid (125 ng/ml protein).
A similar study compared the uptake of either intact or digested (pH 2 or pH 4)
purified horse spleen ferritin using a Caco-2 cell model (Kalgaonkar and Lonnerdal, 2008).
Ferritin alone showed an increase in cell uptake with greater digestion of the protein (from
intact to in vitro digestion at pH 2). However, the pH 2 digested ferritin was also the most
greatly influenced by dietary factors (phytic acid, ascorbic acid, tannic acid, calcium, and
influenced by any of the dietary factors with the exception of tannic acid, which
unexpectedly increased uptake.
Both studies verified that ferritin may not have the capability to prevent chelation of
iron with dietary factors after digestion at pH 2. However, it is thought that as ferritin is
normally consumed within a food matrix where pH within a bolus of food may not reach pH
2, ferritin may be partially protected from complete digestion (Kalgaonkar and Lonnerdal,
2008). Researchers have also reported that the rate of ferritin proteolysis may depend on the
conformation of the protein and that iron-bound ferritin had reduced digestibility (pepsin, pH
2.5) by 2-3 times compared to that for apoferritin, with only a fractional loss of structure
3
[image:38.612.73.712.108.468.2]0
Table 2.6. Summary of ferritin and soybean iron bioavailability studies in rats and humans and ferritin iron absorption studies in human Caco-2 cells
Study Subjects Iron Form and Dose Food Matrix Bioavailability General Conclusions
Rats
Beard et al., 1996 8 rats
(iron deficient)
Control: 30 mg Fe/kg diet FeSO4: 30 mg/kg
Ferritin (ft): 29 mg/kg
Soybean meal (SBM): 26 mg/kg
AIN diet (Borel et al., 1991) or AIN Fe-deficient diet
Fe recovery (spleen) FeSO4:126%
Ft: 97% SBM: 72%
89-100% recovery from anemia with all treatments
Chang et al., 2005 8 rats
(iron deficient)
Control: 48 mg Fe/kg diet Horse spleen ft (HSF): 35 mg/kg Ft-producing recombinant yeast (FTY): 35 mg/kg
Ferrous ammonium sulfate (FAS): 30 mg/kg, 50 mg/kg
AIN-76A diet or AIN Fe-deficient diet
Fe recovery (spleen) HSF: 103%
FTY: 99% FAS (30): 85% FAS (50): 93%
Iron recombinant ferritin of yeast is bioavailable, indicating potential iron source as iron-fortified yeast Humans
Kuhn et al., 1968 2-17 people, 11-60 y
(nonanemic to iron deficient)
59
Fe intrinsically labeled soybeans (SB) and purified animal liver ferritin, 55Fe extrinsically labeled ferrous ascorbate (FA)
Soybean patty with margarine or ferritin solution
Fe absorption from Food /FA
SB/FA: 0.68 Ft/FA: 0.12 RBC
SB+vit C: 19% Ft+vit C: 9% Ft+ phytate: 0.4%
Composition of diet is important for
bioavailability of dietary iron
Cook et al., 1972 11 people, 16-78 y (nonanemic to iron deficient)
55
Fe intrinsically labeled or 59Fe extrinsically labeled soybeans
Boiled, mashed soybeans
RBC SBintrinsic: 9% SBextrinsic: 12% Extrinsic/intrinsic: 1.3
Both labeling tags provide a valid measure of Fe absorption Sayers et al., 1973 5 women As FeSO4 or intrinsically labeled
bean ferritin
Biscuit RBC
FeSO4: 73%
Ferritin: 20%
3
[image:39.612.72.712.100.455.2]1
Table 2.6. continued
Study Subjects Iron Form and Dose Food Matrix Bioavailability General Conclusions Layrisse et al.,
1975
7 people
(nonanemic to iron deficient)
55
Fe or 59Fe extrinsically labeled purified rabbit liver ferritin and soybean iron and FeCl3
Alone or with Fe labeled boiled soybean mush
RBC
Ferritin: 1.9%
Ferritin in soybean:0.5%
Ferritin Fe absorption is reduced by dietary factors in soybeans Lynch et al., 1984 10 men, 18-20 y
(nonanemic)
2.7 mg extrinsically labeled 55Fe or
59
Fe + 1.3 mg added as FeCl3 in
soybeans
3 mg 55Fe or 59Fe as FeSO4
Soybean soup RBC
Soybean: 1.7% FeSO4: 16%
Bioavailability of Fe in soybeans is low
Martinez-Torres et al., 1986
10 men 53 women (nonanemic to iron deficient)
2 mg meat 59Fe, 2.8 mg vegetable
59
Fe extrinsically labeled and 55Fe as rabbit ferritin or as 3 mg Fe ascorbate
Meat with rabbit ferritin or traditional meal (3 veg + meat)
RBC
Ferritin + meat: 9% Ferritin + meat + vegetables: 3.0% Fe ascorbate: 32%
Bioavailability of Ferritin Fe is similar to nonheme iron
Skikne et al., 1997
10 people, 23-41y (nonanemic to iron deficient)
5 mg 59Fe as FeSO4 or 55Fe
intrinsically labeled aspurified bovine ferritin
Bovine spleen and liver ferritin alone or with food
RBC
FeSO4 (alone): 24%
FeSO4 (food): 8.2%
Ft (alone): 3.8% Ft (food): 3.2% Ft (50 mg Fe): 0.6%
Ferritin Fe is poorly absorbed and not useful as source of pharmaceutical iron
Murray-Kolb et al., 2003
18 women, 19-23 y (marginally iron deficient)
Intrinsically labeled 55Fe as FeSO4
(3mg Fe) or SB muffins (3 mg Fe) or soup (4.5 mg Fe)
(49% of 55Fe in ferritin)
Soybean (SB) soup and muffins
RBC FeSO4: 61%
SB: 27%
Soybeans are good source of Fe
Davila-Hicks et al., 2004
30 women (nonanemic)
1 mg 59Fe as FeSO4 or extrinsically
labeled purified horse spleen ferritin reconstituted with PO4
Breakfast meal Whole Body, RBC FeSO4: 19%, 39%
Ferritin: 22%, 28%
Fe from ferritin is as bioavailable as Fe from FeSO4
Lonnerdal et al., 2006
16 women (nonanemic)
1 mg 59Fe as FeSO4 or extrinsically
labeled purified soybean ferritin reconstituted with PO4
Breakfast meal- bagel, cream cheese, apple juice
Whole Body, RBC FeSO4: 34%, 35%
Ferritin: 30%, 33%
3
[image:40.612.75.729.99.320.2]2
Table 2.6. continued
Study Subjects Iron Form and Dose Food Matrix Absorption General Conclusions Caco-2 Cells
Kalgaonkar and Lonnerdal, 2008
Human intestinal Caco-2 cells
Horse spleen ferritin (ft) intact or digested in vitro (pH 2 or pH 4), extrinsically labeled with 59Fe as FeSO4
None pmol/µg cell protein FeSO4: 0.58
Ft (intact): 0.41 Ft (pH 4): 0.92 Ft (pH 2): 5.44 FeSO4 + phytate:
11% ↓absorption Ft (intact) + phytate: no effect
Ft (pH 2) + phytate: 35% ↓ absorption
Ferritin is digested and ferritin Fe absorption is inhibited by phytate
Bejjani et al., 2007
Human intestinal Caco-2 cells
Purified pea seed ferritin digested in vitro (pH 2), Fe measured using bathophenonthroline method
None ng/mg protein
FeSO4: 19.3
Ft (pH 2): 13.9 Ft (pH 2) + phytate: 4.45
Ferritin Fe absorption is inhibited by phytate
PHYTOFERRITIN
Ferritin Structure
Ferritin is a large (540-600 kDa) multi-subunit globular protein found in most
organisms including plants, animals, and bacteria that serves as the primary storage site for
iron. It consists of 24 peptide subunits (~28 kDa each), arranged into four helix bundles that
form a hollow spherical shell (Figure 2.6) and an iron core with the capacity to store up to
4,500 iron atoms (Harrison and Arosio, 1996). The ferritin secondary and quaternary
structures are highly conserved, but gene organization varies depending on the main function
of ferritin. The amino acid sequences of plant and animal ferritins are about 39-49%
identical (Andrews et al., 1992). Phytoferritins also have an extra peptide sequence at the
amino terminus of each protein subunit compared to animal ferritins. The first part of this
plant-specific sequence is the transit peptide, which is responsible for ferritin localization
into cell plastids. The extension peptide makes up the second part of this sequence, and is
believed to play a role in ferritin stability (Van Wuytswinkel et al., 1995) and possibly the
molecular assembly of ferritin (Proudhon et al., 1989).
[image:41.612.96.538.535.672.2]Ferritin subunits are generally categorized into two groups, either H- or L- (heart and
liver or heavy and light) subunits, depending on their size, amino acid composition, surface
charge, and immunoreactivity (Arioso et al., 1978). H-subunits are generally responsible for
the uptake and rapid oxidation of Fe (II) and L-subunits play a role in core formation;
together their functions are complementary (Van Wuytswinkel et al., 1995). The H- and
L-ferritin subunits vary with cell type, species, and even physiological condition and may
partially account for differences in the whole ferritin structure. In general, phytoferritins
sequences are H/L-chain heteropolymers; for example, pea seed ferritins were reported to
contain approximately 49% H-subunits and 40% L-subunits (Harrison and Arioso, 1996).
Role of Phytoferritin
As the primary storage protein for iron, ferritins play a major role in maintaining
cellular iron homeostasis. Iron is important in plants for electron transfer reactions in
respiration and photosynthesis, it is a cofactor for enzymes required for DNA synthesis, and
involved in nitrogen-fixation pathways (Liu and Theil, 2004). However, in the presence of
oxygen, free iron in the cell can produce free radicals by the Fenton reaction that can lead to
cell damage via lipid peroxidation, protein oxidation, or DNA damage (Briat and Lebrun,
1999). Therefore, the storage of iron in ferritin also serves to protect the cells from oxidative
damage from free iron.
To store excess iron in the cell, ferritin takes up iron in the form of Fe (II) via gated
pores or channels at the junctions of H-chain subunits. The Fe (II) ions are subsequently
oxidized at ferroxidase sites in the ferritin core for storage as Fe (III) oxyhydroxide crystals
Molecular oxygen in the iron core serves as an electron acceptor to bind the iron atoms in
ferroxidase reactions (Equations 1, 2) for the oxidation of ferrous ions into ferric
oxyhydroxide and ultimately, the uptake into the protein cavity (Equation 4) (Liu and Theil,
2005).
Phosphate groups are also found in the crystalline arrangement mostly associated
with the iron on the perimeter of the iron core, which are believed to help bind Fe (II) to the
iron core (Cheng and Chasteen, 1991; Hequing et al., 1993) and improve the thermodynamic
stability of the core (Watt et al., 1985). Phytoferritins have been found to have higher
concentrations of phosphate in the iron core than animal ferritins, whereby the phosphate
concentration in the core is believed to be a reflection of the composition of phosphate in the
cell (Waldo et al., 1995).
When there is a demand for iron in the cell, it can be released from ferritin in a
controlled manner through the unfolding of gated pores or more commonly through the
lysosomal degradation of ferritin (Kidane et al., 2006). Iron (III) is subsequently reduced by
various reductants to Fe (II) and becomes soluble in the presence of chelators (Dognin and
Regulation of Phytoferritin Synthesis
Phytoferritin synthesis is regulated by the iron status of the cells, where phytoferritin
is constantly being degraded and resynthesized to provide an available intracellular iron pool
or a means of storage when excess iron is in the cell (Briat et al., 1995). The mechanism of
ferritin synthesis regulation is quite different for plants and animals (Table 2.7). The
expression of ferritin in animals is mostly coordinated and regulated by cellular iron, which
influences IRP and IRE in ferritin mRNAs for the translational control of ferritin expression.
However, there is no translational control of phytoferritins, which do not even have a 5’-IRE
on the mRNA sequence (Lescure et al., 1991). Rather, control is at the transcriptional level,
whereby phytoferritins genes are induced to accumulate mRNAs in response to iron overload
[image:44.612.83.546.440.544.2]and are repressed by ID (Briat et al., 1999).
Table 2.7. Comparison of the genetic target and signals that regulate ferritin synthesis in plants, animals, and bacteria. From Hintze and Theil (2006).
Protein Location* Gene regulation Signals
Animals Cytoplasm, Mitochondria Transcriptional,
Translational
Fe, O2, H2O2
Plants Plastid Transcriptional Fe3+(Cit)6 or
Fe3+ + ascorbate
Bacteria Cytoplasm, DNA complex Transcriptional Stress, Starvation
*All cells, varied with development/environment
It is believed that an increase of the iron storage capacity in plant cells may serve to
signal or promote iron uptake into cells and sequester excess iron that flows into the cells
(Van Wuytsuwinkel et al., 1999; Yoshihara et al., 2003). This relationship between iron and
ferritin content has been investigated by over-expressing ferritin in transgenic crops. Goto et
ferritin cDNA and observed a positive correlation between iron and ferritin content. Goto et
al. (2000) later produced transgenic lettuce with high expression of ferritin and observed a
1.2-1.7 fold increase of iron content and enhanced growth of the plant, which further
endorsed the breeding of high iron crops through the introduction of a ferritin gene.
Conversely, Qing et al. (2005) developed two ferritin hyper-expressing transgenic rice lines
and observed little correlation between ferritin expression and iron concentrations in seeds.
Apparently, the expression of a ferritin gene in plants has the capacity to increase the iron
content in plants; however, iron accumulation may be limited by the plant’s ability to take up
or transport iron, which may be affected by soil and genotype (Moraghan et al., 2002).
Iron and Ferritin Accumulation in Plants
When iron is transported into a plant, it is immediately chelated to prevent the
production of oxygen radicals that cause damage to the cells. The primary chelator for free
iron in plants is nicotianamine (NA), which is present in all tissues of higher plants (Scholz et
al., 1992). It is also thought that NA may play a role in the transport of iron between and
within cells. Although NA is the initial iron chelator, the main destination of iron is for
functional purposes: as a cofactor for proteins with enzymatic functions, for iron-sulfur
clusters and heme. And in the case of iron overload, it is stored as ferritin or iron precipitates
Figure 2.7. Role of nicotianamine (NA) as an iron chelator in the plant cell. From Hell and Stephan (2003).
Excess free iron in the cell induces phytoferritin synthesis (Briat et al., 1999).
Phytoferritins are primarily found in plastids and seem to accumulate in developing tissues
where there is generally a high demand for iron (Seckback, 1982). In young plants, ferritins
are concentrated in roots and leaves to provide iron primarily for proteins involved in
nitrogen fixation or photosynthesis (Lobreaux and Briat, 1991). As the plant matures,
ferritins become concentrated in the seeds to provide an iron source for seed germination.
After germination, ferritin is degraded for the release of iron; this is marked by the shortening
of the 28 kDa subunits to 26.5 and 25 kDa polypeptides (Lobreaux and Briat, 1991).