promoting access to White Rose research papers
Universities of Leeds, Sheffield and York
http://eprints.whiterose.ac.uk/
This is an author produced version of a paper published in Engineering
Fracture Mechanics.
White Rose Research Online URL for this paper: http://eprints.whiterose.ac.uk/3714/
Published paper
Yates, J.R., Zanganeh, M., Tomlinson, R.A., Brown, M.W. and Diaz Garrido, F.A.
(2008) Crack paths under mixed mode loading. Engineering Fracture Mechanics,
Crack paths under mixed mode loading
J.R Yates1, M. Zanganeh2, R.A. Tomlinson3, M.W. Brown4 and F.A. Diaz Garrido5
1[email protected], Department of Mechanical Engineering, The University of
Sheffield, S1 3JD, UK
5[email protected],Departamento de Ingeniería Mecánica y Minera, Universidad de Jaen,
Spain.
ABSTRACT.
Long fatigue cracks that initially experience mixed mode displacements usually change
direction in response to cyclic elastic stresses. Eventually the cracks tend to orient
themselves into a pure mode I condition, but the path that they take can be complex and
chaotic. In this paper we report on recent developments in techniques for tracking the
crack path as it grows and evaluating the strength of the mixed mode crack tip stress
field.
KEYWORDS
Fatigue crack growth, thermoelastic stress analysis, stress intensity factor, interacting
INTRODUCTION
There are many opportunities for cracks and crack-like defects in engineering structures
to exist in orientations that induce mixed mode crack tip displacements. Defects arising
from fabrication processes such as welding or casting; cracks created under the action of
residual tensile stresses; cracking of embrittled microstructures; and fatigue cracks that
have grown under the action of some previously applied loading cycles that differ from
the current load case can all create flaws with some arbitrary combination of mode I, II
and III stress intensities.
In this paper we present the results of experiments using thermoelastic stress analysis
to study interacting mode I cracks. We also compare the cyclic stress intensity factors
obtained from these experiments with numerical simulations using finite element
analysis packages.
Broberg [1] discussed aspects of the stability of the crack path under pure and mixed
mode loads and concluded that crack paths remain straight under homogeneous remote
stress fields. However, engineering structures in service rarely experience such well
defined uniform stress fields. Stress and strain gradients arising from geometric
features, multiple cracks and non-uniform, non-proportional remote loads commonly
occur.
Applied mixed mode loading and interaction between multiple cracks are the
microstructures can also lead to significant changes in crack orientation but more often
are responsible for local deviations, or ‘zigzags’, in the overall mode I crack trajectory.
Broberg also noted that the ideal mode I elastic crack tip stress field did not provide a
sufficient condition for cracks to maintain a straight path. It was proposed, from the
work of Rice et al. [2] and Anderson [3], that it is the plastic flow at the crack tip that
dictates the crack path. The notion that the crack path is governed by the plastic
behaviour of the crack tip is supported by many workers. Under mode III loading, the
propensity for flat, or shear, mode growth is strongly influenced by the plastic part of
the crack tip displacement. Plumbridge [4] performed experiments on aluminium plates
cyclically loaded under Mode III loading conditions. It was observed that when the
crack tip plastic zone is large in comparison with the plate thickness crack extension
proceeds by a valid Mode III mechanism. When the crack tip plasticity is small and
restricted to planes of maximum shear there is a strong component of Mode I cracking
which results in delamination in the direction of macroscopic growth. In torsional
fatigue, the extent of crack tip plasticity plays an important role in governing whether
the crack path is flat or faceted [5, 6]. Extensive crack tip plasticity will encourage the
formation of a flat, shear mode fracture surface over the faceted, or ‘factory roof’,
surface observed under essentially linear elastic conditions.
The shape of the plastic zone under pure mode III conditions differs substantially
from the shape ahead of a mode I crack. In mode III, the plastic zone is essentially
circular and extends some four to six times further ahead of the crack than the
stress intensity factor. The centre of the circular plastic zone lies somewhere between
the tip of the crack and one radius distance ahead, depending on the work hardening
coefficient [7-10].
Furthermore, the extent of crack tip plasticity in torsional loading, and hence the
prevalence of flat mode growth, is also dependent upon the size of the cylindrical
component [11,12]; small diameter shafts being more prone to flat crack growth than
large shafts for the same stress, or strain, intensity factor. In these cases, a large ratio of
the applied torque to the plastic collapse limit torque of the shaft, as would occur in a
small diameter shaft, extends the crack tip plasticity beyond that expected for the level
of strain intensity factor applied.
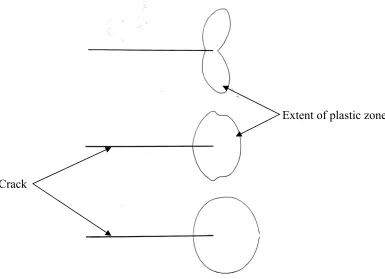
Under mixed mode I+III, an increasing mode III contribution is known to lead to an
increase in the concentration of the plastic strain in the trajectory of the crack [13] as the
plastic zone changes from the twin lobed mode I shape to the circular mode III
configuration, as shown in Figure 1 [14].
The shear versus branch crack competition is probably most apparent under
sequential cyclic mode I and mode II loads, as experienced in cracked railway lines.
The evidence for the role of the crack tip plasticity in preventing the crack from
branching into the pure mode I trajectory in this case is overwhelming [15].
The path of a fatigue crack under proportional loading from an initially mixed mode
condition, as created by angled or inclined cracks in laboratory specimens, is
surprisingly stable. One might expect major variations, as a function of mean stress for
differences in the crack trajectory in specimens under identical test conditions. These
small scale fluctuations in crack path are worthy of detailed investigation but, until
recently, experimental techniques to evaluate the strength of mixed mode crack field
have not been precise or reliable enough to yield useful information.
Understanding the behaviour of mixed mode cracks in general, and the path of such
cracks in particular, requires a combination of high quality experimental data and
observations as well as robust physically based models. Good data on the crack tip
stress state, crack closure and contact, and the crack trajectory is hard to obtain and
there has been much recent work in this area.
In this paper, we set out to report on some recent developments in gathering
experimental data on mixed mode stress and displacement fields. We also consider how
such techniques might provide an opportunity to investigate issues surrounding the
stability of crack paths in varying stress fields.
OVERVIEW OF FULL FIELD TECHNIQUES FOR CRACK ANALYSIS
Photoelasticity, moiré interferometry, electronic speckle pattern interferometry (ESPI),
image correlation and thermoelasticity, or differential thermography, are all techniques
which provide full field experimental data on crack tip displacements or strains. From
these data, crack tip stresses can be inferred and hence stress intensity factors derived.
With the advent of advanced computing power and digital image processing, techniques
methods where fringe orders must be identified and located by an experienced operator,
to those where stress intensity factors may be determined in a matter of minutes.
Fracture mechanics studies using transmission photoelasticity require fine slits to be
introduced into epoxy models of engineering components [16, 17]. Several methods
have been developed to determine KI and KII using the full field of data surrounding the
slit tip [18, 19]. Nurse and Patterson [16] also developed a photoelastic method to
predict the direction of crack growth using the theory that long cracks usually grow
under mode I loading in direction perpendicular to maximum tangential stress. They
found that when KII/KI is less than 0.7, this direction is approximately equivalent to the
axis of symmetry observed in the isochromatic fringes loops and so one can predict the
direction of crack growth. This method was further developed by Burguete and
Patterson [20] to investigate the effect of friction on crack propagation in the dovetail
fixings of gas turbine compressor discs.
Nurse and Patterson [21] used reflection photoelasticity to study a fatigue crack in an
aluminium alloy using a stroboscopic light source over the complete load cycle.
However the drawback to this method is the fact that the birefringent coating must not
cover the crack and thus the crack growth direction must be predicted before applying
the coating. Further investigations of fatigue crack closure were made by Pacey et al.
[22], using transmission photoelasticity through a polycarbonate specimen, which is
known to undergo stable fatigue crack growth. A method to evaluate mixed mode stress
intensity factors was developed based on the Muskhelishvili stress field formulation
optimisation procedure was found to offer a significant advance in the ability to
characterise the behaviour of fatigue cracks with plasticity induced crack closure.
Similar studies on mixed mode fatigue crack propagation have been carried out using
geometric moiré [23] and moiré interferometry [24]. Moiré methods are particularly
useful when making high temperature measurements [25]. Moiré interferometry
involves bonding a fine grating ahead of the crack tip. In the past these tended to
debond due to the high strain gradients in that area, but the recent development of
photoresist methods allows the production of well-adhered gratings of 0.75µm thickness
[26]. It now means that fatigue cracks can grow through the grating and allow detailed
crack closure investigations to be carried out [27].
When studying fatigue crack propagation it is desirable to be able to evaluate the
stress intensity factor range of the growing crack. To do so, the techniques based on
photoelasticity and interferometry require data to be collected at maximum and
minimum load. This can be done in several ways. Firstly, the cycling can be stopped at
the required loads and data taken under static conditions. Alternatively, the component
can be illuminated by a stroboscopic light synchronised with some part of the fatigue
cycle. The development of modern high speed digital video cameras means that data
can be collected at several points in the loading cycle and the changing stress field
determined throughout the cycle.
Differential thermography, or Thermoelastic Stress Analysis (TSA), has proved to be
an invaluable tool to explore the crack tip strain field during fatigue loading [28-31].
cyclic temperature variation occurs on its surface which is directly proportional to the
first strain invariant. In thermoelastic stress analysis, this temperature variation is
measured using very sensitive infra-red detectors and processed to provide a map of the
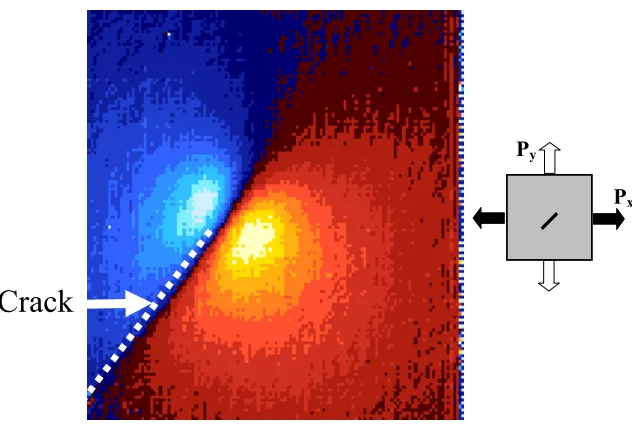
surface stress distribution. When the mixed mode stress field around a fatigue crack is
examined, see Figure 2, the temperature data from the elastic field around the crack tip
can be used to evaluate the range of both ∆KI and ∆KII. A number of methodologies for
calculating the stress intensity factor are available and have been reviewed by
Tomlinson and Olden [32] in 1999. More recently, developments have focussed on
greater accuracy in the determination of mixed-mode stress intensity factors [33-35].
Historically, analysis of the data required knowledge of the location of the crack tip
and an initial estimate of the stress intensity factor. Further developments of the TSA
technique [36, 37] provided a means of both tracking the location of the crack tip during
propagation under cyclic loading and determining the stress intensity factor range a
priori. Figure 3 shows the tracking of a crack growing from a 45º notch under tensile
loading.
Extracting the elastic stresses from around the growing crack tip provides a good
estimate of, what is often called, the effective stress intensity factor range. In reality,
this is the true stress field experienced by the crack, rather than the nominal, or applied
∆K. Thermoelastic stress analysis, therefore, provides a method for estimating the
crack closure levels directly.
In the last few years, Electronic Speckle Pattern Interferometry (ESPI) and image
et al. [38] developed the method used in photoelasticity by Nurse and Patterson [19] to
accurately determine mixed-mode stress intensity factors using full field ESPI and
image correlation data. An advantage of these techniques is that minimal specimen
preparation is required, only using the painted or abraded surface of the component,
unlike reflection photoelasticity and moiré where a coating or grating has to be bonded
to the surface. The latest developments [39] in image correlation can provide
information on the crack position and the crack tip displacement field.
EXPERIMENTAL PROCEDURE
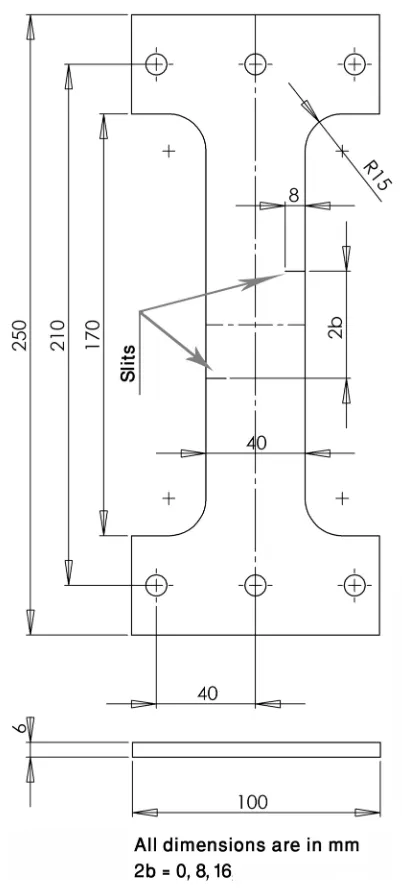
Offset double edge slit fatigue specimens (Figure 4) were used to explore the
trajectory and crack tip stress states of a pair of interacting fatigue cracks. Specimens
6 mm thick, 40 mm wide and 250 mm long were machined from a plate of 7010 T7651
aluminium alloy. Two slits, each 8 mm long and on opposite sides of the specimens,
were electric discharge machined using 0.3 mm diameter wire. The vertical offset
between the two slits were chosen to be 0, 8, 16, 32 and 48 mm for the series of tests
conducted. One face of each specimen was painted with a thin coat of matt black paint
(RS type 496-782) to provide a surface of uniform and known emissivity. A single
rosette strain gauge (Tokyo Sokki Kenkyujo Co., 1 mm, 120 ± 0.5 Ω) was bonded to the
specimen in a region of uniform and known elastic stress to provide a calibration for the
thermoelastic data.[29]
Specimens were loaded through two pins located 210 mm apart. Fatigue tests were
load of 14.4 kN for the 0 and 8 mm offset specimens and a range of 3.5 kN and a mean
load of 8.5 kN for the remaining three specimens. The load range was reduced since
considerable plasticity was observed in the first two tests. The frequency was chosen to
be sufficiently high for adiabatic conditions to be attained in the material ahead of the
crack tip. By doing so, we ensured that the thermoelastic signal contains information
about the sum of the elastic principal stresses from which the mode I and mode II stress
intensity factor ranges can be evaluated.
A Deltatherm 1550 instrument manufactured by Stress Photonics Inc. was used to
gather thermoelastic data from the matt black surface. The crack tip position and the
mode I and mode II stress intensity factor ranges occurring in the specimen were
evaluated using the FATCAT software [40].
The FRANC2DL finite element package [41] was used to predict the likely path of
the cracks for each of the offset conditions. The stress intensity factor can be
determined using the J integral method, the displacement correlation technique and the
modified crack closure technique in FRANC2DL. Also, to predict the crack path three
different criteria can be applied. Those are the maximum tangential stress, the maximum
energy density factor and the minimum energy release rate criterion. The predicted
trajectory varies slightly according to the method used in the calculation of stress
intensity factors and the crack turning criterion chosen. Although there are no major
discrepancies, there are small differences in the crack paths predicted, especially in the
maximum tangential stress turning criterion and displacement correlation was used to
evaluate the stress intensity factors.
RESULTS AND DISCUSSION
A qualitative comparison between the thermoelastic and finite element data is made
in Figure 5. The experimental crack paths are very similar to those predicted by the
finite element method. This is relatively surprising since the numerical simulations
assume that both the left and right hand cracks start growing at the same time. In
practice, the creation of a growing fatigue crack from the tip of the spark machine slit
takes a different number of cycles in every case, and the cracks do not grow
symmetrically as can be observed in the thermoelastic data from the 0 mm offset in
Figure 5.
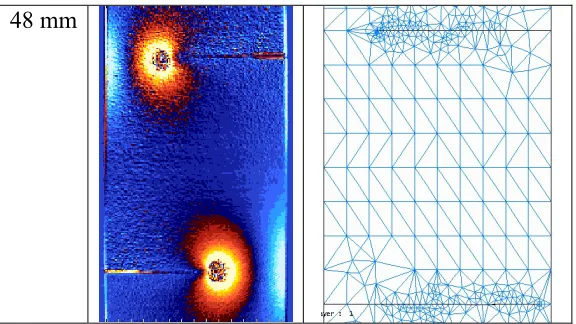
Quantitative comparisons are made in Figures 6 and 7. The crack tip positions
throughout the tests were located from the thermoelastic data and compared with the
positions predicted by the FRANC2DL finite element package for offsets of 0, 16 and
48 mm respectively in Figure 6.
The values of ∆KI derived from the FRANC2DL analysis, Figure 7, are broadly
consistent with the experimental results. The best agreement is for the dominant crack;
that is the one that started first and grew faster. The second crack tended to have a
lower stress intensity range than predicted from the numerical modelling.
In the early stages of crack growth the cracks followed the path where the mode II stress
where a significant mode II stress intensity factor is noticeable. It is exactly in these
regions where the deviation of the predicted crack paths from the experimental crack
path is observed.
As can be observed in the TSA image in Figure 9(a) there are regions on the crack
flanks where non-uniform stresses appear, which could be due to contact between the
crack faces. Therefore the possibility of crack face contact and the extent of plasticity at
the crack tip were explored using non-linear finite element analysis. An elastic plastic
finite element model was developed in ANSYS® [42] which reproduced the crack path
observed experimentally. A fine mesh using 8 node elements was used to model the
region ahead of crack tip and a bihardening model was used for material behaviour
modelling. In Figure 9(b) are presented the sum of principal strains in the specimen
obtained from FE analysis. As is well known, the sum of principal strains is
proportional to the thermoelastic signal. By comparing the two Figures 9(a) and 9(b) it
can be seen that the results from the finite element analysis show a very similar pattern
of dilatational strain, particularly in areas along the crack flanks. Since the numerical
model showed that there was no contact between the crack faces, it is concluded that the
strains, and hence stresses, observed on the crack flanks were due to bending of the
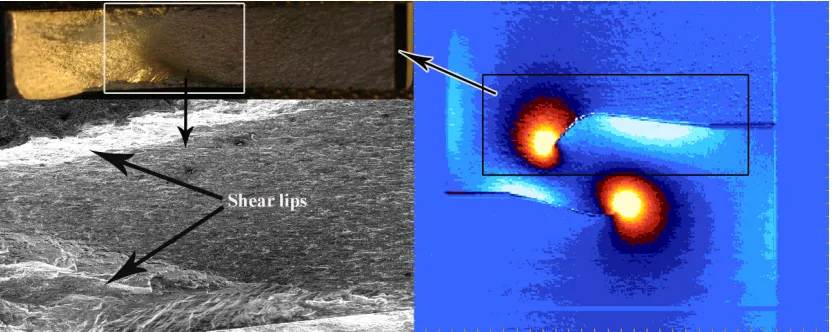
ligament of material between the two cracks. Examination of the fracture surface,
Figure 10, does not show any evidence of crack face contact or rubbing and confirms
this conclusion.
Although the sum of the principal strains in both images in Figure 9 are similar in the
twisted from the crack plane more than is observed in the FE analysis. This was
investigated by observing the fracture surfaces as it was suspected to be due to crack
tunnelling. When the fracture surface was examined, shear lips were observed at the end
of crack growth (Figure 10) which indicated a transition from tensile to shear fracture in
the region where the plastic strains increase significantly. These coincide exactly with
the point where the crack path deviated from the modelling predictions and where the
high values of ∆KII were observed. It is recognised that three-dimensional modelling
would provide further insight into the crack propagation and work has begun using this
approach. The fact that only surface data may be recorded is a limitation of the
thermoelastic technique, but no other non-destructive techniques can monitor the
internal crack front as it propagates. Modern thermoelastic apparatus used here allows
data collection in near real time, which offers the potential of using experimental and
numerical techniques together from which valuable information can be obtained. From
these experiments it appears that the elastic stress field, as characterised by the stress
intensity factor, may be only partially controlling the crack path. If Broberg’s assertion
is correct, and it is the directionality of the plastic strain field that governs the crack
path, then we should be seeking ways of measuring plastic strains directly. It is
suggested that the latest developments in image correlation techniques [39] and
differential thermography may provide a route to quantitative evaluation of the
non-linear strains fields around a crack tip and hence offer some further insight into the
CONCLUSIONS
Recent developments in experimental mechanics offer an opportunity to explore the
hypothesis that the direction of fatigue cracks may be governed more strongly by
directionality of crack tip plasticity rather than by the magnitude of the elastic stress
field alone.
REFERENCES
[1] Broberg K.B., 1987. On crack paths. Engng Fracture Mech. 28, 663-679.
[2] Rice J.R., Drugan W.L., Sham T.L., 1980. Elastic plastic analysis of growing
cracks. In: Wheeler J.B. (Ed.), ASTM STP 700, Fracture Mech. ASTM, 1980. pp.
189-221.
[3] Andersson H., 1977. Analysis of a model for void growth and coalescence ahead of
a moving crack tip. J Mech Phys Solids 25, 217-233.
[4] Plumbridge W.J., 1985. Fatigue crack growth in plate specimens under Mode III
loading. J Mater Sci. 20, 1015-1026.
[5] Hay E., Brown M.W., 1986. Initiation and early crack growth of fatigue cracks
from a circumferential notch loaded in torsion. In: Miller K.J., de los Rios E.R.
(Eds), The Behaviour of Short Fatigue Cracks. MEP Ltd. London, 1986. pp.
[6] Nayeb-Hashemi H., McClintock F.A., Ritchie R.O., 1982. Effects of friction and
high torque on fatigue crack propagation in mode III. Met Trans A. 13A,
2197-2204.
[7] Rice J.R., 1967. Stresses due to a sharp notch in a work-hardening elastic plastic
material loaded by longitudinal shear. J. App. Mech. 34, 287-298.
[8] Weertman J., 1989. Mode III crack tip plastic zone solution for work hardening
solid using dislocation motion. J. App. Mech. 56, 976-977.
[9] Weertman J., 1991. Complete crack-tip shielding of the Mode III crack in a work
hardening solid. J. App. Mech. 58, 1107-1108.
[10]Zacharopoulos N., Srolovitz D., LeSar R., 2003. Discrete dislocation simulations of
the development of a continuum plastic zone ahead of a stationary mode III crack.
J. Mech. Phys. Solids 51, 695-713.
[11]Tschegg E.K., 1983. Mode III and mode I fatigue crack propagation behaviour
under torsional loading. J Mater Sci. 18, 1604-1614.
[12]Yates J.R., 1987. Crack tip plastic zone sizes in cylindrical bars subjected to
torsion. Fatigue Fract Engng Mater Struct.10, 471-477.
[13]Kamat S.V., Srinivas M., 2001. Effect of mixed mode I/III loading on plastic zone
in Armco Iron. Materials Science and Technology 17, 1163-1165.
[14]Yates J.R., 1987. Fatigue under combined torsion and bending loads. PhD thesis,
University of Sheffield, UK.
[15]Bold P.E., Brown M.W., Allen R.J., 1991. Shear mode crack growth and rolling
[16]Nurse A.D., Patterson E.A., 1993. Experimental determination of stress intensity
factors for cracks in turbine discs. Fatigue Fract. Engng Mater. Struct. 16, 315-325.
[17]Hobbs J., Burguete R., Heyes P., Patterson E.A., 2001. A photoelastic analysis of
crescent-shapes cracks in bolts. J. Strain Anal. Engng Design 36, 93-99.
[18]Paris F., Picon R., Marin J., Canas J., 1996. Photoelastic determination of KI and
KII: a numerical study on experimental data. Exp. Mech. 37, 45-55.
[19]Nurse A.D., Patterson E.A., 1993. Determination predominantly Mode II stress
intensity factors from isochromatic data. Fatigue Fract. Engng Mater. Struct. 16,
1339-1354.
[20]Burguete R.L., Patterson E.A., 1998. The effect of friction on crack propagation in
the dovetail fixings of compressor discs. Proc. I .Mech. E., Part C 212, 171-181.
[21]Nurse A.D., Patterson E.A., 1994. Photoelastic measurement of stress intensity
factors during a complete fatigue cycle. In: Gomes S. (Ed.), Recent Adv. Exp.
Mech., Taylor and Francis, 1994. pp. 195-199
[22]Pacey M.N., James M.N., Patterson E.A., 2005. A new photoelastic model for
studying fatigue crack closure. Exp. Mech. 45, 42-52.
[23]Han M.K., Carlsen C.A., Ramulu M., 2005. Mixed mode fatigue crack propagation
in 7075 T6 aluminium sheet material. In: Advances in Fracture and Strength. Parts
1-4. Key Engineering Materials 297-300, 2005, pp. 1565-1571
[24]Kokaly M.T., Lee J., Kobayashi A.S., 2003. Moiré interferometry for dynamic
[25]Tran D.K., Kobayashi A.S., White K.W., 2001. Crack growth in alumina at high
temperature. Engng Fract. Mech. 68, 149-161.
[26]Fellows L.J., Gungor S., 1998. Fabrication of photoresit diffraction gratings on
Ti6Al4V beam specimens for use in moiré interferometry. Meas. Sci. Tech. 9,
1963-1968.
[27]Fellows L.J., Nowell D., 2005. Measurement of Crack closure after the application
of an overload cycle using moiré interferometry.Int. J. Fatigue 27, 1453-1462.
[28]Lesniak J.R., Bazile D.J., Boyce B.R., Zickel M.J., Cramer K.E., Welch C.S., 1996.
Stress intensity measurement via infra-red focal plane array. In: ASTM STP 1318,
ASTM, 1996. pp. 208-220
[29]Tomlinson R.A., Nurse A.D., Patterson E.A., 1997. On determining stress intensity
factors for mixed-mode cracks from thermoelastic data. Fatigue Fract. Engng
Mater. Struct. 20, 217-226.
[30]Lin S.T., Feng Z., Rowlands R.E., 1997. Thermoelastic determination of stress
intensity factors in orthotropic composites using the J-integral. Engng Fract. Mech.
56, 579-592.
[31]Fulton M.C., Dulieu-Barton J.M., Stanley P., 1998. Improved evaluation of stress
intensity factors from SPATE data. In: Allison I.M. (Ed.), Proc. 11th Int. Conf. Exp.
Mech., Netherlands, 1998, pp. 1211-1216
[32]Tomlinson R.A., Olden E.J., 1999. Thermoelasticity for the analysis of crack tip
[33]Marsavina L., Tomlinson R.A., 2004. Thermoelastic investigations for fatigue life
assessment. Exp. Mech. 44, 487-494.
[34]Dulieu-Barton J.M., Worden K., 2003. Genetic identification of crack-tip
parameters using thermoelastic isopachics. Measurement Science and Technology
14, 176-183 and erratum 1845.
[35]Diaz F.A., Patterson E.A., Tomlinson R.A., Yates J.R., 2004. Measuring stress
intensity factors during fatigue crack growth using thermoelasticity. Fatigue Fract.
Engng Mater. Struct. 27, 571-584.
[36]Diaz F.A., Yates J.R., Patterson E.A., 2004. Some improvements in the analysis of
fatigue cracks using thermoelasticity. Int. J. Fatigue 6, 365-376.
[37]Diaz F.A., Patterson E.A., Yates J.R., 2005. Differential thermography reveals
crack tip behaviour. In: Proc. 2005 SEM Annual Conf. on Exp. App. Mech.,
Society for Experimental Mechanics, 2005, pp. 1413-1418
[38]Shterenlikht A., Diaz Garrido F.A., Lopez Crespo P., Withers P.J., Patterson E.A.,
2004. Mixed Mode (KI + KII) Stress intensity factor measurement by Electronic
Speckle Pattern Interferometry and Image Correlation. In: Proc BSSM Int. Conf.
on Adv. Exp. Mech.,BSSM, 2004. CD Rom
[39]López-Crespo P., Shterenlikht A., Yates J.R., Patterson E.A. and Withers P.J.,
2006. Crack monitoring around a hole under mixed mode (I+II) loading by image
[40]Diaz Garrido F.A., 2004. Development of a methodology for thermoelastic
investigation of the effective stress intensity factor. PhD thesis, University of
Sheffield, UK.
[41]James M., Swenson D., FRacture ANalysis Code 2-D/Layered
http://www.mne.ksu.edu/~franc2d
Extent of plastic zone
[image:21.595.126.511.167.446.2]Crack
Figure 1. Changes in plastic zone shape from pure mode I (top), through KI/KIII= 1.5
Py
Px
[image:22.595.160.476.136.349.2]Crack
Figure 2. Typical map of thermoelastic signal around a mixed mode I+II crack tip
under biaxial load, applied ∆KII/∆KI = 2, from [40]. The signal is directly proportional
0 1 2 3 4 5 6
4 8 12 16
Crack length (m m)
[image:23.595.148.448.140.384.2]V e rt ic al d is tan ce f ro m th e not ch ( m m )
Figure 3. Tracking of a crack during fatigue cycling of a ferritic steel using differential
0 mm
8 mm
16 mm
48 mm
Figure 5 (top) Crack tip stress field using thermoelasticity recorded towards the end of crack growth , (bottom) final predicted paths of interacting cracks using the FRANC2DL finite element package for five different crack vertical offsets of 0, 8, 16,
[image:26.595.155.443.111.273.2]-3 -2 -1 0 1 2 3
0 1 2 3 4 5 6 7 8 9 10
Crack length (mm)
V er tic al off set f rom c ra ck st ar tin g p o si tion ( m m )
TSA left crack TSA right crack FRANC2DL left crack FRANC2DL right crack
(a) -3 -2 -1 0 1 2 3
0 1 2 3 4 5 6 7 8 9 10 11 12 13 14
Crack length (mm)
V e rt ic al o ffs et fr om c rac k st ar tin g po si tio n ( m m )
TSA left crack TSA right crack FRANC2DL left crack FRANC2DL right crack
-3 -2 -1 0 1 2 3
0 1 2 3 4 5 6 7 8 9 10
Crack length (mm)
V e rt ic al of fs et fr om cr ack star tin g po int ( m m )
TSA left crack TSA right crack FRANC2DL left crack FRANC2DL right crack
[image:28.595.93.477.140.358.2](c)
Figure 6. Left and right fatigue crack path comparison using thermoelastic stress
analysis and finite element analysis (FRANC2DL). (a) 0 mm offset, (b) 16 mm offset,
-10 -5 0 5 10 15 20
0 1 2 3 4 5 6 7 8 9 10
Crack length (mm)
∆
KI
an
d
∆
KII
, M
P
a
m
0.5
TSA left crack mode I TSA right crack mode I
TSA left crack mode II TSA right crack mode II
FRANC2DL left crack mode I FRANC2DL right crack mode I
FRANC2DL left crack mode II FRANC2DL right crack mode II
-20 -10 0 10 20 30 40
0 1 2 3 4 5 6 7 8 9 10 11 12
Crack length (mm)
∆ KI an d ∆ KII , MP a m 0. 5
TSA left crack mode I TSA right crack mode I
TSA left crack mode II TSA right crack mode II
FRANC2D left crack mode I FRANC2DL right crack mode I
FRANC2DL left crack mode II FRANC2DL right crack mode II
(b) -20 -10 0 10 20 30 40
0 2 4 6 8 10 12 14 16 18 20
Crack length (mm)
∆ KI and ∆ KII , MPa m 0. 5
TSA left crack mode I TSA left crack mode II
TSA right crack mode I TSA right crack mode II
FRANC2DL left crack mode I FRANC2DL left crack mode II FRANC2DL right crack mode I FRANC2DL right crack mode II
Figure 7. Left and right stress intensity factors (∆KI and ∆KII) using thermoelastic stress
analysis and finite element analysis (FRANC2DL). (a) 0 mm offset, (b) 16 mm offset,
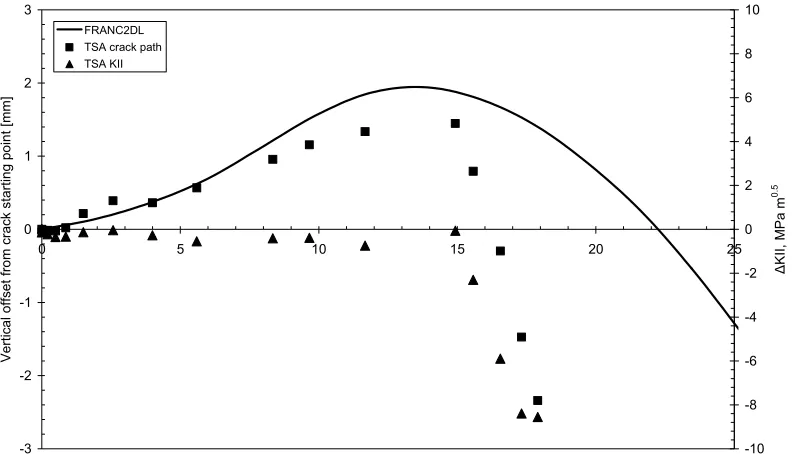
-3 -2 -1 0 1 2 3
0 5 10 15 20 25
Fatigue crack length [mm]
[image:32.595.103.499.153.380.2]Vert ic al of fs et f rom crack st art ing point [ m m ] -10 -8 -6 -4 -2 0 2 4 6 8 10 ∆ KI I, M P a m 0.5 FRANC2DL TSA crack path TSA KII
Figure 8. Fatigue crack path determined by FRANC2DL and TSA, as well as the mode
II stress intensity factor determined by FATCAT for a specimen with 8 mm offset
(a) (b)
Figure 9. (a) TSA image and (b) ABAQUS non-linear FE results for a specimen with 8
[image:33.595.109.510.126.261.2]