1
EVALUATION OF RED CELL DISTRIBUTION WIDTH IN HEART FAILURE PATIENTS
Dissertation submitted in partial fulfillment of requirements for
M.D. DEGREE IN GENERAL MEDICINE
BRANCH I
of
THE TAMILNADU Dr. M.G.R. MEDICAL UNIVERSITY, CHENNAI, INDIA.
MADRAS MEDICAL COLLEGE,
CHENNAI 600003
2
CERTIFICATE
This is to certify that the dissertation entitled “EVALUATION OF RED CELL DISTRIBUTION WIDTH IN HEART FAILURE
PATIENTS” is a bonafide work done by Dr. BARANI VELAN.S., at Madras Medical College, Chennai in partial fulfillment of the university rules and regulations for award of M.D., Degree in General Medicine (Branch-I) under my guidance and supervision during the academic year 2010 -2013.
Prof.E.DHANDAPANI M.D.,
Professor of Medicine, Guide & Research Supervisor,
Institute of Internal Medicine, Madras Medical College & Rajiv Gandhi Govt. General
Hospital, Chennai – 3.
Prof.N.RAGHU M.D.,
Director and Professor, Institute of Internal Medicine,
Madras Medical College & Rajiv Gandhi Govt. General
Hospital, Chennai – 3.
Prof.V.KANAGASABAI M.D.,
The Dean
Madras Medical College & Rajiv Gandhi Govt. General Hospital,
3
DECLARATION
I solemnly declare that this dissertation entitled “EVALUATION OF RED CELL DISTRIBUTION WIDTH IN HEART FAILURE
PATIENTS” was done by me at Madras Medical College and Rajiv Gandhi Government General Hospital, during 2010-2013 under the guidance and supervision of Prof.E.DHANDAPANI, M.D. This dissertation is submitted to the Tamil Nadu Dr.M.G.R. Medical University towards the partial fulfillment of requirements for the award of M.D. Degree in General Medicine (Branch-I).
Place: Chennai-3 Date:
4
ACKNOWLEDGEMENT
At the outset, I thank Prof.V.KANAGASABAI M.D., Dean, Madras Medical College and Rajiv Gandhi Government General Hospital, Chennai-3 for having permitted me to use hospital data for the study.
I am grateful to Prof.N.RAGHU, M.D., Director and Professor, Institute of Internal Medicine, Madras Medical College and Rajiv Gandhi Government General Hospital, Chennai-3.
I am indebted to Prof.E.DHANDAPANI, M.D., Professor of Medicine, Institute of Internal Medicine, Madras Medical College and Rajiv Gandhi Government General Hospital, Chennai-3 for his valuable guidance.
I am immensely thankful to Prof.C.MARGARET, M.D., D.M.,
Professor of Hematology, Department of Hematology, Madras Medical College and Rajiv Gandhi Government General Hospital, Chennai-3 for her valuable guidance.
I would like to thank Dr.K.THIRUMALVALAVAN,M.D., Dr.K.VIDHYA,M.D., Dr.A.SANTHI SELVI, M.D., Assistant Professors, Madras Medical College and Rajiv Gandhi Government General Hospital, Chennai-3 for their scrutiny.
5
I express my sincere gratitude to all the patients who participated in the study.
6
TABLE OF CONTENTS
1. INTRODUCTION 1
2. AIM OF THE STUDY 3
3. REVIEW OF LITERATURE 4
4. MATERIALS AND METHODS 54
5. OBSERVATIONS AND RESULTS 60
6. DISCUSSION 80
7. LIMITATIONS OF THE STUDY 86
8. CONCLUSION 87
9. BIBLIOGRAPHY 88
10. ANNEXURES
PROFORMA 97
ETHICAL COMMITTEE APPROVAL FORM 100
TURNITIN DIGITAL RECEIPT 101
ANTI-PLAGIARISM SCREENSHOT 102
7
ABBREVIATIONS/ACRONYMS
ACC/AHA American college of cardiology/American heart association
ANOVA One-way Analysis of Variance BNP Brain Natriuretic Peptide CAD Coronary artery disease CHF Chronic heart failure
COPD Chronic obstructive pulmonary disease CV Cardio vascular
DCM Dilated cardiomyopathy ECG Electrocardiogram ECHO Echocardiogram EDV End diastolic volume EF Ejection fraction
ESC European Society of Cardiology GFR Glomerular filtration rate
HDL High density lipoprotein HF Heart failure
HFNEF Heart failure with normal ejection fraction HFREF Heart failure with reduced ejection fraction
KG Kilogram
LDL Low density lipoprotein LV Left Ventricle
8 NO Nitric oxide
NYHA New York Heart Association RAA Renin-angiotensin-aldosterone RDW Red cell distribution width RHD Rheumatic heart disease SV Stroke volume
1
INTRODUCTION
Heart Failure is a condition when there is acquired/inherited abnormality in the function and/or structure of heart leading to signs and symptoms that require frequent admissions and lead to decreased life span and poor quality of life1. Ischemia remains the chief etiology for heart failure worldwide. Heart failure is the final common outcome in all pathologies of heart disease. It is associated with a lot of comorbidities and lethality across the globe.
Over the last decade, several biomarkers have emerged in heart medicine like uric acid, neurohormones, hsCRP , BNP and many other pro inflammatory cytokines which help in the diagnosis as well as prognosis of heart failure.
2
forth by many researchers for the cause for elevated RDW in the context of heart failure.
Januzzi and coworkers postulated from their research that RDW carries more prognostic information in addition to NT-pro BNP in acute heart failure. Few other studies also demonstrated that RDW is markedly elevated in severe heart failure independent of anemia and is a marker of worst prognosis. Hence RDW is clearly emerging as a new and promising biomarker in heart failure assessment, and candidacy for ventricular assist devices, IABPs, CRTs and transplantation.
3
AIM OF THE STUDY
To evaluate RDW in heart failure.
To correlate RDW with severity of heart failure(NYHA functional class and LV ejection fraction).
4
REVIEW OF LITERATURE
HISTORY OF HEART FAILURE:
MILESTONES
1628 William Harvey - circulation
1785 William Withering – cardiac glycosides
1920 Diuretics - introduced
1954 Imaging of heart- USG
1958 Thiazide diuretics
1967 Christiaan Barnard - 1st heart transplant
1987 CONSENSUS-I – use of ACE-I in heart failure
1995 ESC3- heart failure- guidelines for Rx
Accounts of heart failure antedates to ancient days. Understanding the natural history of heart failure has been phenomenal with significant evolutions from the day when Harvey described circulation. Inventions ranging from ECG, XRays, ECHO, cardiac catheterisation, newer biomarkers and nuclear medicine have succeeded in early diagnosis and effective treatment of heart failure patients around the globe.
5
transplantation have lead to the longevity of patients adding to the global burden of heart failure prevalence.
EPIDEMIOLOGY OF HEART FAILURE
Each year, new cases of congestive heart failure develop in about 550,000 patients. Nearly 1 million people get hospitalised for CHF yearly with 6.5 million hospital-days. Each year around 60,000 patients die of this condition.
Approximately one-third to one-half of the deaths in patients with CHF are secondary to the progression of cardiac insufficiency and its associated conditions. The remainder of the patients with CHF die of sudden cardiac death, presumably related to electrical instability and ventricular arrhythmias and other cardiovascular conditions as well as from noncardiovascular causes.
Data describing the natural history of CHF are limited due to lack of prospective studies4. The prevalence in in developed countries is 2.1%. Its prevalence increases with age, 10% suffering after they cross 65 years. It has a low incidence in women but 50% cases constitute females due to increased life span.
6
deteriorating condition, with 5 year mortality rate of 20–40% .Other studies show that patients with advanced CHF have 50% mortality.
Congestive heart failure is the inability of the heart to pump blood in par with the metabolic demands. It occurs either due to decreased myocardial contractility or an increased pressure or volume overload. Its haemodynamic consequences are diminished stroke volume (forward failure) and pooling back of blood (backward failure) alone or together.
DEFINITION:
A pathophysiologic state in which an abnormality of cardiac function is responsible for the failure of the heart to pump blood at a rate commensurate with the requirements of the metabolizing tissues.1
PHYSIOLOGY OF CARDIAC CONTRACTION
The force of contraction of the myocardium depends on
preload
afterload
inotropic state (contractility)
7
Preload:
According to the Frank-Starling law6, increasing the resting length of the myocardial fibre can increase the force of isometric contraction. In an intact ventricle, the length of the fibre can be increased by increasing the end-diastolic wall tension (preload). This in turn is achieved by increasing the end-diastolic volume of the ventricle. The beneficial effect of increasing fibre length is however limited. Beyond the point of optimal stretch, increase in preload causes a decline in the force of isometric contraction.
Afterload is defined as the tension or force which develops in the ventricular wall after the onset of shortening (systole).
8
loading condition, increased cardiac contractility will augment cardiac performance.
Increased frequency of cardiac contraction increases contractility. Its effects in the intact heart are however limited and with rapid heart rates, contractility may actually decrease because of limitations of coronary blood flow and encroachment on the diastolic filling period.
TYPES
Cardiac failure may be classified as follows:
Acute versus chronic failure
Acute heart failure develops after a massive myocardial infarction or valve rupture, whereas chronic heart failure is seen in slowly progressive valvular heart disease, dilated cardiomyopathy and systemic hypertension.
9
Left-sided versus right-sided failure
In left ventricular failure, there is pulmonary congestion resulting in dyspnoea and orthopnoea.
In right-sided failure, systemic congestion leads to raised jugular venous pressure, congestive hepatomegaly, and lower limb oedema.
In long- standing valvular heart disease (aortic and mitral valve) and hypertension, combined features of left and right ventricular failure (congestive heart failure) are present.
High-output failure
High-output failure is present in
1. severe anaemia 2. hyperthyroidism 3. beriberi
4. arterio-venous fistula 5. Paget’s disease
10
Forward versus backward failure
In backward heart failure the pressure and volume in the atrium and venous compartment are elevated, leading to retention of sodium and water and resulting in oedema.
In forward heart failure, clinical features are explained on the basis of inadequate output due to reduced left ventricular systolic function, resulting in diminished renal perfusion, which activates the renin-angiotensin-aldosterone system with resulting salt and water retention and oedema8.
Both mechanisms operate in varying proportions in a majority of patients with heart failure.
Systolic versus diastolic failure
Patients with systolic heart failure have predominant systolic ventricular dysfunction, mainly due to myocardial dysfunction. The common causes are
primary heart muscle abnormalities
1. dilated cardiomyopathy 2. ischaemic heart disease
11 1. systemic hypertension 2. valvular heart disease 3. congenital heart disease .
Disturbances of lusitropic function, i.e. failure of relaxation of ventricle, lead to elevation of ventricular diastolic pressure with normal ventricular diastolic volume. The commonest cause of failure of relaxation is ischaemic heart disease wherein reduction of myocardial perfusion results in diastolic dysfunction9. Failure of relaxation can also be caused by a stiff or thick ventricle as in restrictive cardiomyopathy secondary to infiltrative disorders like amyloidosis or haemochromatosis.
Lusitropic failure may be local or general. General diastolic dysfunction results in cardiac decompensation. Local failure results in failure of relaxation or dysdiastole, with non-synchronous coronary flow leading to myocardial ischaemia. Dysdiastole occurs early in
hypertension,
idiopathic hypertrophic subaortic stenosis (IHSS),
cardiomyopathy,
amyloidosis
haemochromatosis
12
Systolic Heart Failure10 Diastolic Heart Failure
Large, dilated heart Small LV cavity, concentric LV hypertrophy
Normal or low blood pressure Systemic hypertension
Broad age group/ common in men
Elderly women more common
Low ejection fraction Normal or increased ejection fraction
S3 gallop S4 gallop
Systolic/ diastolic impairment by echo
Diastolic impairment by echo
Treatment well established Treatment not well established
Poor prognosis Prognosis is poor after hospitalization is required for heart failure
Role of myocardial ischemia important in selected cases
13 Heart failure is now classified as
heart failure with normal ejection fraction6 40%-50%
heart failure with reduced ejection fraction <40% SPECTRUM OF HEART FAILURE:
The syndrome of cardiac failure encompasses the following spectrum.
PATHOGENESIS OF HEART FAILURE:
Following any insult / injury6, the myocardium responds by undergoing remodelling. Initially it preserves the cardiac output and eventually it proves to be maladaptive and results in clinical features of
Heart
Failure
Symptoms
Systolic dysfunction
Exercise intolerance
Ventricular arrhythmias Volume
retention Renal
dysfunction Neurohormonal
14 cardiacfailure.
Increased peripheral vascular resistance compensates for the decreased cardiac output. But overcompensation can lead to an increased afterload which affects the ventricular function adversely, leading to worsening of heart failure. Thus a vicious cycle sets in
INDEX EVENT •Acute MI •Genetic mutations •Acute inflammation •Hypertension •Valvular heart disease
REMODELING AND DISEASE PROGRESSION
•Myocyte hypertrophy •Fibrosis
•Collagen dissolution •Apoptosis •Necrosis •Neurohormonal
response •Cytokines •Wallstress
•Chamber dysfunction
15
Possible Mechanisms of Myocardial Failure
Loss of myocytes /Hypertrophy of remaining myocytes
Inadequate O2 /energy supply
Inadequate substrate utilization/energy storage
Inadequate mitochondrial function 10
Ventricular remodeling
Contractile protein abnormality/ defective synthesis
Abnormal myofibrillar or myosin ATPase
Activation of contractile elements --Membrane Na+,K+-ATPase defects
Abnormal sarcoplasmic reticulum function --Abnormal Ca2+ release/uptake
Abnormal myocardial receptor function
Downregulation of adrenoreceptors
Decreased Gs protein /Increased G1 protein
Increased myocardial fibroblast growth and collagen synthesis
Abnormal myocardial norepinephrine function or kinetics
Abnormal baroreceptor function
Aging changes/ presbycardia
16
NEUROHORMONAL CHANGES IN HEART FAILURE11
1. Increased sympathetic nervous system activity (increased norepinephrine/ epinephrine)
2. Increased endothelin
3. Increased arginine vasopressin 4. Increased renin and angiotensin II 5. Increased aldosterone
6. Increased neuropeptide Y
7. Increased natriuretic peptides –ANP/BNP 8. Increased Insulin
9. Increased Cortisol 10. Increased GH 11. Decreased IGF 12. Increased TNF 13. Increased IL6 14. Increased VIP
17
21. Increased vasodilator peptides (bradykinin)
SEQUENCE OF EVENTS IN HEMODYNAMIC ADAPTATIONS
IN CARDIAC FAILURE10
Increase in
1. LVEDV/LVEDP
2. Atrial volume/ pressure
3. Atrial /ventricular contractility (Starling law) 4. Volume and pressure in venous system
5. Capillary pressure / secondary transudation of fluid 6. Interstitial / extracellular fluid volume
18
Factors Associated with Left Ventricular Diastolic Dysfunction.
Hypertension
CAD
IHD
Myocardial Scarring
LVH
DCM
Myocardial fibrosis
Constrictive pericarditis
Infiltrative diseases
19
20
What triggers the early activation of the sympathetic nervous system and withdrawal of vagal tone and how spontaneous resolution of heart failure occurs remains unclear. Nevertheless, enough information has accrued to construct a reasonably coherent working hypothesis.
Molecular Adaptations and Maladaptations: Altered Cellular
Proteins
21
because the cause and progression of heart failure is complex, both environment and genetics play important roles. Thus, there is no single cause or unifying mechanism of heart failure, and current therapeutic strategies target multiple pathophysiologic processes.
Alterations are found in the failing heart in numerous contractile proteins, especially in heredity-based idiopathic dilated cardiomyopathies. In the latter situation, these alterations can interact with abnormal loading conditions to cause heart failure. Such alterations have been found in the proteins of the cytoskeleton, myosin, troponin T, and actin and are likely to contribute to diminished myocardial performance. In animal models, various overloads can result in heart failure, whether from systolic loads (hypertension), loss of myocardium (infarction), inflammation, and so forth. Furthermore, in human failing hearts, the etiology can be modified from that in animal models. In the failing human heart, many changes in gene expression at the mRNA or protein level have been found in failing hearts harvested at the time of cardiac transplantation. However, these are often hearts with end-stage myocardial disease in which many factors (eg, receiving multiple inotropic drugs) can obscure the initial pathogenesis.
Sarcomeric Proteins
22
23
ALTERATIONS IN VENTRICULAR FUNCTION SYSTOLIC
HEART FAILURE
There is a general agreement that myofibrillar function is depressed in the failing human heart, but its causal role remains controversial. Although such adaptive changes could be viewed to have an economical
survival advantage in the face of increased load, slower contraction and relaxation could also contribute to diastolic dysfunction. In addition, isoform changes involving both the heavy and the light chains, as been suggested, can play a role in heart failure. In addition to myosin heavy-
↑mechanical loading
↑neurohormone
normal
failure
Sarcomere dysfunction Signal transduction
angiogenesis Myocyte death
Electrical remodelin g
fibrosis
Altered metabolism/ energetics
24
and light-chain isoform switches, other well-understood pathologic events also contribute to altered cardiac function in various forms of heart failure. Point mutations of virtually all of the sarcomeric proteins cause hypertrophic cardiomyopathy . Similarly, mutations in the cytoskeletal proteins that provide the molecular scaffold for the sarcomere have been found in both dilated and hypertrophic cardiomyopathies. Echocardiographic studies have demonstrated that 20% of first-degree relatives of patients with idiopathic dilated cardiomyopathy have enlarged LV cavities.
Cell Membrane Ion Channels and Intracellular Calcium Kinetic
Proteins
Plasma membrane ion channels initiate excitation–contraction by generating and then propagating the action potentials that depolarize the myocardium. These ion channels are complex and contain several subunits that surround the ion-selective pore. The intracellular calcium (Ca2+) release channels are found in the sarcoplasmic reticulum (SR) and are quite different from those of the plasma membrane. The SR Ca2+ release channels are referred to as ryanodine receptors (RyRs) and interact with the ligand inositol triphosphate (IP3). The Ca2+ pump
25
channels (especially inward sodium channels) are altered in the failing heart,7 as are outwardly rectifying potassium channels12. A common feature of animal models of heart failure and clinical heart failure in humans is prolongation of the action potential. Both decreased sodium influx and potassium efflux are contributory and are mediated by reduced activity of the sarcolemmal sodium and potassium channels, respectively. This aberrant channel behavior contributes to the arrhythmias, which are the second most common cause of death of patients with heart failure. Multiple additional mechanisms are also contributory, including excess sympathetic stimulation and extracellular matrix–induced scar formation.
Excitation–Contraction Coupling Proteins
The basic mechanism of cardiac excitation–contraction coupling involves calcium (Ca2+) entry from the extracellular fluid by means of the voltage-dependent L-type calcium channel to produce a trigger in increasing [Ca2+]i and opening of the intracellular SR Ca
2+
26
cardiac SR Ca2+-ATPase activity. Other calcium-cycling proteins such as Na+-Ca2+ exchanger proteins14 can also be altered in heart failure. Phosphokinase A hyperphosphorylation of RyR has recently been shown to alter calcium signaling from the SR by depleting calcium stores and reducing calcium transients that can impair contractility in the failing myocardium.15Several of these alterations can occur concurrently and can vary from model to model and may not always be relative to failing human hearts. Nevertheless, it is likely that heart failure is characterized by reduced myofilament activation and decreased calcium available for activation as well as heightened cytosolic calcium levels in diastole. Some studies have shown increased myofibrillar calcium sensitivity16 and altered calcium kinetics. These abnormalities of calcium metabolism can be of primary importance in some types of heart failure, and they can be secondary or epiphenomena in other types. Most abnormalities of myocardial contractile activation have been demonstrated only in the late stages of heart failure and therefore can be the result of maladaptive hypertrophy rather than a primary cause of ventricular dysfunction.
Metabolic Maladaptations
Energy Production and Use
27
are more depressed than ATP. Reduced PC levels impair the shuttle that normally transfers energy from the mitochondria to the cytosol. The abnormal pattern of energy production in the failing heart resembles that of the fetal heart. This is also true of abnormalities in excitation– contraction coupling, myocyte contraction, and myocyte relaxation. In essence, the failing (and fetal) heart is less reliant on the more efficient pathways of mitochondrial ATP production. Less high-energy phosphates are available to meet the increased work demands of the failing heart. Even a small reduction in the phosphorylation potential impairs ATP-dependent reactions because the heart has only a small phosphorylation
reserve capacity. Moreover, decreased PC levels reflect more PC use rather than a lack of adequate PC.
28
The result is hypertrophy of the nonischemic portion of the ventricle; if this is inadequate, an increase in ventricular volume occurs using the Frank-Starling mechanism to sustain SV. Whether there is a true limitation of energy supply or its use in the failing myocardium remains controversial.
In cardiac failure, the total oxygen requirement of the heart can be increased significantly because of the increased total mass, the increase in myocardial systolic wall tension because of the Laplace relationship, and perhaps some wasted contractile energy. This increase can result in the extraction of a greater amount of oxygen from each unit of coronary blood flow and a widening of the coronary arteriovenous oxygen difference. These patients are able to increase coronary blood flow during exercise; however, some patients with a dilated ventricle that increases in diameter during exercise can have a further widening of the coronary arteriovenous oxygen difference during exercise and a decrease in coronary blood flow reserve . Tachycardia, such as can occur with atrial fibrillation, can reduce diastolic time for coronary perfusion, producing ischemic ventricular failure.
Substrate Use and Energy Storage
29
on whether or not there is a primary decrease in energy liberation by mitochondrial oxidative phosphorylation. The reductions in stores of myocardial high-energy phosphate, creatine phosphate, or ATP generally found in heart failure are thought to be secondary. This can be a consequence of the failure rather than the primary cause of the failure. There can also be reduced levels of creatine kinase and changes in the isoenzymes of creatine kinase in heart failure.
The major consequences of the state of energy starvation that is observed in failing hearts is not due to absolute reduction in ATP. It is the altered allosteric or regulatory effects of ATP which exert both inotropic and lusitropic effects .
Mitochondrial Mass and Function
30
Hibernation and Stunned Myocardium
Systolic ventricular dysfunction as a result of focal loss of contraction can be dynamic and transient as can occur with acute ischemia. With restoration of metabolic requirements of an ischemic segment of myocardium, either from restoring adequate coronary flow or reducing oxygen requirements, myocardial contraction can be restored. Sometimes restoration is delayed, so-called stunning. Chronically reduced coronary flow can be inadequate to preserve contraction but adequate for myocardial survival. Such persistent depressed myocardium has been termed hibernation and with reperfusion can recover contractility over a period of time .
Physiologic Maladaptations
Autonomic Nervous System Dysfunction
31
failure. Early in heart failure, there may be a decrease in cardiac output, arterial pressure, and baroreceptor activity, leading to an adaptive
increase in excessive neuroendocrine drive.
32
neuroendocrine drive. For unclear reasons, cardiac afferent activity to the central nervous system is reduced, leading to unhindered, efferent excitatory responses from the brain to the periphery. Reflex vasoconstrictor responses to unload the heart are paradoxically blunted.20 There are abnormal vascular responses to postural change. Some of these changes lead to alterations in regional blood flow that accompany heart failure. Parasympathetic (vagal) tone is decreased, and heart rate variability is markedly reduced, a hallmark of congestive failure. Furthermore, decreased heart rate variability can provide independent prognostic value in the identification of patients at risk for premature death.21
33
Myocardial Receptor Dysfunction
The failing heart commonly demonstrates a decreased response to inotropic stimuli. Although no single mechanism accounts for this, the reduction in myocardial β–adrenergic receptors and the subsequent second messenger cyclic adenosine monophosphate (cAMP) can play an important role.22 β–Adrenergic stimulation contributes importantly to the cardiac response to exercise, and β–adrenergic desensitization and uncoupling can be at least partially responsible for the reduced chronotropic and inotropic response to peak exercise commonly found in patients with heart failure. The β–adrenergic receptor abnormalities in heart failure appear to be caused by desensitization and uncoupling of the β1 receptor produced by local rather than systemic alterations in
catecholamines. In severe heart failure, the NE stores in sympathetic nerve endings are depleted. In a sense, the failing myocardium becomes functionally denervated. cAMP responses are reduced by approximately 30% to 35%, leading to further contractile dysfunction. Despite downregulation of the β1 receptor, a relatively high proportion of β2
receptors remains to mediate chronotropic and inotropic responses.23 However, there is some uncoupling of the β2 receptor from its G protein
and a modest upregulation of the Gi subunit, further contributing to a
34
profound decrease in cardiac β–adrenergic responsiveness with aging,25 which has clinical implications because heart failure is heavily concentrated in the elderly population.
The desensitization and uncoupling of β –adrenergic receptors that occurs early with mild to moderate ventricular dysfunction is related to the degree of heart failure and is associated with a very reduced response to β–adrenergic stimulation with drugs such as dobutamine. Long-term stimulation of β–adrenergic receptors can enhance myocardial β– adrenergic receptor kinase activity,26 leading to further desensitization and uncoupling of the β –adrenergic receptor.
Of great therapeutic interest, β–adrenergic blockade with metoprolol, a relatively cardioselective β1-blocker, upregulates the β1
receptor, but carvedilol, a nonselective β1- and β2-blocker with additional
β1 blocking activity, does not increase β1 receptor density. 27
35
between activation of the sympathetic nervous system and response to β – adrenergic blocking drugs in patients with heart failure.
Force–Frequency Response to Heart Failure
36
Hemodynamic maladaptations: The Hemodynamic Hypothesis
37
has used many compensatory mechanisms, but compensatory mechanisms eventually have failed.
Summarising the pathophysiology of heart failure, five ideas are being considered:
1. The damaged heart can itself release cytokines, which activate systems elsewhere in the body.
2. The continued stimulation of the sympathetic system, possibly by neural pathways from receptors in skeletal muscle, can account in the long-term for cytokine activation.
3. Tissue hypoxia may contribute.
4. Imbalance of the autonomic nervous system modifies the function of the immune system.
38
Causes precipitating heart failure
o Cardiac arrhythmias
o Pulmonary embolism
o Infections, particularly lung infections
o Rheumatic or viral myocarditis
o Infective endocarditis
o Anaemia2
o Conditions with increased metabolic demand (pregnancy, thyrotoxicosis)
o Acute coronary insufficiency or myocardial infarction
39
o Severe physical work or emotional excess increase cardiac workload
o Discontinuation of therapy (patient noncompliance or physician initiated)
o Other factors
Initiation of medications that worsen heart failure10 (calcium antagonists, β-blockers, nonsteroidal anti-inflammatory drugs, antiarrhythmic agents)
Iatrogenic volume overload (transfusion, fluid administration)
40
Stages of heart failure
Stage A: HIGH RISK - ( SHT, DM, CAD, family h/o cardiomyopathy) Stage B: ASYMPTOMATIC HF- heart disease without symptoms (previous MI, LVH, asymptomatic valvular disease)
Stage C: SYMPTOMATIC HF (NYHA classes II-IV)
Stage D: REFRACTORY ENDSTAGE HF- Patients with marked symptoms at rest despite maximum therapy who require repeated or prolonged hospitalizations/special cardiac support
New York Heart Association classification29
Class I: Symptoms only at levels of activity that would produce symptoms in normal individuals; ordinary physical activity does not cause undue dyspnea or fatigue
Class II: Symptoms on ordinary exertion, resulting in mild limitation of physical activity
Class III: Symptoms on less than ordinary exertion, resulting in marked limitation of physical activity
41
DIAGNOSIS
There is no gold standard diagnostic criteria for heart failure. Named criteria include
1. Boston criteria30 2. Duke criteria31
3. Killip32 class ( in the context of ACS) 4. Framingham criteria5
Framingham criteria (100% sensitive & 78% specific)
Diagnosis of cardiac failure needs
2 major criteria
1 major +2 minor criteria Major criteria5:
Cardiomegaly
PND
S3 gallop
Basal rales
Jugular vein distension
42 Elevated Central venous pressure
Positive abdominojugular reflux
Treatment induced weight loss more than 4.5 kg
Minor criteria5:
Heart rate more than 120/min
Nocturnal cough
Shortness of breath
Pleural effusion
↓ vital capacity ( 1/3 from maximum)
Hepatomegaly
Pedal edema
INVESTIGATIONS
XRAY CHEST
1. Pulmonary venous hypertension - dilatation and engorgement of the upper lobe pulmonary veins.
2. Generalised haze (due to interstitial oedema)
43
4. pleural effusion and interlobar thickening due to fluid collection. 5. dilated pulmonary artery
6. alveolar pulmonary oedema - butterfly appearance.
7. dilated superior vena cava and azygos veins systemic venous congestion.
8. cardiomegaly
Electrocardiography
1. LVH 2. LAE/RAE
3. BUNDLE BRANCH BLOCK 4. PATHOLOGICAL Q WAVES 5. AF
6. VENTRICULAR ARRHYTHMIA
44 valvular lesions,
hypertrophic subaortic stenosis, ruptured chordae of the mitral valve, valvular vegetations,
left atrial myxoma,
cardiac chamber dilatation pericardial effusion.
ventricular ejection fraction33 ventricular volumes.
Regional wall motion abnormality
Radionuclide studies:
non-invasive and accurate measurement of wall motion abnormalities, ventricular volume and ejection fraction.
Cardiac catheterisation:
45
Laboratory investigations:
A low serum sodium concentration indicates a stimulated renin-angiotensin system as well as increased vasopressin levels and is observed in patients requiring large doses of loop diuretics.
A low serum potassium level and contraction alkalosis may also be observed in patients receiving diuretic therapy.
An elevated blood urea nitrogen or serum creatinine level suggests either organic or functional renal impairment, caused by vasoconstriction, and decreased cardiac output.
Liver-function abnormalities may suggest hepatic congestion. Thyroid-stimulating hormone should be measured at the initial
evaluation, because both hypothyroidism and hyperthyroidism can be a primary contributor to the cause of heart failure.
Measurement of creatine phosphokinase and isoenzymes, as well as troponin I or troponin T may indicate the presence of active inflammation or ischemic injury to the heart.
46
GENERAL THERAPEUTIC APPROACH TO CHRONIC HEART FAILURE
Determine the etiology
Look for precipitating factors and correct them
Nonpharmacologic treatment
Sodium restriction (< 2 g/d) Aerobic exercise
Weight loss in obese patients
Treat hypertension and other comorbidities vigorously
Pharmacologic treatment
Angiotensin-converting enzyme inhibitors (ACEIs) Angiotensin receptor blockers (ARBs)
Aldosterone antagonists beta-Blockers
Vasodilators (long-acting nitrates and hydralazine) Diuretics
Digoxin
Device therapies
47
RISK STRATIFICATION IN HEART FAILURE
The following parameters50 are strongly associated with increased mortality in chronic heart failure and are recommended in risk stratification.
Advanced age
Low serum sodium
VO2 max (mL/kg per min <10–14)
Low LV ejection fraction33
Resuscitated sudden arrest
NYHA functional Class III–IV
Persistent low BP
High serum BNP34,35
Increased left ventricular volumes
High serum creatinine
High serum bilirubin
homocysteine 43
48
broad QRS36
, T-wave alternans37,
low heart rate variability,
low 6 min walking ability,
high left ventricular filling pressure,
restrictive mitral filling pattern38,
impaired right ventricular function,
high serum uric acid39,48,
high plasma interleukin –640,
high plasma oxidised LDL41,
low cardiac index, high resting heart rate and high serum norepinephrine42 portend a bad prognosis in these patients.
49
NEED FOR A PROGNOSTIC BIOMARKER49- WHERE ARE WE?
Latest biomarkers include
ST2
Galectin-3 Neuregulin-1 Copeptin
pro-adrenomedullin ANP/BNP
sTWEAK
50
RED CELL DISTRIBUTION WIDTH- WHAT IS IT?
In addition to the MCV, MCH, and MCHC, automated counters provide an index of the distribution of red blood cell volumes, termed the red blood cell distribution width (RDW). Counters use two methods to calculate this value. The first is referred to as the CV. The RDW-CV is the ratio of the width of the red blood cell distribution curve at 1 SD divided by the MCV (normal RDW-CV = 13 ± 1%). Since it is a ratio, changes in either the width of the curve or the MCV will influence the result. Microcytosis will tend to magnify any change in the RDW-CV simply by reducing the denominator of the ratio. Conversely, macrocytosis will tend to counterbalance the change in the width of the curve and thereby minimize the change in the RDW-CV2. A second method of measuring the RDW, the RDW-SD, is independent of the MCV. The RDW-SD is a direct measurement of the red blood cell distribution width taken at the 20% frequency level (normal RDW-SD = 42 ± 4fL).
51
and increase the RDW. The RDW-SD is more sensitive to the appearance of minor populations of macrocytes or microcytes since it is measured lower on the red cell volume distribution curve . At the same time, it is overly sensitive to the impact of increased numbers of reticulocytes, which, because of their larger MCV, will broaden the base of the distribution curve. The RDW-CV is less sensitive to the appearance of small populations of microcytes, true macrocytes, or reticulocytes, but better reflects the overall change in size distribution seen with well established macrocytic or microcytic anemias .
CONDITIONS WITH ELEVATED RDW LOW MCV
Iron deficiency anemia
Thalassemia
CONDITIONS WITH ELEVATED RDW WITH LOW OR
INCREASED MCV
B12 deficiency
Folate deficiency
Recent transfusion
CONDITIONS WITH ELEVATED RDW/ ELEVATED MCV
Liver disease
52
MECHANISMS FOR ELEVATED RDW IN HEART FAILURE
Inflammation mediated
Proinflammatory cytokines
1. Suppress erythropoietin gene expression45
2. Inhibit proliferation of erythroid progenitor cells 3. Downregulate erythropoietin receptor expression 4. Decrease RBC life span
ANEMIA as cause for elevated RDW 1. Anemia of chronic disease46 2. Disordered iron metabolism 3. Renal impairment
4. Hemodilution
Bone marrow resistance to erythropoietin
Elevations of IL1beta,
TNFalpha, IL6
Erythropoietin induced
RBC maturation
53
Oxidative stress induced anisocytosis and decreased RBC survival47
Januzzi and coworkers postulated from their research that RDW carries more prognostic information in addition to NT-pro BNP47 in acute heart failure. Few other studies also demonstrated that RDW is markedly elevated in severe heart failure independent of anemia and is a marker of worst prognosis. Hence RDW is clearly emerging as a new and promising biomarker in heart failure assessment, and candidacy for ventricular assist devices, IABPs, CRTs and transplantation.
54
MATERIALS AND METHODS
Study centre
Institute of Internal Medicine, Madras Medical College and Rajiv Gandhi Government General Hospital, Chennai
Study design
Case control study
Duration of the study
6 months
Sample
100 subjects with clinical evidence of heart failure were selected after applying exclusion criteria. Both inpatients as well as outpatients were selected.100 controls were selected with matching gender and age. Informed consent was obtained from all patients.
Inclusion criteria
Patients aged between 16 and 80 of both gender
Known patients of heart failure
55
Heart failure patients both with preserved as well as reduced EF
Exclusion criteria
Liver disease
Renal disease
Anemia with haemoglobin < 12 g/dl
Blood transfusion within past 3 months
Haematological malignancy
Methodology
56
these patients. USG abdomen was also done. Based on history, examination and investigation results, complete blood count with Red Cell Distribution Width was done for all the 100 patients who met with the inclusion criteria and compared with 100 controls. Student t test was applied for statistical significance. Patients were followed up and at the end of 1 month, outcome was noted for death or hospitalisations during that period.
12 lead ECG was assessed for
Ventricular hypertrophy (RVH, LVH)
Atrial enlargement
Q waves or ST/T changes denoting ischemia or infarction
Arrhythmias
Conduction blocks
XRay chest PA view was noted for
Pulmonary edema/congestion
Cardiomegaly
Effusion
57 LVESD
LVEDD.
Ejection fraction (Simpson’s method51
).
Left ventricle end diastole and Left ventricle end systole volumes are estimated.
Fasting plasma glucose was measured using glucose oxidase and pyruvate oxidase methods from overnight fasting sample and results were read by autoanalyser.2 hr postprandial glucose was measured 2 hrs after routine morning breakfast. From patients height and weight, body mass index (BMI) was calculated. Serum cholesterol (enzymatic oxidase-peroxidase method), Serum HDL (polyethylene glycol-CHOD-PAP method) Triglycerides (enzymatic calorimetric method) were measured using Erba XL 300 autoanalyser. Serum LDL was calculated using Friedewald’s formula52
.
Liver function test which included serum bilirubin, transaminases, alkaline phosphatase and albumin was done. Serum creatinine was measured and eGFR was calculated using Cockcroft gault equation. Ultrasonogram of abdomen was done to look for fatty liver or contracted kidneys. Liver disease and renal disease was ruled out.
58
cell counter Sysmex KX21. Hemoglobin,MCV, Hematocrit and RDW were determined as part of complete blood count. Normal RDW values: RDW-SD—39 to 46 fl
Risk factors were assessed as follows:
Diabetes mellitus53
Blood sugar >126mg/dl after overnight fasting
Post prandial blood sugar of 200 mg/dl or greater
Symptoms of DM with random glucose 200 mg/dl or greater
HbA1C > 6.5%
patients already diagnosed and on insulin/ OHAs Systemic hypertension
systolic BP of 140 mm Hg and above and diastolic BP of 90 mm Hg and above ( JNC8)
known cases on antihypertensives Obesity 54
body mass index > 30 kg/m2 Dyslipidemia55
Serum total cholesterol >/= 200 mg/dl (Borderline High) or
59
Serum triglycerides >/= 200 mg/dl (High) or
Serum LDL >/= 160 mg/dl(High) (ATP III guidelines)
Statistical analysis
SPSS software ver.21.0 was used for calculations using the following statistical methods:
Independent samples ‘t’ test-unpaired
Independent samples ‘t’ test-paired
ANOVA
Pearson correlation coefficient
Turkey kramer’s multiple comparision test
Relative risk
Ethical committee clearance
The study was approved by the institutional ethical committee of our hospital
Informed consent
Obtained from all cases and controls
Conflicts of interest
60
[image:68.595.105.527.158.344.2]OBSERVATIONS AND RESULTS
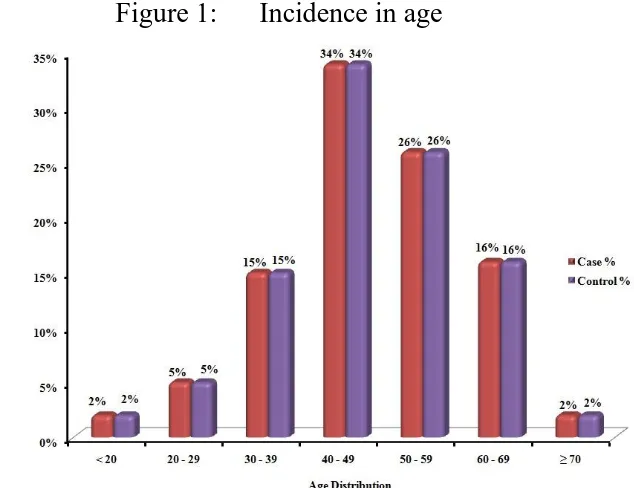
Table 1: AGE INCIDENCE AMONG CASES AND CONTROLS
Age Case Control
No % No %
< 20 2 2% 2 2%
20 – 29 5 5% 5 5%
30 – 39 15 15% 15 15%
40 – 49 34 34% 34 34%
50 – 59 26 26% 26 26%
60 – 69 16 16% 16 16%
≥ 70 2 2% 2 2%
Total 100 100
Among the 100 cases of heart failure selected in our study group, 34% were in the age group of 40 to 49 years, 26% in the age group of 50 to 59 years, 16% in the age group of 60 to 69 and 15% in the age group 30 to 39.
[image:68.595.176.493.490.734.2]61
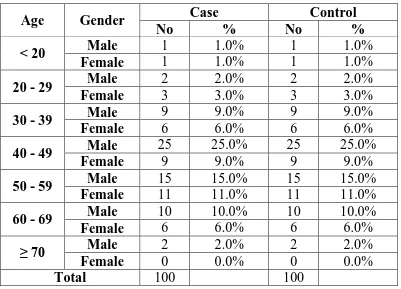
Table 2: AGE AND SEX INCIDENCE AMONG CASES
Age Gender Case Control
No % No %
< 20 Male 1 1.0% 1 1.0%
Female 1 1.0% 1 1.0%
20 - 29 Male 2 2.0% 2 2.0%
Female 3 3.0% 3 3.0%
30 - 39 Male 9 9.0% 9 9.0%
Female 6 6.0% 6 6.0%
40 - 49 Male 25 25.0% 25 25.0%
Female 9 9.0% 9 9.0%
50 - 59 Male 15 15.0% 15 15.0%
Female 11 11.0% 11 11.0%
60 - 69 Male 10 10.0% 10 10.0%
Female 6 6.0% 6 6.0%
≥ 70 Male 2 2.0% 2 2.0%
Female 0 0.0% 0 0.0%
Total 100 100
Figure 2: incidence of heart failure in male and female among various age groups 0 5 10 15 20 25
< 20 20 - 29 30 - 39 40 - 49 50 - 59 60 - 69 ≥ 70 1 2
[image:69.595.126.510.466.723.2]62
[image:70.595.102.532.321.562.2]In the study group of both cases and controls, 64% were males and 36% were females. Ratio of male to females was 1.78:1. In both males and females, the maximum incidence was seen in the age group 40 to 59 years with 40 to 49 the maximum in males and 50 to 59 the maximum in females.
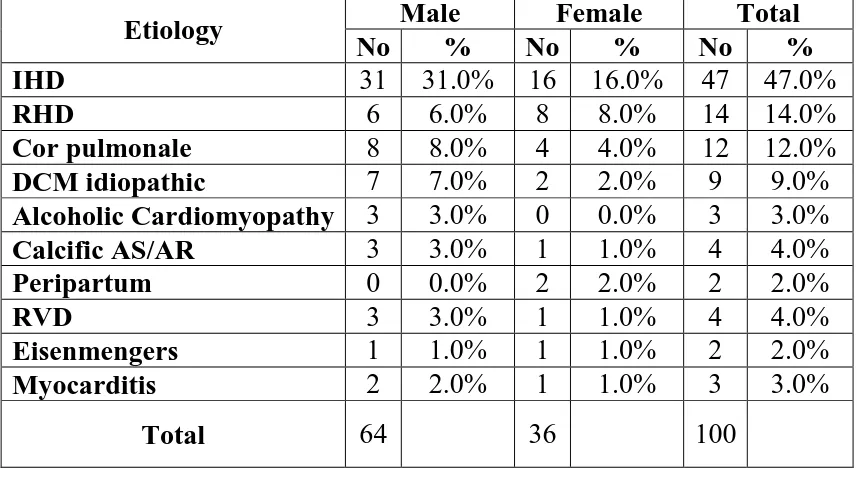
Table3: VARIOUS ETIOLOGY OF HEART FAILURE AND INCIDENCE
Etiology Male Female Total
No % No % No %
IHD 31 31.0% 16 16.0% 47 47.0%
RHD 6 6.0% 8 8.0% 14 14.0%
Cor pulmonale 8 8.0% 4 4.0% 12 12.0%
DCM idiopathic 7 7.0% 2 2.0% 9 9.0%
Alcoholic Cardiomyopathy 3 3.0% 0 0.0% 3 3.0%
Calcific AS/AR 3 3.0% 1 1.0% 4 4.0%
Peripartum 0 0.0% 2 2.0% 2 2.0%
RVD 3 3.0% 1 1.0% 4 4.0%
Eisenmengers 1 1.0% 1 1.0% 2 2.0%
Myocarditis 2 2.0% 1 1.0% 3 3.0%
Total 64
36 100
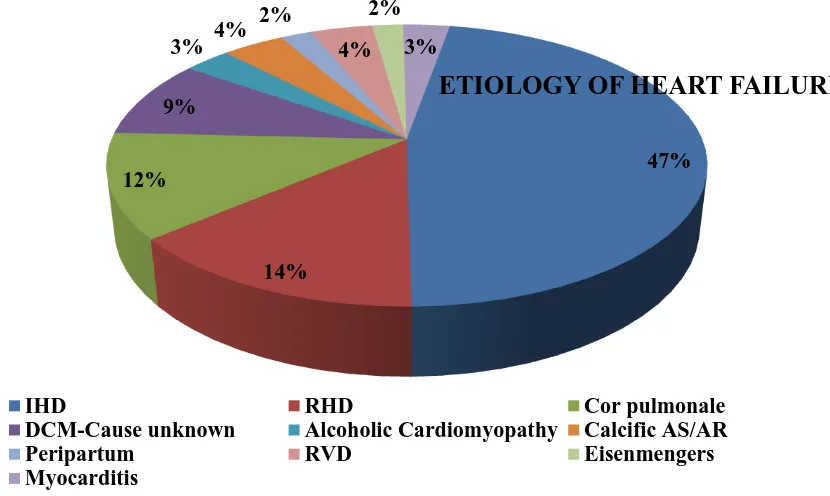
Etiology of heart failure among cases in our study group
IHD/CAD 47%
RHD 14%
COR PULMONALE 12%
DCM- CAUSE NOT KNOWN 9%
63
CALCIFIC AS/AR 4%
PERIPARTUM CARDIOMYOPATHY 2%
RVD 4%
EISENMENGER’S 2%
[image:71.595.118.533.273.521.2] MYOCARDITIS 3%
Figure CHART REGARDING ETIOLOGY OF HEART FAILURE
Figure CHART SHOWING ETIOLOGY OF HEART FAILURE IN MALE CASES
47%
14% 12%
9% 3% 4%
2%
4% 2%
3%
ETIOLOGY OF HEART FAILURE
IHD RHD Cor pulmonale
DCM-Cause unknown Alcoholic Cardiomyopathy Calcific AS/AR
Peripartum RVD Eisenmengers
64
CHART SHOWING ETIOLOGY OF HEART FAILURE AMONG FEMALES
31%
6% 8%
7%
3% 3% 0%
3% 1%
2%
ETIOLOGY AMONG MALES
IHD RHD
Cor pulmonale DCM-Cause unknown Alcoholic Cardiomyopathy Calcific AS/AR
Peripartum RVD
Eisenmengers Myocarditis
16%
8% 4%
2% 0% 1%
2% 1%
1% 1%
ETIOLOGY IN FEMALES
IHD RHD
Cor pulmonale DCM-Cause unknown Alcoholic Cardiomyopathy Calcific AS/AR
Peripartum RVD
65
Figure COMPARISION OF THE DISTRIBUTION OF CAUSES OF
HEART FAILURE IN MALES AND FEMALES
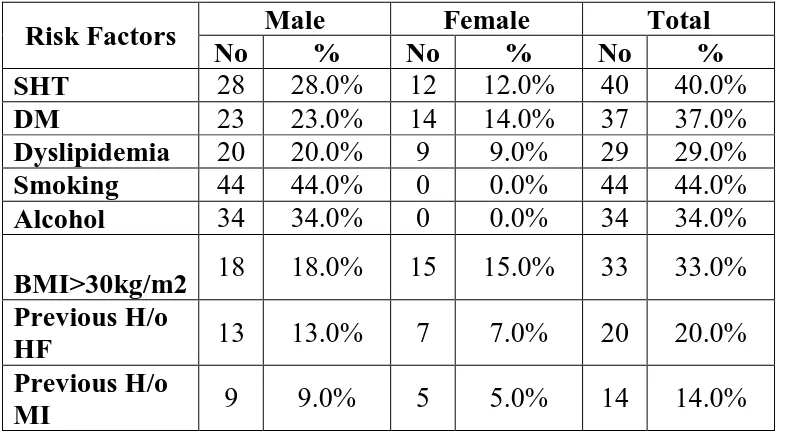
TABLE4: RISK FACTORS IN HEART FAILURE PATIENTS
Risk Factors Male Female Total
No % No % No %
SHT 28 28.0% 12 12.0% 40 40.0%
DM 23 23.0% 14 14.0% 37 37.0%
Dyslipidemia 20 20.0% 9 9.0% 29 29.0%
Smoking 44 44.0% 0 0.0% 44 44.0%
Alcohol 34 34.0% 0 0.0% 34 34.0%
BMI>30kg/m2 18 18.0% 15 15.0% 33 33.0% Previous H/o
HF 13 13.0% 7 7.0% 20 20.0% Previous H/o
MI 9 9.0% 5 5.0% 14 14.0%
0% 5% 10% 15% 20% 25% 30% 35% IH D R H D C or pul m onale D C M-C aus e unk now n A lc ohol ic Car diom yopa thy C al ci fi c A S/AR Per ipar tum RVD E is enm enge rs My ocar dit is 31%
6% 8% 7%
3% 3%
0%
3%
1% 2% 16%
8%
4%
2%
[image:73.595.106.500.510.728.2]66
Among the 100 cases studied, incidence of risk factors in percentage
SHT 40%
DM 37%
Dyslipidemia 29%
Smoking 44%
Alcohol 34%
BMI>30kg/m2 33%
Previous H/o HF 20%
[image:74.595.121.498.446.677.2] Previous H/o MI 14%
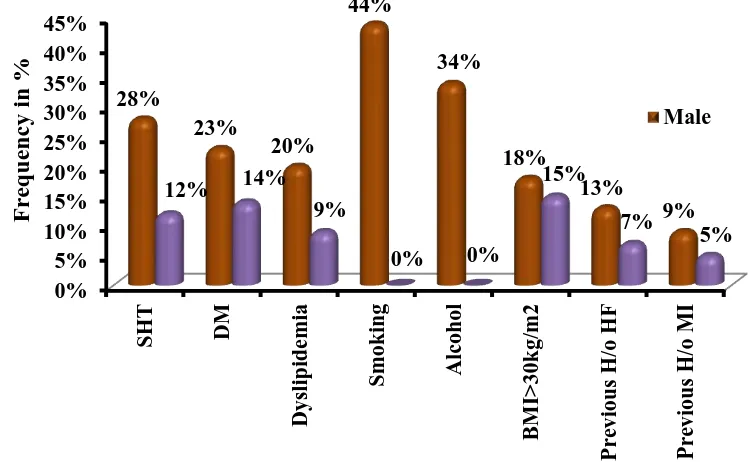
Figure CHART DEPICTING THE MULTIPLE RISK FACTORS
LEADING TO HEART FAILURE
0% 5% 10% 15% 20% 25% 30% 35% 40% 45% SH T DM D ysl ipi dem ia Sm oking A lc ohol B MI > 30kg/ m 2 Pre vi o us H /o H F P re vio us H /o M I 28% 23% 20% 44% 34% 18% 13% 9% 12% 14%
9%
0% 0%
67
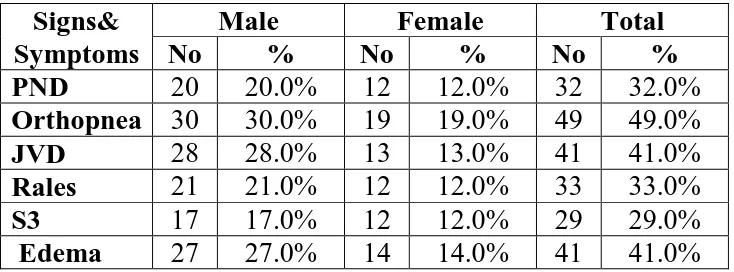
TABLE 5: MAJOR SIGNS AND SYMPTOMS
Signs& Symptoms
Male Female Total
No % No % No %
PND 20 20.0% 12 12.0% 32 32.0%
Orthopnea 30 30.0% 19 19.0% 49 49.0%
JVD 28 28.0% 13 13.0% 41 41.0%
Rales 21 21.0% 12 12.0% 33 33.0%
S3 17 17.0% 12 12.0% 29 29.0%
Edema 27 27.0% 14 14.0% 41 41.0%
Among 100 cases, the spread up of different clinical signs were like this
PND 32%
Orthopnea 49%
JVD 41%
Rales 33%
S3 29%
68
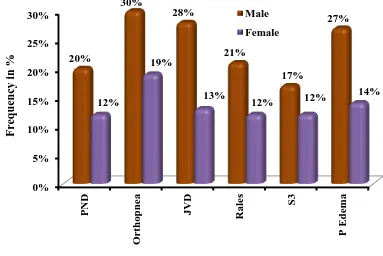
Figure CHART SHOWING MAJOR SIGNS IN MALES AND
[image:76.595.122.505.152.408.2]FEMALES
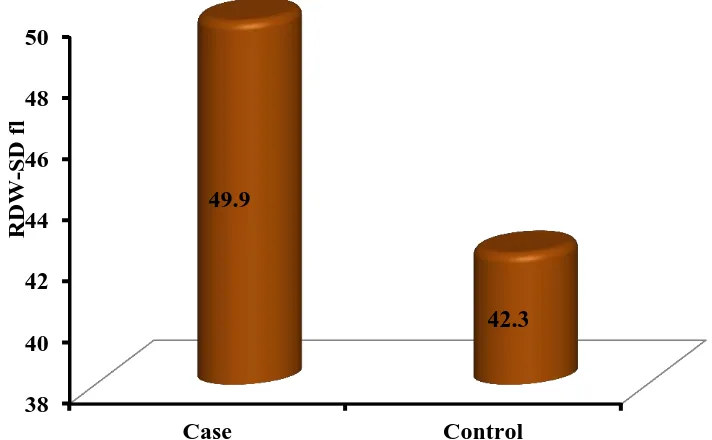
Table 6: RDW LEVELS IN CASES AND CONTROLS: Case(n=100) Control(n=100) P-Value
Age 48.25 ± 12.1 48.25 ± 12.1 1 (NS)
RDW-SD 49.9 ± 6.9 42.3 ± 2.3
< 0.01 (S)
RDW-SD was studied in 100 cases and equal number of age and sex matched controls. Their mean values are compared in the table above.
The RDW-SD values were highly significant in heart failure patient study group when compared to controls. (p<0.01)
0% 5% 10% 15% 20% 25% 30% PN D O rt ho pn ea JV D R al es S3 P E dem a 20% 30% 28% 21% 17% 27% 12% 19% 13%
12% 12%
69
Case Control
[image:77.595.138.494.252.472.2]
RDW-SD 49.9 42.3
Figure MEAN RDW LEVELS IN CASES AND CONTROLS
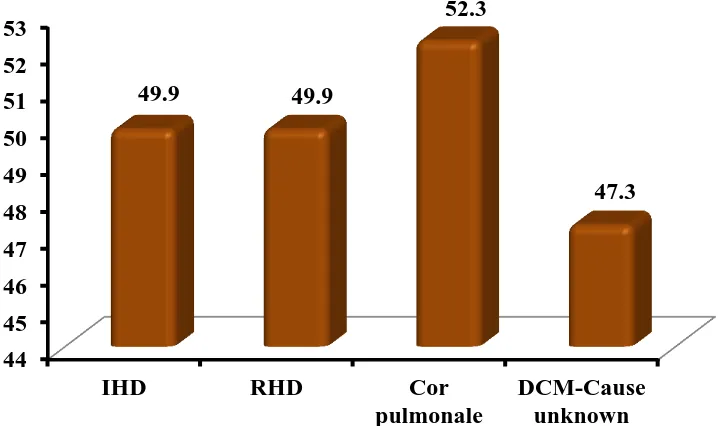
TABLE 7: SHOWING MEAN RDW-SD LEVELS AMONG
VARIOUS ETIOLOGY OF HEART FAILURE:
Etiology Mean RDW
IHD 49.9
RHD 49.9
Cor
pulmonale 52.3 DCM-Cause
unknown 47.3
38 40 42 44 46 48 50
Case Control 49.9
42.3
RDW-SD LEVELS
RDW
-SD
[image:77.595.108.270.563.710.2]70
FIGURE : COMPARISION OF RDW LEVELS IN DIFFERENT CAUSES OF HEART FAILURE
RDW-SD levels were compared among different causes of heart failure and was found to be high than controls in all causes. This implies that RDW-SD levels were elevated in heart failure cases irrespective of etiology.
COMPARISION OF RDW LEVELS WITH VARIOUS RISK
FACTORS
Then the RDW levels were compared among the different risk factors of heart failure. Significant elevations of RDW were seen in cases with risk factors than in cases without risk factors.
44 45 46 47 48 49 50 51 52 53
IHD RHD Cor pulmonale
DCM-Cause unknown 49.9 49.9
52.3
71
Table 9:COMPARING RDW AMONG RISK FACTORS IN HEART FAILURE:
Yes No P-Value
SHT 53.5 ±
7.4 47.3 ± 5.1 < 0.01 (S)
DM 53.8 ±
7.5 47.7 ± 5.6 < 0.01 (S)
Dyslipidemia 56.4 ±
6.3 47.2 ± 5.1 < 0.01 (S)
Smoking 51.5 ±
7.4 48.6 ± 6.2 0.040 (S)
Alcohol 52.1 ±
7.1 48.7 ± 6.5 0.018 (S)
BMI>30kg/m2 56.0 ±
6.5 46.9 ± 4.7 < 0.01 (S)
Among these 100 cases, 10 cases were identified as metabolic syndrome based on ATP III guidelines. The mean RDW value among those 10 patients was 59.6 ( significantly high)
TABLE 10 : NYHA FUNCTIONAL CLASS AMONG CASES
NYHA Male Female Total
No % No % No %
1 4 4.0% 3 3.0% 7 7.0%
2 10 10.0% 5 5.0% 15 15.0%
3 37 37.0% 23 23.0% 60 60.0%
4 13 13.0% 5 5.0% 18 18.0%
[image:79.595.107.451.556.670.2]72 Among 100 cases,
NYHA Class 1- 7%
NYHA Class 2- 15%
NYHA Class 3- 60%
[image:80.595.120.544.297.525.2] NYHA Class 4- 18%
FIGURE : NYHA CLASS AMONG HEART FAILURE CASES:
TABLE 11: COMPARISION OF RDW LEVELS AMONG DIFFERENT NYHA CLASS
NYHA RDW-SD P-value 1 40.2 ± 1.06
< 0.01 (S)
2 43.6 ± 2.7
3 49.1 ± 3.2
4 61.5 ± 4.03 0% 5% 10% 15% 20% 25% 30% 35% 40%
1 2 3 4
73
[image:81.595.108.453.352.434.2]In patients with NYHA class 1 and 2, mean RDW was within normal range whereas in class 3 and 4, mean RDW was 49.1 and 61.5 respectively. RDW levels were compared among 3 groups ie. NYHA class 2, 3 and 4 using ANOVA test and was found to be statistically very significant. Variation among column means was significantly higher than expected by chance. Cases belonging to NYHA class 4 had higher RDW levels compared to class 3 and 2.
TABLE 12. NYHA CLASS- COMPARISION BETWEEN GROUPS
NYHA Mean
Difference P-value Class 2 & Class 4 -5.55 < 0.01 (S)
Class 2 & Class 4 -17.892 < 0.01 (S)
Class 3 & Class 4 -12.342 < 0.01 (S)
By turkey Kramer multiple comparision test, p value is less than 0.01. To find out the correlation between NYHA class and RDW, Pearson’s coefficient was used with the following results.
Correlation coefficient (r) = -0.755
Coefficient of determination ( r2) =0.570
74
COMPARISION BETWEEN EJECTION FRACTION AND RDW LEVELS
Echo for all heart failure cases was taken and patients were classified into 4 groups on the basis of LV ejection fraction.
LVEF less than 30% - 26 cases
LVEF 30 to 44% -27 cases
LVEF 45 to 54% -13 cases
[image:82.595.107.492.428.649.2] LVEF greater than 54% -34 cases
TABLE 13 :SHOWING THE LV EJECTION FRACTION RANGE AMONG CASES:
LVEF%
Male Female Total
No % No % No %
< 30
Severe 15 15.0% 11 11.0% 26 26.0% 30 - 44
Moderate 19 19.0% 8 8.0% 27 27.0% 45 - 54
Mild 7 7.0% 6 6.0% 13 13.0%
> 54
Normal 23 23.0% 11 11.0% 34 34.0%
75
FIGURE CLASSIFICATION ON THE BASIS OF LV EJECTION FRACTION
The mean RDW among the 4 different groups based on EF values were compared. Mean RDW was higher in the group with EF < 30% (56.1) when compared with moderate and mild LV dysfunction and was normal in the group where EF> 54%. P value was statistically significant (less than 0.01)
0% 5% 10% 15% 20% 25% < 30 Severe
30 - 44 Moderate
76
Table 14: COMPARISION OF LV EJECTION FRACTION WITH RDW
LVEF RDW-SD P-value
< 30
Severe 56.6 ± 6.1
< 0.01 (S)
30 - 44
Moderate 51.4 ± 4.7 45 - 54
Mild 50.7 ± 5.4 > 54
Normal 44 ± 3.1
Comparisons were made among the 4 groups based on EF using ANOVA test.
TABLE 15: COMPARISION AMONG INDIVIDUAL GROUPS OF LV DYSFUNCTION
LVEF Mean
Difference P-value
Severe & Moderate 6.44 < 0.01 (S)
Severe & Mild 5.138 0.013 (S)
Severe & Normal
12.628
< 0.01 (S)
Moderate & Mild -1.302 0.859 (NS)
Moderate &
Normal 6.187
< 0.01 (S)
[image:84.595.108.386.448.662.2]77
By turkey Kramer multiple comparision test, p value is less than 0.01 when comparing patients with less than 30% EF with the other groups. To find out the correlation between EF and RDW, Pearson’s coefficient was used with the following results.
Correlation coefficient (r) = 0.640
Coefficient of determination ( r2) =0.4096
P value is less than 0.01 which is quite significant. Hence it was derived that there is correlation between RDW and LV ejection fraction.
OUTCOME ON FOLLOW UP AT THE END OF ONE MONTH:
[image:85.595.108.517.562.729.2]Patients were followed up at the end of 1 month. Among the 100 patients, 18 were lost in follow up. In the remaining 82 patients, 11 patients had expired and 13 had been hospitalised for failure symptom exacerbation.
TABLE 15: OUTCOME AT THE END OF 1 MONTH
Outcome after one month
Male Female Total
No % No % No %
Death 11 11% 4 4% 15 15%
Hospitalised 13 13% 12 12% 25 25%
Lost in Followup 13 13% 5 5% 18 18%
Non Hospitalised 27 27% 15 15% 42 42%
78
FIGURE SHOWING OUTCOME AT END OF 1 MONTH
The mean RDW of the three categories of patients on the basis of outcome was derived and was found to be significantly higher in patients who died at the end of 1 month ie. 61.3. Mean RDW of those who were hospitalised for symptoms during that 1 month was also higher when compared to those without hospitalisation. P value was very significant(less than 0.01)
Outcome after one month RDW Mean
Death 61.3
Hospitalised 51.6
Non Hospitalised 46.7 0% 5% 10% 15% 20% 25% 30%
Death Hospitalised Lost in Followup
Non Hospitalised 11%
13% 13%
79
FIGURE SHOWING OUTCOME AT THE END OF 1 MONTH 0
10 20 30 40 50 60 70
Death Hospitalised Non Hospitalised 61.3
51.6
46.7
RDW Mean
RDW
-SD
fl
30 40 50 60 70 80
1 6 11 16 21 26 31 36 41 Death
Hospitalisation Not Hospitalised
RD
W S
D (