A STUDY ON SERUM URIC ACID LEVELS IN TYPE 2
DIABETES MELLITUS AND ITS ASSOCIATION WITH
CARDIOVASCULAR RISK FACTORS.
submitted to
The Tamil Nadu Dr.M.G.R.Medical University
M.D. DEGREE EXAMINATION
BRANCH – I (GENERAL MEDICINE)
THE TAMIL NADU DR.M.G.R. MEDICAL UNIVERSITY
CHENNAI
BONAFIDE CERTIFICATE
This is to certify that "A STUDY ON SERUM URIC ACID LEVELS IN
TYPE 2 DIABETES MELLITUS AND ITS ASSOCIATION WITH
CARDIOVASCULAR RISK FACTORS" is a bonafide work done by
Dr.R.MANIKANDAN, post graduate student, Department of General Medicine,
Kilpauk Medical College, Chennai-10, under my guidance and supervision in partial
fulfillment of regulations of The Tamilnadu Dr.M.G.R.Medical University for the
award of M.D.Degree Branch I, (General Medicine) during the academic period from
May 2007 to March 2010.
Dr. V. Kanagasabai M.D.,
Dean
ACKNOWLEDGEMENT
I sincerely thank Prof. V. Kanagasabai M.D., Dean, Kilpauk Medical College, Chennai for permitting me to utilize the facilities needed for this dissertation work.
I am extremely grateful to my chief Prof. Dr. G. Rajendran, M.D., Professor and Head of the Department of Internal Medicine, Kilpauk Medical College & Government Royapettah Hospital for permitting me to carry out this study and for his constant encouragement and guidance.
I also express my sincere gratitude to Prof. N. Raghu, M.D., Prof. N. Gunasekar, M.D.,D.T.C.D., for their help and guidance rendered during the entire period of my work.
I whole heartedly express my sincere thanks to Prof. Senguttuvan, M.D.,D.M., Professor and Head, Assistant Professors, Department of Cardiology, Government Royapettah Hospital, Chennai for their valuable guidance and support throughout my dissertation work.
I wish to thank Dr. Mayilvahanan, M.D., Medical Registrar, Dr. Rohini, M.D., Dr. Vasanthi, D.Ch., M.D., Assistant Professors, Department of Medicine, Government
I also extend my thanks to all the laboratory technicians and Statistician in Government Royapettah Hospital for their valuable support throughout my dissertation work.
I also thank my parents, colleagues, friends and staff of our hospital for their support of this work.
CONTENTS
Sl.No. Title Page No.
1. INTRODUCTION 1
2. AIM OF THE STUDY 3
3. REVIEW OF LITERATURE 4
4. MATERIALS AND METHODS 35
5. DEFINITIONS USED IN THE PRESENT STUDY 40
6. RESULTS 43
7. DISCUSSION 61
8. CONCLUSION 69
9. RECOMMENDATIONS 70
10. SUMMARY 71
11. ANNEXURE
PROFORMA
CHARTS
ABBREVIATION
BIBLIOGRAPHY
INTRODUCTI
INTRODUCTION
Prevalence of Type 2 Diabetes mellitus is rapidly increasing and is already an epidemic in India. Diabetes mellitus is an important risk factor associated with increased incidence of cardiovascular disease (CVD).
Prevalence of CVD has rapidly increased in the past few years. The four major risk factors for CVD are hypercholesterolemia, hypertension, diabetes mellitus and cigarette smoking.
Insulin resistance state is associated with diabetes mellitus and metabolic syndrome (MS). The four major players in the MS are hyperinsulinemia, hypertension, hyperlipidemia, and hyperglycemia. Each member of this deadly quartet has been demonstrated to be an independent risk factor for CHD and capable of working together in a synergistic manner to accelerate both non-diabetic atherosclerosis and the atheroscleropathy associated with MS and T2DM.
In a like manner, hyperuricemia, hyperhomocysteinemia, ROS, and highly sensitive C- reactive protein (hsCRP) and each of which play an important role in expanding the original Syndrome X described by Reaven in the atherosclerotic process. The above quartet does not stand alone but interacts in a synergistic manner resulting in the progression of accelerated atherosclerosis and arterial vessel wall remodelling along with the original players.
as ischemic heart disease has been recognized since the 1950s and has been confirmed by numerous epidemiological studies since then. However, whether uric acid is an independent risk factor for cardiovascular mortality is still disputed as several studies have suggested that hyperuricemia is merely associated with cardiovascular diseases because of confounding factors such as obesity, dyslipidemia, hypertension, use of diuretics and insulin resistance.
Over recent years there has been renewed debate about the nature of the association between raised serum uric acid concentration and cardiovascular disease. Several studies have identified the value, in populations, of serum uric acid concentration in predicting the risk of cardiovascular events, such as myocardial infarction. This has directed the research towards the potential mechanisms by which uric acid might have direct or indirecteffects on the cardiovascular system. It has been difficultto identify the specific role of elevated serum uric acid becauseof its association with established cardiovascular risk factors such as hypertension, diabetes mellitus, hyperlipidemia andobesity.
AIM OF THE STUDY
AIM OF THE STUDY
1. To identify the level of serum uric acid in Type 2 Diabetes mellitus.
REVIEW OF LITERATURE
REVIEW OF LITERATURE
Epidemiology of diabetes:
It is interesting to reflect that in the first edition of the IDF Diabetes Atlas, released in 2000, the estimated global diabetes prevalence was 151 million. Now the estimated diabetes prevalence for 2010 has risen to 285 million, representing 6.4% of the world’s adult population, with a prediction that by 2030 the number of people with diabetes will have risen to 438 million. Far from being a disease of higher income nations, diabetes is very much a disease associated with poverty, with the major burden borne by the low- and middle-income countries and disproportionately affecting the lower socio-economic groups (29).
There were an estimated 40 million persons with diabetes in India in 2007 and this number is predicted to rise to almost 70 million people by 2025(30).
TYPE 2 DIABETES MELLITUS
developing Type 2 diabetes increases with age, obesity, and physical inactivity. Type 2 Diabetes shows strong familial aggregation, so that persons with a parent or sibling with the disease are at increased risk, as are individuals with obesity, hypertension, or dyslipidemia and women with a history of gestational diabetes. Persons of Native American, Polynesian or Micronesian, Asian-Indian, Hispanic, or African-American descent are at higher risk than persons of European origin ( 1 ). Although the disease is most
commonly seen in adults, the age of onset tends to be earlier in persons of non-European origin. The disease can occur at any age and is now seen in children and adolescents ( 2 , 3 , 4 , a n d 5 ).
According to ADA 2008 guidelines:
2—Criteria for the diagnosis of diabetes:
1. FPG -126 mg/dl (7.0 mmol/l). Fasting is defined as no caloric intake for at least 8 h.* OR
2. Symptoms of hyperglycaemia and casual plasma glucose -200 mg/dl (11.1mmol/l). Casual is defined as any time of day without regard to time since last meal. The classic symptoms of hyperglycaemia include polyuria, polydipsia, and unexplained weight loss.
OR
3. 2-h plasma glucose -200 mg/dl (11.1 mmol/l) during an OGTT. The test should be performed as described by the World Health Organization, using a
IMPAIRED GLUCOSE TOLERANCE (IGT)
IGT is a stage of impaired glucose regulation that is present in individuals whose glucose tolerance is above the conventional normal range but lower than the level considered diagnostic of diabetes ( 7 ,8 ). Cannot be defined on
the basis of fasting glucose concentrations; an OGTT is needed to categorize such individuals. Persons with IGT do have a high risk of developing diabetes, although not all do so ( 9 ). Some revert to normal
glucose tolerance, and others continue to have IGT for many years. Persons with IGT have a greater risk than persons of similar age with normal glucose tolerance of developing arterial disease ( 1 0 ), but they rarely develop
the more specific micro vascular complications of diabetes, such as retinopathy or nephropathy, unless they develop diabetes ( 7 ,1 1 ).
………..
*In the absence of unequivocal hyperglycemia, these criteria should be confirmed by repeat testing on a different day (6).
IMPAIRED FASTING GLUCOSE (IFG)
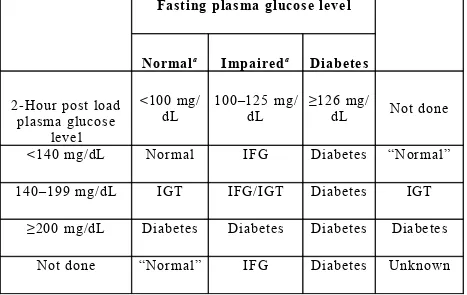
Individuals with fasting plasma glucose concentrations of 100 to 125 mg/dL are now considered to have IFG ( 1 2 ). If an OGTT is performed, some
[image:12.612.51.518.286.581.2]of these individuals will have IGT and some may have diabetes (2 hours post load plasma glucose concentration ≥200 mg/dL. Consequently, it is prudent, and recommended by WHO, that such individuals, if possible, have an OGTT to exclude diabetes.
Table 1. Categories of hyperglycaemia ( 1 2 ):
Fasting plasma glucose level
Normala Impaireda Diabetes
2-Hour post load plasma glucose
level
<100 mg/ dL
100–125 mg/ dL
≥126 mg/
dL Not done
<140 mg/dL Normal IFG Diabetes “Normal”
140–199 mg/dL IGT IFG/IGT Diabetes IGT
≥200 mg/dL Diabetes Diabetes Diabetes Diabetes
Not done “Normal” IFG Diabetes Unknown
Pathogenesis of Type 2 Diabetes mellitus:
Genetic factors:
for many years ( 1 3 , 1 4 ) . Supporting evidence includes the familial clustering of
these traits ( 1 3 ,1 4 ,1 5 ), the higher concordance rate of type 2 diabetes in
monozygotic versus dizygotic twins ( 1 6 , 1 7 ,1 8 ) , and the high prevalence of type
2 diabetes in certain ethnic groups. It is estimated that between 25% and 70% of the occurrence of type 2 Diabetes can be attributed to genetic factors ( 1 8 ). Studies of the patterns of inheritance indicate that multiple
genes probably are involved, although their number and relative contributions are uncertain ( 1 9 ,2 0 ).
Beta cell dysfunction:
The distinctive β-cell defect in type 2 diabetes is the loss of the first phase of glucose-induced insulin secretion. The second phase is also impaired but to a lesser degree ( 2 1 , 2 2 ). Subsequent investigation showed that this defect
was fully established by the time the fasting glucose level reached 115 mg/dL ( 2 3 ) , clearly predating overt diabetes, but was not present in persons
with truly normal glucose levels in whom type 2 diabetes developed later
( 2 4 ,2 5 ) . Thus, it first appears in the prediabetes state, termed IGT, which is
clinically manifest as excess postprandial excursions of glycaemia. Insulin resistance:
peripheral (predominantly skeletal muscle) glucose uptake and glycogen synthesis, and the inhibitory effects of insulin on adipose tissue lipolysis. It is generally accepted that insulin resistance plays a major role in the development of type 2 diabetes. Because currently an estimated 170 million people worldwide have Type 2 Diabetes, this is clearly an important association ( 2 6 ). Indeed, prospective studies have revealed that insulin
resistance predates the onset of type 2 Diabetes by 10 to 20 years and is the best clinical predictor of subsequent development of type 2 Diabetes ( 2 7 , 2 8 ).
Acquired factors:
• Beta cell cytotoxic chemical/ virus. • Autoimmunity.
• Ageing, obesity. • TNF alpha, leptin. • Physical inactivity. • Diet.
Risk factors for Type2 Diabetes mellitus:
• Family history of diabetes • Obesity
• Sedentary lifestyle
• IFG/ IGT
• Systemic hypertension( >140/90 mm hg)
• HDL<35 mg/dl, TGL> 250 mg/dl
• Polycystic ovarian disease
• History of vascular disease
(Source: adopted from ADA 2004).
Complications of Diabetes mellitus (DM):
Acute Complications of DM
Diabetic ketoacidosis (DKA) and hyperglycaemic hyperosmolar state (HHS) are acute complications of diabetes. DKA was formerly considered a hallmark of type 1 DM, but it also occurs in individuals who lack immunologic features of type 1 DM and who can subsequently be treated with oral glucose-lowering agents. HHS is primarily seen in individuals with type 2 DM. Both disorders are associated with absolute or relative insulin deficiency, volume depletion, and acid-base abnormalities. DKA and HHS exist along a continuum of hyperglycaemia, with or without ketosis (31).
Chronic Complications of DM-32
complications include problems such as gastro paresis, infections, and skin changes. Long-standing diabetes may be associated with hearing loss.
Evidence implicating a causative role for chronic hyperglycaemia in the development of macro vascular complications is less conclusive. However, coronary heart disease events and mortality are two to four times greater in patients with type 2 DM. These events correlate with fasting and postprandial plasma glucose levels as well as with the A1C. Other factors (dyslipidemia and hypertension) also play important roles in macro vascular complications.
METABOLIC SYNDROME
The metabolic syndrome (syndrome X, insulin resistance syndrome) consists of a constellation of metabolic abnormalities that confer increased risk of cardiovascular disease (CVD) and diabetes mellitus (DM). The criteria for the metabolic syndrome have evolved since the original definition by the World Health Organization in 1998, reflecting growing clinical evidence and analysis by a variety of consensus conferences and professional organizations. The major features of the metabolic syndrome include central obesity, hypertriglyceridemia, low HDL cholesterol, hyperglycaemia, and hypertension (33).
Three or more of the following:
• Central obesity: Waist circumference >102 cm (M), >88 cm (F).
• Hypertriglyceridemia: Triglycerides>150 mg/dL or specific medication.
• Low HDL cholesterol: <40 mg/dL and <50 mg/dL for men and women
respectively, or specific medication.
• Hypertension: Blood pressure > 130 mm systolic or > 85 mm diastolic or
specific medication.
• Fasting plasma glucose >100 mg/dL or specific medication or previously
[image:17.612.48.532.418.564.2]diagnosed type 2 diabetes.
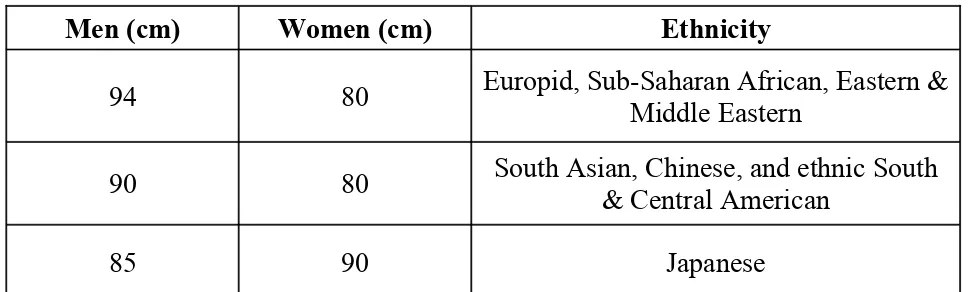
Table 2. IDF Criteria for Central Adiposity: Waist Circumference
Men (cm) Women (cm) Ethnicity
94 80 Europid, Sub-Saharan African, Eastern & Middle Eastern
90 80 South Asian, Chinese, and ethnic South & Central American
85 90 Japanese
Two or more of the following:
• Fasting triglycerides >150 mg/dL or specific medication.
• HDL cholesterol <40 mg/dL and <50 mg/dL for men and women, respectively, or
• Blood pressure >130 systolic or >85 mm diastolic or previous diagnosis or specific medication.
• Fasting plasma glucose >100 mg/dL or previously diagnosed type 2 diabetes.
Epidemiology
Prevalence of the metabolic syndrome varies across the globe, in part reflecting the age and ethnicity of the populations studied and the diagnostic criteria applied. In general, the prevalence of metabolic syndrome increases with age. The highest recorded prevalence worldwide is in Native Americans, with nearly 60% of women ages 45–49 and 45% of men ages 45–49 meeting National Cholesterol Education Program, Adult Treatment Panel III (NCEP:ATPIII) criteria.
Pathophysiology of the metabolic syndrome:
in triglyceride (TG). Increase in circulating glucose and to some extent FFA, increase in pancreatic insulin secretion, resulting in hyperinsulinemia. Hyperinsulinemia may result in enhanced sodium reabsorption and increased sympathetic nervous system (SNS) activity and contribute to the hypertension, as might increase levels of circulating FFAs. The proinflammatory state is superimposed and contributory to the insulin resistance produced by excessive FFAs. The enhanced secretion of interleukin 6 (IL-6) and tumour necrosis factor (TNF-alpha) produced by adipocytes and monocyte-derived macrophages results in more insulin resistance and lipolysis of adipose tissue triglyceride stores to circulating FFAs. IL-6 and other cytokines also enhance hepatic glucose production, VLDL production by the liver, and insulin resistance in muscle. Cytokines and FFAs also increase the hepatic production of fibrinogen and adipocyte production of plasminogen activator inhibitor 1 (PAI-1), resulting in a prothrombotic state. Higher levels of circulating cytokines also stimulate the hepatic production of C-reactive protein (CRP). Reduced production of the anti-inflammatory and insulin sensitizing cytokine adiponectin are also associated with the metabolic syndrome.
Associated Diseases
• Cardiovascular Disease (33)
follow-up of middle-aged men and women in the Framingham Offspring Study (FOS), the population attributable risk for patients with the metabolic syndrome to develop CVD was 34% in men and 16% in women.
• Ischemic stroke.
• Peripheral vascular disease.
• Type 2 Diabetes
Overall, the risk for type 2 diabetes in patients with the metabolic syndrome is increased three- to fivefold.
Other conditions associated with Metabolic Syndrome:
Increases in:
• ApoB and C III.
• Uric acid- Hyperuricemia reflects defects in insulin action on the renal
tubular reabsorption of uric acid.
• Serum viscosity.
• Asymmetric dimethylarginine, homocysteine, white blood cell count, pro-inflammatory cytokines, CRP.
• Microalbuminuria.
• Non-alcoholic fatty liver disease (NAFLD) and/or non-alcoholic steatohepatitis (NASH).
• Polycystic ovarian disease (PCOS).
• Obstructive sleep apnoea (OSA).
OBESITY
Obesity is defined as a state of excessive adipose tissue mass and is best viewed as a syndrome or group of diseases rather than as a single disease entity. The importance of this state derives from its high prevalence in our society and its association with serious morbidity, not the least of which is a marked increase in the prevalence of type 2 diabetes.
by the height in meters squared. This measurement has been used to define four classes of body weight. A BMI of
• < than 18.5 is considered underweight. • 18.5 - 24.9 is considered normal.
• 25.0 - 29.9 is considered overweight or preobese. • > 30 is considered in the obese category.
class I (BMI, 30 to 39.9)
class II (BMI, 40 to 49.9)
class III (BMI, >50).
The definition of obesity can be refined on the basis of the realization that the accumulation of adipose tissue in different depots has distinct consequences. Thus, many of the most important complications of obesity, including insulin resistance, diabetes, hypertension, and hyperlipidemia, are linked to the amount of intraabdominal fat, rather than to lower-body fat (i.e., buttocks and leg) or subcutaneous abdominal fat ( 3 4 , 3 5 ). Abdominal fat,
typically evident on physical examination, can be estimated by determining the waist-to-hip circumference ratio (with a ratio >0.72 considered abnormal), or more accurately quantified by dual-energy x-ray absorptiometry (DEXA) scanning or computed tomography.
of visceral and abdominal fat is the waist-to-hip ratio. The alternative patterns of body-fat distribution have been described as pear shaped (low waist-to-hip ratio) and apple shaped (higher waist-to-hip ratio). When the waist-to-hip ratio is less than 0.8, the relative risk of morbidities associated with obesity is lower than when the waist-to-hip ratio is greater than 1.0. Hence, the metabolic syndrome, which is a clustering of obesity and other cardiovascular risk factors, is more likely to be associated with visceral obesity ( 3 6 ).
PATHOLOGIC CONSEQUENCES OF OBESITY:
• Diabetes
The increased risk for type 2 diabetes in individuals with obesity is considerable ( 3 7 ). In persons aged 20 to 44, obesity is associated with a
fourfold increase in the relative risk of diabetes. Potential candidate substances produced by fat that may cause insulin resistance include tumour necrosis factor and other cytokines, such as interleukin-6, and resistin and adiponectin.
• Cardiovascular Disease
Obesity is an independent risk factor for cardiovascular disease ( 3 8 ),
including coronary artery disease and congestive heart failure, in both men and women.
The increased metabolic rate in obese subjects increases O2 consumption
and CO2 production, and these changes result in increased minute
ventilation. In subjects with marked obesity, the compliance of the chest wall is reduced, the work of breathing is increased, and the respiratory reserve volume and vital capacity are reduced ( 3 9 , 4 0 ).
• Gallstones.
Increased incidence of cholesterol gallstones (41).
• Cancer: The relative risk of liver cancer was almost 2-fold higher in
men with a BMI of 30.0 to 34.9. In men with a BMI higher than 35, the risk of stomach cancer was increased 1.94-fold, that of kidney cancer was increased 1.7-fold, and that of oesophageal cancer was increased 1.6-fold over the risk in normal-weight individuals. In women with a BMI greater than 35, the relative risk of cancer of the uterus was 2.8, of cancer of the cervix was 3.8, and of breast cancer was 1.7( 4 2 ).
• Hyperinsulinemia.
Major cardiovascular risk factors indicated in JNC-7 report are:
• Hypertension
• Smoking
• Obesity
• Diabetes mellitus
• Dyslipidemia
• Microalbuminuria or estimated GFR< 60ml/mt
o Age> 55 for men,
o >65 for women
• Family history of premature cardiovascular disease
o <55 for men
o <65 for women.
URIC ACID
Uric acid is a weak acid trioxypurine with a molecular weight of 168 that is composed of a pyrimidine and imidazole substructure with oxygen molecules. It is produced during the metabolism of purines, and specifically, is generated by the degradation of xanthine by the enzyme xanthine oxidase or its isoform, xanthine dehydrogenase.
Generation of Uric Acid:
acid is xanthine, which is degraded to uric acid by either xanthine oxidase, which generates superoxide anion in the process, or by its isoform, xanthine dehydrogenase, which generates the reduced form of nicotinamide-adenine dinucleotide. (Figure 1).
Figure 1: URIC ACID SYNTHESIS FROM PURINES
AMP GMP
Adenosine
Guanosine
Inosine
Guanine
Hypoxanthine
Xanthine
URIC ACID
Both exogenous purines (such as is present in fatty meat, organ meats, and seafood) and endogenous purines are major sources of uric acid in humans.
[image:27.612.60.505.218.616.2]
Figure 2: Uric acid metabolism
Excretion of Uric Acid:
excretion in the range of 250 to 750 mg per/day. Although urate (the form of uric acid at blood pH of 7.4) is freely filtered in the glomerulus, there is evidence that there is both reabsorption and secretion in the proximal tubule, and as a consequence the fractional urate excretion is only 8% to 10% in the normal adult. In addition, some excretion of uric acid occurs through the gut, where uric acid is degraded by uricolytic bacteria, and this may account for one-third of the elimination of uric acid in the setting of renal failure.
Uric acid excretion consists of a four-step model with glomerular filtration, followed by reabsorption, secretion, and postsecretory reabsorption, the latter three processes all occurring in the proximal convoluted tubule. (43, 44).
In the human kidney, urate is transported via URAT-1 across the apical membrane of proximal tubular cells, in exchange for anions being transported back into the tubular lumen to maintain electrical balance. Pyrazinamide, probenecid, losartan, and benzbromarone all inhibit urate uptake in exchange for chloride at the luminal side of the cell by competition with the urate exchanger.
Urate secretion appears to be mediated principally by a voltage-sensitive urate transporter, which is expressed ubiquitously and localizes to the apical side of the proximal tubule in the kidney. The primary candidate is urate transporter (UAT), which is in the galactin family (45). Recently, a novel human renal apical organic anion efflux
HYPERURICEMIA
Hyperuricemia has been arbitrarily defined as >7.0 mg/dL in men and >6.5 mg/dL in women (109). Uric acid levels tend to be higher in certain populations (e.g., African
American and Pacific Islanders), with certain phenotypes (obesity, metabolic syndrome) and with special diets (meat eaters vs. vegetarians) (47). Uric acid also has a circadian
variation, with the highest levels in the early morning (48). The serum urate concentration
reflects the balance between urate production and elimination. Hyperuricemia may occur from excessive production of urate (overproduction) or decreased elimination (underexcretion), and frequently a combination of both processes occur in the same patient. Furthermore, uric acid levels may vary in the same individual by as much as 1 to 2 mg/dL during the course of a day, due to the effects of diet and exercise.
Major causes of Hyperuricemia
Genetic causes (49)
Familial hyperuricemic nephropathy (mutation of uromodulin). Lesch-Nyan syndrome (HGPRT mutation).
Phosphoribosyl pyrophosphate synthetase (PRPPS) mutation. Dietary causes
• Diet high in purines (organ meats, shellfish, fatty meats).
• Diet high in fructose (high fructose corn syrup, table sugar, honey).
• Low salt diet. Drugs
Thiazides.
Loop diuretics.
Calcineurin inhibitors (cyclosporine > tacrolimus). Pyrazinamide.
Low-dose aspirin. Volume depletion.
Hypoxia (systemic or tissue).
Increased cell turnover (myeloproliferative disorders, polycythemia vera).
Conditions associated with higher uric acid levels:
Renal failure.
Obesity/metabolic syndrome. Untreated hypertension. African American race. Preeclampsia.
Vigorous exercise.
The following abnormalities are commonly associated with but not causally related to Hyperuricemia.
• Obesity
• Dyslipidemia ( usually type 4 with increased VLDL and normal cholesterol).
• Hypertension
• Ischemic heart disease.
HYPOURICEMIA:
Low uric acid levels (levels <2.0 mg/dL) can occur via a variety of mechanisms
(49).
Causes of Hypouricemia:
Liver disease
Fanconi's syndrome
Diabetes (with glycosuria)
Inappropriate secretion of vasopressin
Familial hypouricemia (due to URAT-1 mutation) Total parenteral hyperalimentation
Medications with uricosuric property including aspirin (>2.0g/day), x-ray contrast materials, ascorbic acid, calcitonin, outdated tetracycline and glyceryl guaiacolate.
Uric acid and Hypertension, the metabolic syndrome and cardiovascular disease.
evidence to support uric acid as a true cardiovascular risk factor. Hyperuricemia and hypertension:
Recent studies have provided provocative data that uric acid may be a true risk factor for hypertension. Thus, an elevated serum uric acid is now recognized to be an independent risk factor for the development of hypertension (51). This has been shown by
multiple groups including a recent analysis by the Framingham group (52). Furthermore,
an elevated serum uric acid is common in subjects with new-onset hypertension.
Hyperuricemia is also more common in primary hypertension than in secondary hypertension, at least in adolescents (64). In one study an elevated uric acid level (>5.5
mg /dl) was observed in nearly 90% of adolescents with essential hypertension, whereas uric acid levels were significantly lower in controls and teens with either white-coat or secondary hypertension (64). Interestingly, the relationship of uric acid levels to
hypertension in people with established hypertension varies. In some studies hyperuricemia is present in 40 to 60% of subjects with untreated hypertension (65,66,69)
whereas other studies reported lower frequencies (65,67). Some of the variability might be
due to the inclusion of patients with secondary hypertension in various reports. Potential mechanisms involved with the association of hyperuricemia and hypertension include the following:
1. Decreased renal blood flow (decreased GFR) stimulating urate reabsorption, 2. Microvascular (capillary) disease resulting in local tissue ischemia.
secretion in the proximal tubule and increased uric acid synthesis due to increased RNA-DNA breakdown and increased purine (adenine and guanine) metabolism, which increases uric acid and ROS through the effect of xanthine oxidase (XO). 4. Ischemia induces increased XO production and increased SUA and ROS.
These associations with ischemia and XO induction may help to understand why hyperuricemia is associated with preeclampsia and congestive heart failure.
Uric acid, Metabolic Syndrome, Type 2 diabetes and Atheroscleropathy:
Glucotoxicity places an additional burden of redox stress on the arterial vessel wall and capillary endothelium. Hyperglycemia induces both an oxidative stress (glucose autoxidation and advanced glycosylation endproducts (AGE) – ROS oxidation products) and a reductive stress through pseudohypoxia with the accumulation of NADH and NAD(P)H in the vascular intima (70,71,72).
This redox stress consumes the natural occurring local antioxidants such as: SOD, GPX, and catalase. Once these local intimal antioxidants are depleted uric acid can undergo the paradoxical antioxidant – prooxidant switch or the urate redox shuttle (73,74).
New studies have also suggested that hyperuricemia may have a pathogenetic role in the obesity metabolic syndrome. Thus, an elevated uric acid was found to predict the development of both obesity and hyperinsulinemia in normal subjects (53,54,55) and an
elevated uric acid is universally present in the metabolic syndrome (56). The low nitric
Hyperinsulinemia:
Insulin, proinsulin, and amylin individually and synergistically activate the renin – angiotensin system (RAS) with subsequent increase in Angiotensin II. Angiotensin II is the most potent endogenous inducer of NAD(P)H oxidase, increasing NAD(P)H, which increases vascular – intimal reactive oxygen species (ROS) and superoxide (O2-•) (70,75).
Obesity:
Leptin levels are elevated and associated with insulin resistance in MS and early T2DM. Bedir A et al. have recently discussed the role of leptin as possibly being a regulator of SUA concentrations in humans and even suggested that leptin might be one of the possible candidates for the missing link between obesity and hyperuricemia (76).
Furthermore, hypertriglyceridemia and free fatty acids are related to hyperuricemia independently of obesity and central body fat distribution (77,78).
Prothrombotic milieu:
In MS and T2DM there is an observed increased thrombogenecity, hyperactive platelets, increased PAI-1 (resulting in impaired fibrinolysis), and increased fibrinogen in the atherosclerotic milieu associated with the dysfunctional endothelial cell.
Uric acid and cardiovascular disease:
where it activates a variety of intracellular signalling molecules involved in inflammation and proliferation. In the endothelial cell there is a decrease in nitric oxide levels and an inhibition of endothelial proliferation, whereas in the vascular smooth muscle cell there is activation of proliferative and inflammatory pathways.
(57,58,59,60,61,62,63).
Uric acid and endothelial dysfunction:
The upper 1/3 of the normal physiologic – homeostatic range (> 4 mg/dl) and abnormal elevations (> 6.5 or 7 mg/dl in men and > 6.0 mg/dl in women) in SUA definitely should be considered as one of the multiple injurious stimuli to the arterial vessel wall and capillary, which may contribute to endothelial dysfunction and arterial – capillary vessel wall remodelling through oxidative – redox stress (70, 79,80).
SUA in the early stages of the atherosclerotic process is known to act as an antioxidant and may be one of the strongest determinates of plasma antioxidative capacity (81).
duration of oxidant substrate and its oxidant enzyme. In the accelerated atherosclerotic – vulnerable plaque the intima has been shown to be acidic (82), depleted of local
antioxidants with an underlying increase in oxidant stress and ROS and associated with uncoupling of the eNOS enzyme and a decrease in the locally produced naturally occurring antioxidant: eNO and endothelial dysfunction.
Uric acid has been found to promote low-density lipoprotein(LDL) oxidation in vitro, a key step in the progression of atherosclerosis (86), and these effects are inhibited
by vitamin C (87) indicating animportant interaction between aqueous anti-oxidants. Uric
acidcan also stimulate granulocyte adherence to the endothelium (88), and peroxide and
superoxide free radical liberation (89). Uric acid traversesdysfunctional endothelial cells
and accumulates as crystal withinatherosclerotic plaques (91).
Endothelial function and endothelial nitric oxide (eNO)
Endothelium is responsible for regulation of vascular tone, inflammation, lipid metabolism, vessel growth (angiogenesis – arteriogenesis), arterial vessel wall – capillary sub endothelial matrix remodelling, and modulation of coagulation and fibrinolysis. One particular enzyme system seems to act as the maestro: The endothelial nitric oxide synthase (eNOS) enzyme and its omnipotent product: endothelial nitric oxide (eNO) .
superoxide and ROS instead of the net production of the protective antioxidant properties of eNO.
The activated, dysfunctional endothelium is a net producer of superoxide (O2-)
associated with MS, T2DM, and atheroscleropathy (83).
Uric acid is known to induce the nuclear transcription factor (NF-kappaB) and monocyte chemo attractant protein-1 (MCP-1) (84). Regarding TNF alpha it has been
shown that SUA levels significantly correlate with TNF alpha concentrations in congestive heart failure and as a result Olexa P et al. conclude that SUA may reflect the severity of systolic dysfunction and the activation of an inflammatory reaction in patients with congestive heart failure [85]. Additionally, uric acid also stimulates human
mononuclear cells to produce interleukin-1 beta, IL-6, and TNF alpha (86).
SUA may or may not be an independent risk factor especially since its linkage to other risk factors is so strong, however there is not much controversy regarding its role as a marker of risk, or that it is clinically significant and relevant.
MATERIALS AND METHODS
MATERIALS AND METHODS
Setting : Government Royapettah Hospital, Chennai.
Collaborative Department : Department of Biochemistry, GRH.
Study Design : Descriptive analytical study.
Period of Study : February 2008 to March 2009.
Sample Size : 70 cases.
Inclusion criteria:
1. Patients with type 2 diabetes mellitus (irrespective of their glycemic status and duration of diabetes).
2. Patient’s age > 40 years.
3. Both sexes were included. Exclusion criteria:
Patients with
1. Renal failure.
2. On long term diuretics and steroids. 3. Regularly consuming alcohol.
4. On antimetabolite and chemotherapy drugs. 5. Hepatic disorders.
6. Peripheral vascular disease/ cerebrovascular disease/ pulmonary tuberculosis.
7. Renal transplant patients.
Cases:
Diabetics with age greater than 40 years and of both sexes were included. Cases were selected after considering the exclusion criteria.
Controls:
Subjects who were above 40 years and who had normal blood sugar and who met the above exclusion criteria are kept as controls.
Consent:
The study group thus identified were instructed about the nature of the study. Willing participants were included in this study after getting their written informed consent.
Materials:
A total of 70 cases who satisfied the inclusion and exclusion criteria above were taken up for the study. Thirty age and sex matched subjects were kept as controls.
Conflict of interest:
There was no conflict of interest. Financial support:
Nil. Limitations:
• Because of limited resources GTT, HbA1c, leptin levels, C peptide assay,
• Because of limited resources urinary uric acid excretion and urate clearance
could not be done. Methods:
Selected data were elicited from the patients and controls and recorded in proforma.
1. Socio demographic data:
• Age
• Sex
2. Clinical data:
• Body weight, height, BMI.
• WHR.
• Systolic and Diastolic blood pressure.
• Duration of diabetes.
• Family history of diabetes.
• Smoking history.
• Ischemic heart disease.
• Fundus examination.
• Neurological examination for peripheral neuropathy.
• Fasting and postprandial blood sugar levels estimated by using
glucosoxidase-peroxidase (GOD/POD) method.
• Serum lipid profile.
• Blood urea estimation was done manually by using diacetyl monoxime
method (DAM).
• Serum creatinine estimation was done by using alkaline picrate method. • Serum uric acid was done by using phosphotungstic acid method.
Principle:
Step 1: Deproteinisation: In a test tube to 1 ml of distilled water, 0.2 ml of serum, 0.4 ml of 2/3 N H2SO4, 0.4 ml sodium turgitate(10%) are added and sample centrifuged for 5 minutes.
Step 2: To 1 ml of the filtrate add 0.75N NaOH, saturated picric acid 0.5 ml mix well & wait for 15 minutes. Reading is taken at 490 nm calorimetrically.
Statistical Analysis:
DEFINITIONS USED IN THE PRESENT STUDY
Diabetes Mellitus:
1. FPG -126 mg/dl (7.0 mmol/l). Fasting is defined as no caloric intake for at least 8 h.* OR
2. Symptoms of hyperglycaemia and casual plasma glucose -200 mg/dl (11.1mmol/l). Casual is defined as any time of day without regard to time since last meal. The classic symptoms of hyperglycaemia include polyuria, polydipsia, and unexplained weight loss.
OR
3. 2-h plasma glucose -200 mg/dl (11.1 mmol/l) during an OGTT. The test should be performed as described by the World Health Organization, using a
glucose load containing the equivalent of 75 g anhydrous glucose dissolved in water. * Hyperuricemia:
Hyperuricemia has been arbitrarily defined as >7.0 mg/dL in men and >6. mg/dL in women.
………
*In the absence of unequivocal hyperglycemia, these criteria should be confirmed by repeat testing on a different day (6).
Body Mass Index (BMI):
It is estimated by using the formula:
Obesity:
. A BMI of
• < than 18.5 is considered underweight.
• 18.5 - 24.9 is considered normal.
• 25.0 - 29.9 is considered overweight or preobese. • > 30 is considered in the obese category.
class I (BMI, 30 to 39.9) class II (BMI, 40 to 49.9)
class III (BMI, >50). Metabolic syndrome:
The criteria for the metabolic syndrome have evolved since the original definition by the World Health Organization in 1998, reflecting growing clinical evidence and analysis by a variety of consensus conferences and professional organizations.
NCEP:ATPIII 2001
Three or more of the following:
Central obesity: Waist circumference >102 cm (M), >88 cm (F).
Hypertriglyceridemia: Triglycerides >150 mg/dL or specific medication.
Hypertension: Blood pressure >130 mm systolic or >85 mm diastolic or specific medication.
Fasting plasma glucose >100 mg/dL or specific medication or previously diagnosed type 2 diabetes.
Waist hip ratio:
The waist is measured by taking a circumference that gives the narrowest measurement between the ribcage and the iliac crest. The hip measurement is taken by measuring at a level that gives the maximal measurement of hip over the buttocks. It is a simple method that is unrelated to height, correlates closely with body mass index. Waist hip ratio is an approximate index of intra abdominal fat mass and total body fat.
Waist hip ratio >0.9 in women and >1.0 in men is abnormal. Conversion of blood glucose to plasma glucose:
John Neale (1999) described the conversion of blood glucose to plasma glucose by using the formula:
Plasma glucose= Whole blood glucose × 1.12 RESULTS
RESULTS
The total number of subjects included in this study was 100. Among them 70 were cases (type 2 diabetes mellitus) and 30 were controls (non diabetics). The details of subjects included in this study are given table 3.
Parameters Cases Controls
Total No. 70 30
Gender M= 42 F= 28 M= 16 F= 14
Age (Yrs) 43-79 41-76
Mean Age (Yrs) 59.55 55.8
BMI 18.4-29.4 18.6-26.2
WHR 0.76-1.14 0.65-1.12
FBS(mg/dl) 102-206 86-129
PBS (mg/dl) 162-304 123-198
SUA (mgt/dl) 3.3-8.2 2.6-5.3
Analysis of cases and controls with respect to age:
TABLE 4: CASES AND CONTROLS IN RELATION TO DIFFERENT AGE GROUPS
* p= 0.058 (not significant)
The age group of the case and control group did not vary significantly. Analysis of cases and controls with respect to gender:
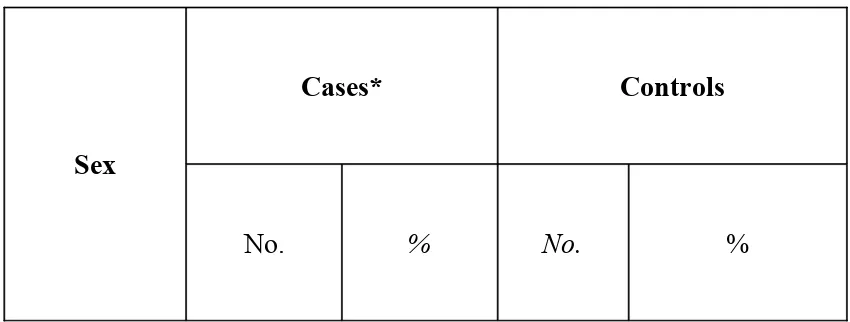
[image:46.612.49.474.550.711.2]Among 70 cases studied, there were 42 males and 28 females. Among 30 controls, there were 16 males and 14 females. The details are given in table 5.
TABLE 5: CASES AND CONTROLS IN RELATION TO GENDER
Sex
Cases* Controls
Male 42 65.71 16 53.33
Female 28 34.29 14 46.67
Total 70 100.00 30 100.00
*P= 0.6986 (not significant)
The sex composition of the study and control group did not differ significantly.
Analysis of cases and controls with respect to B.M.I:
[image:47.612.51.477.50.309.2]The mean and standard deviation foe the cases and controls were 24.38±2.8 and 22.07±2.23 respectively. The details are shown in table 6.
TABLE 6: CASES AND CONTROLS WITH RESPECT TO BMI
BMI Cases* Controls
No. % No. %
<25 37 52.86 26 86.67
>25 33 47.14 4 13.33
Total 70 100.00 30 100.00
Mean 24.38 22.07
SD 2.80 2.23
p = 0.0028
Blood sugar distribution among cases:
The details of fasting and post prandial blood sugar distribution among cases are shown in the table 7. The mean and Standard deviation for fasting blood sugar was 144.3±23.38 while the mean and Standard Deviation for post prandial blood sugar was 214.70± 32.11.This shows that the diabetic status was under poor control among cases.
TABLE 7:
FASTING AND POST PRANDIAL BLOOD SUGAR LEVELS AMONG CASES (N=70)
*p 0.0001
Analysis of cases and controls in relation to selected cardiovascular risk factors:
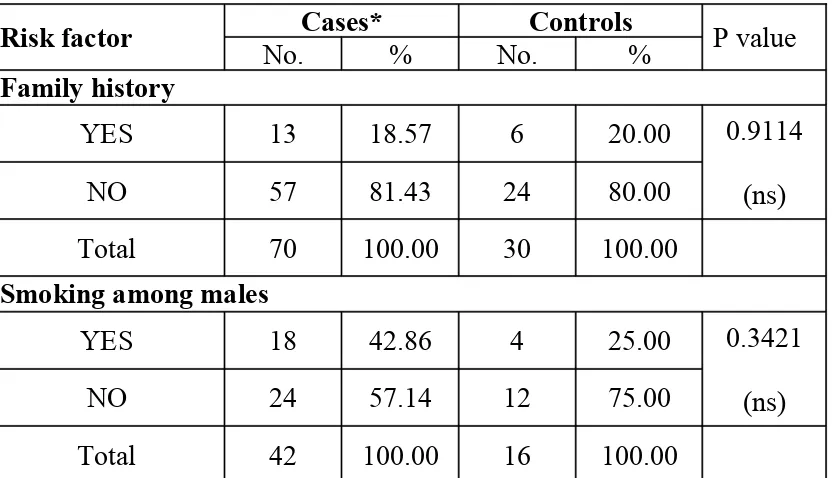
[image:48.612.75.492.488.727.2]Details of the analysis of cases and controls in relation to selected cardiovascular risk factors are provided in Table 8.
TABLE 8: ANALYSIS OF CASES AND CONTROLS IN RELATION TO SELECTED
CARDIOVASCULAR RISK FACTORS
Risk factor No.Cases*% No.Controls% P value Family history
YES 13 18.57 6 20.00
NO 57 81.43 24 80.00
0.9114 (ns)
Total 70 100.00 30 100.00
Smoking among males
YES 18 42.86 4 25.00
NO 24 57.14 12 75.00
0.3421 (ns)
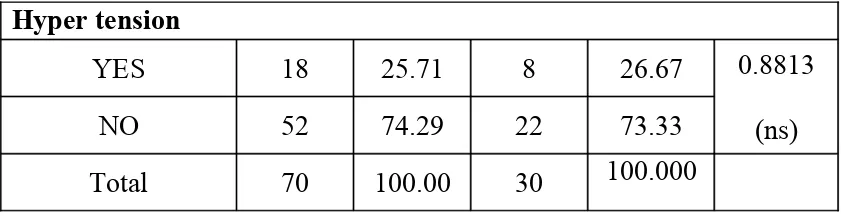
Hyper tension
YES 18 25.71 8 26.67
NO 52 74.29 22 73.33
0.8813 (ns)
Total 70 100.00 30 100.000
0
There was no significant difference between cases and controls in relation to selected cardiovascular risk factors.
Distribution of cases and controls in relation to serum uric acid:
[image:49.612.69.493.56.164.2]Mean serum uric acid in the study population was 5.26±1.39. Mean serum uric acid in the control group was 3.54±0.62. The details are shown in the table 9.
TABLE 9:
GENDERWISE SERUM URIC ACID LEVEL IN DIABETICS AND CONTROLS
The serum uric acid levels in diabetics were very much high when compared with controls and it was highly significant.
Analysis of gender distribution with serum uric acid among the cases:
The mean serum uric acid value in males was 5.45±1.47 whereas in females it was 4.97±1.23.The details are shown in table 10.
TABLE 10:
In the study group mean serum uric acid values were higher in males than in females but the difference was not statistically significant (Table 10).
Analysis of hyperuricemia in cases and controls:
[image:50.612.52.501.282.516.2]Hyperuricemia is defined as serum uric acid level ≥7mg/dl in males and ≥6.5 mg/ dl in females.
TABLE 11:
HYPERURICEMIA AMONG DIABETICS AND CONTROLS
Hyperuricemia Cases* Controls
No. % Mean SD No. % Mean SD
Positive 8 11.43 7.675 0.615 0 - -
-Negative 62 88.57 4.94 1.129 30 100 3.54 0.62
* p = 0.0001 (significant)
Body Mass Index (BMI)
TABLE 12:
SERUM URIC ACID VALUES WITH REGARD TO BMI AMONG CASES
Serum uric acid value in relation to waist hip ratio (WHR):
Uric acid level increases with increasing WHR. WHR was considered abnormal if ≥1.0 in men, ≥0.9 in females.
Thirty six cases with abnormal WHR had mean uric acid values 5.92±1.31.
Thirty four cases with normal WHR had mean uric acid values 4.55±1.11. The details are shown in table 13.
TABLE 13:
WAIST HIP RATIO AND HYPERURICEMIA
Mean serum uric acid levels were positively correlating with WHR.
Smoking and serum uric acid among the cases (only in males):
The mean value of serum uric acid level in smokers was 5.07±1.119, while it was 5.73+1.65 among non-smokers (Table 14).
TABLE 14:
URIC ACID LEVELS IN RELATION TO SMOKING
(ONLY IN MALES)
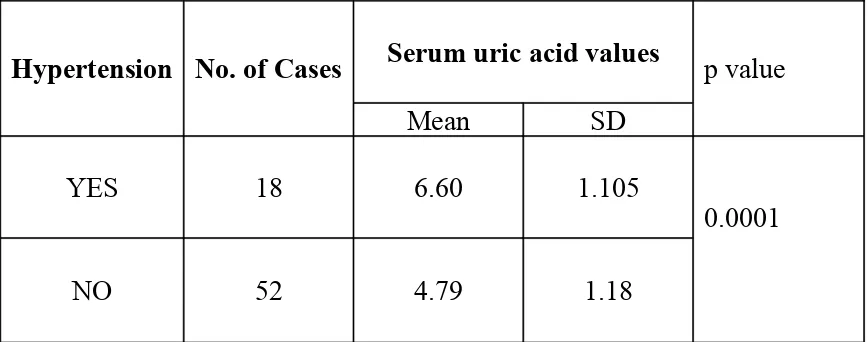
Serum uric acid values in hypertensive patients:
[image:53.612.51.485.213.384.2]The total number of hypertensive in the cases group was 18. The details are shown in table 15.
TABLE 15:
SERUM URIC ACID VALUES IN RELATION TO HYPERTENSION
Hypertension No. of Cases Serum uric acid values
Mean SD
p value
YES 18 6.60 1.105
NO 52 4.79 1.18
0.0001
The mean serum uric acid level in the hypertensive group was 6.60±1.105.The mean serum uric acid level in the non hypertensive group was 4.79±1.18. The difference between the two groups was statistically significant (Table 15).
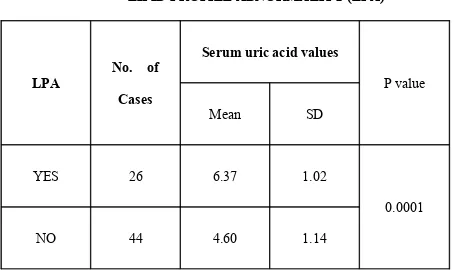
Serum uric acid in relation to lipid profile abnormality:
TABLE 16:
SERUM URIC ACID VALUES IN RELATION TO
LIPID PROFILE ABNORMALITY (LPA)
LPA
No. of
Cases
Serum uric acid values
Mean SD
P value
YES 26 6.37 1.02
NO 44 4.60 1.14
0.0001
Gender wise Serum triglyceride level among cases:
[image:55.612.54.477.248.419.2]The serum triglyceride level in males was 149.81±26.83. The serum triglyceride level in females was 154.65±29.37. The difference between the two groups was not statistically significant (Table 17).
Table 17: Gender wise serum triglyceride values among cases
Sex Serum triglycerides
Mean SD P value
Male 149.81 26.83
Female 154.65 29.37
CAD and Hyperuricemia:
Number of patients with ischemia- 14.
The mean serum uric acid level in ischemia group was 6.75±1.203. Of this only 5 had hyperuricemia which includes 4 males and 1 female.
Number of patients with infarction- 4.
The mean serum uric acid level in infarction group was 7.3±0.96. Of this only 2 had hyperuricemia which includes 1 male and 1 female.
Percentage of hyperuricemia in infarction (50%) is higher than in ischemia (35.71%). The details are shown in tables 18&19.
TABLE 18: CAD VS SERUM URIC ACID VALUES
CAD
No. of
patients
Serum uric acid values
Mean SD
p value
Ischemia 14 6.75 1.203
Infarction 4 7.3 0.96
[image:56.612.53.514.391.643.2]0.391 (ns)
CAD
No. of
patients
Total no. of
hyperuricemia
Male Female
Ischemia 14 5 4 1 35.71
Infarction 4 2 1 1 50.00
Serum Uric acid in relation to duration of diabetes:
MEAN SERUM URIC ACID LEVEL IN LONGER DURATION
[image:59.612.51.497.281.473.2]Mean serum uric acid level in longer duration (8-12 years) diabetes was 6.47 ±1.07. Mean serum uric acid level in shorter duration (2-4 years) diabetes was 4.30 ±0.77. The details are shown in table 20.
TABLE 20:
DURATION OF DIABETES (DOD) AND HYPERURICEMIA
DOD *
(Years) No. of patients
Hyperuricemia
Mean SD
2-4 12 4.30 0.77
5-8 31 4.57 1.01
9-12 27 6.47 1.07
* 2-4 vs. 5-8 yrs --- p = 0.356 (ns) 2-4 vs. 9-12 yrs --- p = 0.0001 5-8 vs. 9-12 yrs --- p = 0.0001
Uric acid level increases with increasing duration of diabetes and it was statistically significant.
DISCUSSION
diseasecompared with healthy controls.However, hyperuricemia is also associated with possible confounding factors including elevated serum triglyceride and cholesterol concentrations, blood glucose, fasting and post-carbohydrate plasma insulin concentrations, waist-hip ratio and body massindex.
There are certain clinical clustering groups with increased cardiovascular risk, which have associated hyperuricemia.
• Non-diabetic patient groups with accelerated atherosclerosis,
• T2DM patient groups with accelerated atherosclerosis,
• Congestive heart failure patient groups with ischemic cardiomyopathy, metabolic syndrome patients,
• Renal disease patient groups,
• Hypertensive patient groups,
• African American patient groups,
• Patient groups taking diuretics,
• Patient groups with excessive alcohol usage.
The four major players in the MS are hyperinsulinemia, hypertension, hyperlipidemia, and hyperglycemia. Each member of this deadly quartet has been
demonstrated to be an independent risk factor for CHD and capable of working together in a synergistic manner to accelerate both non-diabetic atherosclerosis and the atheroscleropathy associated with MS, PD, and T2DM.
In a like manner, hyperuricemia, hyperhomocysteinemia, ROS, and highly sensitive C- reactive protein (hsCRP) each play an important role in expanding the
quartet does not stand alone but interacts in a synergistic manner resulting in the progression of accelerated atherosclerosis and arterial vessel wall remodelling along with the original players.
In this study serum uric acid levels in diabetes was examined. Uric acid as a marker of CAD in combination with other risk factors which includes Metabolic Syndrome components was examined.
A control group consisting of non diabetics was also examined. Both the groups were age and sex matched. Uric acid levels and age were independent.
Duration of the diabetes positively correlated with uric acid levels. Uric acid
levels increase with increasing duration of diabetes and the association was statistically significant. Yoo et al. (2005) and Becker and Jolly (2006) reported that hyperglycemia was a remarkable risk factor for hyperuricemia. In a study of 3 681 Japanese adult, it was found that an elevation of serum uric acid concentration in males increased the risk of type 2 diabetes (Nakanishi et al., 2003). It was concluded that hyperuricemia was positively associated with hyperglycemia.
In the present study males have higher uric acid level when compared to females. The mean uric acid levels in males and females were 5.45±1.47 and 4.97±1.28 respectively although then difference was not statistically significant. The possible reason may be due to oestrogen promoting uric acid excretion (Sumino et al., 1999).
with BMI<25. The difference was statistically significant. Waist hip ratio is an important measure of obesity especially central obesity. Waist circumference >102 cm in males and >88 cm in females is abnormal. In this present study the mean serum uric acid levels in patients with abnormal WHR and normal WHR were 5.91±1.31 and 4.55±1.11 respectively and the difference was statistically significant.
Hyperuricemia has been associated with increasing body mass index (BMI) in recent studies and are even apparent in the adolescent youth [92-95].
Leptin levels are elevated and associated with insulin resistance in MS and early T2DM. Bedir A et al. have recently discussed the role of leptin as possibly being a regulator of SUA concentrations in humans and even suggested that leptin might be one of the possible candidates for the missing link between obesity and hyperuricemia (76).
In the present study uric acid levels were significantly elevated in patients with dyslipidemia. The mean serum uric acid level in patients with elevated serum
Phosphoribosylpyrophosphate (PPRP) is an important metabolite in this respect. Its availability depends on ribose-5-phosphate (R-5-P), the production of which is governed by glycolytic flux. Diversion of glycolytic intermediates toward R-5-P, PPRP, and uric acid will follow if there is diminished activity of GA3PDH (glyceraldehyde-3-phosphate dehydrogenase), which is regulated by insulin. Serum triglyceride concentrations may also increase, as might be expected from accumulation of glycerol-3-phosphate. Thus, intrinsic defects in GA3PDH and a loss of its responsiveness to insulin, by causing accumulation of glycolytic intermediates, may explain the association between insulin resistance, hyperuricemia, and hypertriglyceridemia (Leyva et al., 1998).
In the present study serum uric acids were significantly raised in patients with hypertension. The mean uric acid levels in diabetics with hypertension and non
hypertensive were 6.6±1.105 and 4.79±1.18 respectively. The difference was statistically significant. Lin KC et al. were able to demonstrate that blood pressure levels were predictive for cardiovascular disease incidence synergistically with serum uric acid level [96]. Two separate laboratories have demonstrated the development of systemic
hypertension in a rat model of hyperuricemia developed with an uricase inhibitor (oxonic acid) after several weeks of treatment [97,98]. This hypertension was associated
oxide synthase (nNOS) and renin changes were also prevented by maintaining uric acid levels in the normal range with allopurinol or benziodarone (uricosuric). These above models have provided the first challenging evidence that uric acid may have a pathogenic role in the development of hypertension, vascular disease, and renal disease
[99].
[image:64.612.61.518.537.655.2]The total number of patients with ischemia and infarction in the study group were 14, 4 respectively. The mean serum uric acid levels in these patients were 6.75±1.20 and 7.3±0.96 respectively. Total number of hyperuricemic patients (serum uric acid>7 mg/dl in males, >6.5 mg/dl in females) were 5 in ischemic group and 2 in infarction group. Percentage of hyperuricemia is higher in patients with infarction than in patients with ischemia. In present study 78.57% of diabetic patients have serum uric acid >4 mg/dl, while only 23.3% of control group have serum uric acid >4 mg/dl (table 21). So serum uric acid >4 mg/dl should be considered as a Red Flag in those patients at risk for cardiovascular disease.
Table 21: Cases and controls in relation to uric acid.
Serum uric acid Cases Controls
No. Percentage No. Percentage
<4mg 15 21.43 23 76.7 >4mg 55 78.57 7 23.3
P value: 0.0001 (significant)
that serum uric acid concentrationsare higher in patients with established coronary heart disease compared with healthy controls.103Elevated serum uric acid concentrationsare
also found in healthy offspring of parents with coronary artery disease, indicating a possible causal relationship. However, hyperuricemia is also associated with possible confounding factors including elevated serum triglyceride and cholesterol concentrations, blood glucose, fasting and post-carbohydrate plasma insulin concentrations, waist-hip ratio and body mass index.104,105About one quarter of
hypertensive patients have co-existent hyperuricaemia106 and, interestingly,
asymptomatic hyperuricemia predicts future development of hypertension, irrespective of renal function.
Some studies have suggested that the importance of uric acidmay be independent of confounding risk factors. Multivariateanalysis of data from the MONICA cohort of 1044 males showed a significant association between raised serum uric acid and cardiovascular mortality, independent of body mass index, serum cholesterol concentration, hypertension, diuretic use, alcohol intake and smoking habits.99The
In contrast to these findings, several studies have suggested that the relationship between elevated serum uric acid and cardiovascularrisk does not persist after correcting for other risk factors.The British Regional Heart Study of 7688 men aged 40 to 59 years showed a significant association between elevated serum uric acid and fatal and non-fatal coronary disease over a mean 16.8 years (107). However, this relationship
disappeared after correcting for other risk factors, particularly serum cholesterol concentration.The Coronary Drug Project Research Group studied 2789 men, aged30 to 64 years, and found that the association between increased cardiovascular risk and elevated serum uric acid concentration was not significant after consideration of other risk factors,and when thiazide diuretic use was considered (108).
CONCLUSION
• Serum uric acid levels were significantly elevated in diabetic population.
• The serum uric acid level was independent of age and smoking status (in males).
• Mean serum uric acid levels were high in males.
• Significant positive correlation between serum uric acid levels and Body Mass Index as well as Waist Hip Ratio was noted.
• Elevated serum uric acid levels were significantly noted among those with 1. BMI>25,
2. WHR abnormality,
3. Dyslipidemia with high triglycerides, 4. Hypertension.
• Serum uric acid levels increased with increasing duration of diabetes.
• Serum uric acid levels in diabetic patients with CAD were significantly higher.
• Serum uric acid above 4 mg/dl in diabetic population is a marker or risk factor for
CAD.
RECOMMENDATIONS
• Multiple factors are associated with increased uric acid levels.
• Routine annual estimation of uric acid among diabetics from the identification of diabetes will help the clinician to find out the adequacy of
iii. Development of hypertension.
Diabetic patients with raised serum uric acid levels should be carefully monitored for CAD as well as other vascular episodes.
• A meticulous control of blood sugar, hypertension, body mass index, dyslidemia
SUMMARY
An epidemiological link between elevated serum uric acid and an increased cardiovascular risk has been recognized for manyyears. Observational studies show that serum uric acid concentrations are higher in patients with established coronary heart diseasecompared with healthy controls.However, hyperuricemia is also associated with possible confounding factors including elevated serum triglyceride and cholesterol concentrations, blood glucose, fasting and post-carbohydrate plasma insulin concentrations, waist-hip ratio and body massindex.
Diabetes mellitus is strongly associated with hyperuricemia. The present study was proposed to assess the uric acid status in patients with diabetes mellitus and to find its association with age, gender, BMI, WHR, smoking, dyslidemia, hypertension and CAD.
With rigid criteria patients were selected carefully and evaluated after getting institutional, ethical clearance and informed consent. 70 cases and 30 healthy age, sex matched individuals were kept as control.
Serum uric acid levels were significantly higher in cases when compared to the control population. In the study group, BMI above 25 were seen in 47.14% of cases, while in control group only 13.33% had BMI >25. BMI>25 significantly correlated with hyperuricemia. Similarly abnormal high WHR positively correlated with hyperuricemia.
serum uric acid in males was high compared to females. Smoking was not significantly associated with higher uric acid levels. Patients with longer duration of diabetes also had elevated uric acid levels.
Factors contributing to hyperuricemia in diabetes are:
• Hyperinsulinemia reduces urinary uric acid excretion and sodium excretion.
• Micro vascular disease in diabetes mellitus causes local tissue ischemia and decreased renal blood flow. Ischemia increases lactate production that blocks urate secretion in proximal tubules.
BIBLIOGRAPHY
BIBLIOGRAPHY
1. King H, Rewers M. Global estimates for prevalence of diabetes mellitus and impaired glucose tolerance in adults. WHO Ad Hoc Diabetes Reporting Group.
Diabetes Care 1993; 16:157–177.
2. Fagot-Campagna A, Pettitt DJ, Engelgau MM, et al. Type 2 diabetes among North American children and adolescents: an epidemiologic review and a public health perspective. J Pediatr 2000; 136:664–672.
3. Dabelea D, Pettitt DJ, Jones KL, et al. Type 2 diabetes mellitus in minority children and adolescents. An emerging problem. Endocrinol Metab Clin North Am 1999; 28:709–729.
4. Dabelea D, Hanson RL, Bennett PH, et al. Increasing prevalence of type II diabetes in American Indian children. Diabetologia 1998; 41:904–910.
5. Kaufman FR. Type 2 diabetes mellitus in children and youth: a new epidemic.
J Pediatr Endocrinol Metab 2002;15[Suppl 2]:737–744.
6. Expert Committee on the Diagnosis and Classification of Diabetes Mellitus: Follow-up report on the diagnosis of diabetesmellitus. Diabetes Care 26:3160–3167, 2003.
7. Gavin JR III, Alberti KGMM, Davidson MB, et al. Report of the Expert Committee on the Diagnosis and Classification of Diabetes Mellitus. Diabetes Care 1997;20:1183–1197.
8.WHO Consultation Group. Definition, diagnosis and classification of diabetes mellitus and its complications, 2nd ed. Part 1: Diagnosis and classification of diabetes mellitus WHO/NCD/NCS/99. Geneva: World Health Organisation, 1999:1–59.
9.Edelstein SL, Knowler WC, Bain RP, et al. Predictors of progression from impaired glucose tolerance to NIDDM: an analysis of six prospective studies.
Diabetes 1997;46:701–710.