“A STUDY TO ASSESS THE EFFECTIVENESS OF STRUCTURED TEACHING PROGRAMME ON KNOWLEDGE REGARDING
ARTERIAL BLOOD GAS ANALYSIS AMONG THE STAFF
NURSES WHO ARE WORKING IN ICU OF VINAYAKA MISSION HOSPITAL AT SALEM ”.
By
D. THULASIMANI
Dissertation Submitted to the
THE TAMILNADU DR MGR MEDICAL UNIVERSITY
Chennai, Tamil Nadu.
In partial fulfillment
of the requirements for the degree of
Master of Science
in
Medical – Surgical Nursing
(Cardio Vascular and Thoracic Nursing)
“A STUDY TO ASSESS THE EFFECTIVENESS OF STRUCTURE
TEACHING PROGRAMME ON KNOWLEDGE REGARDING
ARTERIAL BLOOD GAS ANALYSIS AMONG THE STAFF
NURSES WHO ARE WORKING IN ICU OF VINAYAKA
MISSION HOSPITAL AT SALEM ”.
Approved by DMIPSR College Research Committee
Principal : ... Prof. R. Vasanthi, M.Sc., (Nursing), Professor in Pediatric Nursing,
Principal, DMIPSR College of Nursing, Sakthi Nagar, Bhavani, Erode-638 315.
Research Guide : ... Asst.Prof. M. Anand, M.Sc., (Nursing), Medical Surgical Nursing Department, Vice Principal, DMIPSR College of Nursing, Sakthi Nagar, Bhavani, Erode-638 315.
Medical Guide :... Dr. C. Ragunath, MD., I.D.C.C.M, Consultant Physician, ICU Intensivist, KMCH ,
Erode – 638 002.
A Dissertation submitted to
The Tamil Nadu Dr. M.G.R. Medical University, Chennai In partial fulfillment of the requirement for
Degree of Master of Science in Nursing
VIVA VOCE :
1. INTERNAL EXAMINER: ...
2. EXTERNAL EXAMINER:...
ENDORSEMENT BY THE PRINCIPAL / HEAD OF THE
INSTITUTION
This is to certify that the dissertation entitled “A Study to Assess the Effectiveness of Structured Teaching Programme on Knowledge regarding
Arterial Blood Gas Analysis among the Staff nurses who are working in
ICU of Vinayaka Mission Hospital at Salem”. is a bonafide research work done by D. Thulasimani, under the guidance of Asst. Prof. Mr. M. Anand, Msc,(N) Department of Medical Surgical Nursing.
Seal and Signature of the Principal. Prof. R. Vasanthi, M.Sc., (Nursing)
Professor in Pediatric Nursing,
ENDORSEMENT BY THE RESEARCH GUIDE AND HOD
This is to certify that the dissertation entitled “A Study to Assess the Effectiveness of Structure Teaching Programme on Knowledge regarding
Arterial Blood Gas Analysis among the Staff nurses who are working in
ICU of Vinayaka Mission Hospital at Salem” is a bonafide research work done by D. Thulasimani in partial fulfillment of the requirement for the degree of Master of Science in Nursing (Medical Surgical Nursing).
Seal and Signature of the Research Guide and HOD.
Mr. M. Anand, M.Sc., (N)
Department of Medical and Surgical Nursing Vice Principal, DMIPSR College of Nursing, Sakthinagar, Bhavani Taluk,
Erode - 638315
Date :
LIST OF CONTENT
Sl.
No. TITLE
Page No.
1. INTRODUCTION 1
2. REVIEW OF LITERATURE 9
3. METHODOLOGY 24
4. ANALYSIS AND INTERPRETATION 37
5. DISCUSSION 63
6. SUMMARY, CONCLUSION AND RECOMMENDATION 66
7. BIBLIOGRAPHY 71
LIST OF TABLES
Sl.No. TITLE Page
No.
1. Demographic profile 38
2.
Assess the pretest and posttest knowledge of experimental group of staff nurses regarding ABG analysis knowledge score
44
3.
Assess the pretest and posttest knowledge of experimental group of staff nurses regarding ABG analysis Overall knowledge score
44
4.
Assess the pretest and posttest knowledge of experimental group of staff nurses regarding ABG analysis Level of knowledge
45
5. Assess the pretest and posttest knowledge of control group of staff nurses regarding ABG analysis knowledge score
47
6.
Assess the pretest and posttest knowledge of control group of staff nurses regarding ABG analysis Overall knowledge score
47
7. Assess the pretest and posttest knowledge of control group of staff nurses regarding ABG analysis Level of knowledge
48
8. Comparison of pretest & posttest ABG analysis knowledge score(experimental)
50
9. Comparison of overall knowledge score (experimental) 50
10. Comparison of pretest & posttest ABG analysis Knowledge score(control group)
11. Comparison of overall knowledge score (control group) 54
12. Comparison of experiment & control group overall knowledge score
56
13. Effectiveness of structured teaching programme 57
14. Association between pretest level of knowledge and their demographic variables( experimental)
58
15. Association between posttest level of knowledge and their demographic variables (experimental)
59
16. Association between pretest level of knowledge and their demographic variables( control)
61
17. Association between posttest level of knowledge and their demographic variables (control)
LIST OF FIGURES
Sl.No. FIGURES Page
No.
1. Conceptual Frame work 23
2. Schematic representation of the research design 36 3. Bar diagram showing distribution of age among the experimental
and control group of staff nurses. 39
4. Pie diagrams showing distribution of sex among the experimental
and control group of staff nurses 40
5. Bar diagram showing distribution of educational qualification
among the experimental and control group of staff nurses 41
6. Pyramid diagram showing distribution of years of experience
among the experimental and control group of staff nurses 42
7. Cone diagram showing distribution of area of experience among the
experimental and control group of staff nurses 43
8. Cylinder diagram showing comparison of experimental group of
pretest and post test knowledge regarding ABG analysis 46
9. Bar diagram showing comparison of control group of pretest and
post test knowledge regarding ABG analysis 49
10. Box Plot compares the experimental group staff nurses pretest and
posttest knowledge score on ABG analysis 51
11. Line diagram compares the experimental group staff nurses pretest
and posttest knowledge score on ABG analysis 52
12.
Box Plot compares the control group staff nurses pretest and
posttest knowledge score on ABG analysis 55
13. Line diagram compares the control group staff nurses pretest and
posttest knowledge score on ABG analysis 55
14.
Bar diagram showing comparison of pretest and posttest knowledge
score among the experimental and control group staff nurses
regarding ABG analysis
56
15. Cylinder diagram showing effectiveness of structure teaching
group of staff nurses regarding ABG analysis
16. Pyramid diagram shows association of experimental group staff
nurse’s of post test level of knowledge with their age group 60
17. Cylinder diagram shows association of experimental group staff
LIST OF ANNEXURE
S. NO CONTENT
1 Letter Seeking permission to conduct Pilot Study 2 Letter Seeking permission to conduct Main Study 3 Letter seeking expert opinion on Validity of the Tool 4 Certificate of Content Validity by the Medical Guide 5 Tool for Data Collection
ABBREVIATIONS
M.Sc.,(N) Master of Science (Nursing)B.Sc., Bachelor of Science
GNM General Nursing Midwives
DMIPSR Dharmarathnakara Dr.Mahalingam Institute of Paramedical Sciences and Research
[image:11.595.96.524.156.717.2]Prof. Professor HOD Head of the Department
Fig Figure H1, H2 Research Hypothesis
ICU Intensive care unit n Total number of samples
No. Number p Probability r Reliability
S.D Standard Deviation
S Significant
NS Not Significant
x2 Chi-Square Test
% Percentage STP Structured Teaching Programme ABG Arterial Blood Gas
H+ Hydrogen
P(H) Hydrogen Ion Concentration PaO2 Partial pressure of Oxygen
PaCo2 Partial pressure of Carbon-di-oxide
HCO3 Bicarbonate
ACKNOWLEDGEMENT
Glorious and majestic are his deeds, and his righteousness endures forever..
I express my atmost gratefulness to Lord God Almighty for his grace
throughout the study
I am immensely grateful to Sri Sri Sri Balagangadharanatha Maha
swamiji, Trustee and Dr. N. Mahalingam, Chairman, Dharmarathnakara Dr. Mahalingam Institute of Paramedical Sciences & Research, for giving me an
opportunity to undertake the course at Dharmarathnakara Dr. Mahalingam Institute of Paramedical Sciences & Research Sakthi Nagar.
My heartfelt thanks to Sri B.T.Ramachandra, Correspondent,
Dharmarathnakara Dr. Mahalingam Institute of Paramedical Sciences & Research, for his encouragement, inspiration, support as well as for providing all facilities for successful completion of this study.
I express my gratitude and appreciation to Prof. Mrs. R. Vasanthi, M.Sc(N), Principal and Head of the department of Child Health Nursing, DMIPSR College of Nursing, Sakthi Nagar, Bhavani, Erode for her suggestions and timely support through out the study.
I extend my sincere thanks to AsstProf. M. Anand Msc (N),Vice-principal,
Department of Medical Surgical Nursing, DMIPSR College of Nursing Sakthinagar,
that have always been a source of inspiration.
It gives me great pleasure to thank with deep sense of gratitude and respect,
my guide Asst Prof.M. Anand Msc (N), Department of Medical Surgical Nursing,
Dharmarathnakara Dr. Mahalingam Institute of Paramedical Sciences and Research for his inspiring guidance, suggestions, timely help, constant encouragement and co
-operation for the completion of this study.
I extend my sincere gratitude to Mrs. Gnana Dhinahari, M.Sc (N), Lecturer ofDMIPSR, for her timely advice and guidance.
My sincere gratitude to Prof. Mrs. Pushphalatha, HOD of Medical and Surgical Nursing Department, Shanmuga College of Nursing, for her guidance, constant encouragement and valuable advice.
I owe much to the benevolent attitude, meticulous guidance, brilliant suggestions and statistical advice in transferring the raw data of this study in to valuable findings given by, Prof. Mr.Venkatesan, HOD in Department of statistics.
Dr. Mahalingam Institute of Paramedical Sciences and Research for their timely
assistance, cooperation and support throughout the period.
My sincere thanks to all the experts who have contributed with their valuable suggestions in validating the tools.
I am truly grateful to all the Participants who formed the core and basis of this
study for their wholehearted co-operation.
I am proud to acknowledge the love, support and prayers of my parents
Mr.T.Duraisamy and Mrs.Soudeeshwari and beloved brothers
Mr. Krishnamoorthy, Mr. Anbazhagan in every phase of the study.
I also extend my thanks to Mrs. T.S.Sumithra Devi, M.A., M.Phil Who edited the study.
My sincere thanks to all my Classmates and friends, Asst. Prof. Jayaseelan,
for making me successful in all the encounters and difficulties faced during the study.
My special regards and sincere thanks to my specialty mates who were always
presents with their timely help, love, support and suggestions throughout the study.
ABSTRACT
STATEMENT OF THE PROBLEM:
“A STUDY TO ASSESS THE EFFECTIVENESS OF STRUCTURED TEACHING PROGRAMME ON KNOWLEDGE REGARDING ARTERIAL BLOOD GAS ANALYSIS AMONG THE STAFF NURSES WHO ARE WORKING IN ICU OF VINAYAKA MISSION HOSPITAL AT SALEM ”.
OBJECTIVES OF THE STUDY:
To assess the pretest and posttest knowledge of experimental and control
group of staff nurses regarding ABG analysis.
To compare the pretest and posttest knowledge of experimental and control group regarding ABG analysis.
To implement and evaluate the STP regarding ABG analysis
To find out the association between the knowledge of experimental and
control group with selected demographic variables.
METHODS:
District. Demographic Data, structured knowledge questionnaire and self report method were used for data collection procedure. The tool was finalized by consulting five experts in the field of medical and nursing. Pilot study was done for its clarity, un ambiguity and feasibility on similar subject. To analyze the experimental data, statistical analysis was used. Demographic data of the staff nurses were presented in graphs. Association of variables was tested by Karl Pearson Chi-Square test.
MAJOR FINDINGS OF THE STUDY:
The findings of the study showed that Over all knowledge of experimental group it shows that the have improved their knowledge from 41.50% to 81.93%. The over all knowledge of control group shows that in pretest they had 40.75% and in post test they had 42.00%, The Overall comparison of pretest and posttest knowledge for experiment group was 16.6% to 32.77%. Hence the posttest group had more knowledge is more than pretest. The Overall comparison of pretest and posttest knowledge for control group was 16.3% and 16.80%, this shows that there is no improvement was found.
The association between demographic variables with knowledge of experimental and control group shows that age and years of experience are significant with posttest knowledge
KEY WORDS:
CHAPTER I
INTRODUCTION
‘Accident investigation takes the mystery out of working safely’
-Marcon group Ltd
Normal function of body cells depends on regulation of the hydrogen (H+) concentration within very narrow limits. If the H+ levels exceed these normal limits acid-base imbalances result and are recognised clinically as abnormalities of serum P(H). Because of acid-base imbalances may be caused by disorders of any body system . Their incidence in clinical settings is quite high.
The status of acid-base homeostasis may be monitored clinically through the serial measurement of arterial blood gases (ABGs) among the parameters reported are P(H), PaCo2 and HCo3. These values may be used to determine the presence of type of acid base imbalances and evaluate the level of compensation. These disorders are not clinical diagnosis or diseases in themselves rather, they are clinically syndromes, associated with a wide variety of diseases.
The same distinction may be made between the terms alkalosis and alkalemia, alkalosis indicates a primary condition resulting in excess base in body and alkalemia refers more narrowly to elevation of serum pH.
Brunner (2004) USA Stated that in 2000 In USA the incidence of post operative respiratory failure rate estimated that 8.66 per 1,000 elective surgery. The Americans have been estimated the incidence of asthma is 10.6 million and 12.7 million COPD now the COPD is sixth leading cause of death and 12th leading cause of morbidity at world wide.
Margie.J. Hanson (2004), New Delhi Stated that the incidence of acid-base imbalance is high in clinical setting, In general hospital among 110 consecutive admission among that the overall incidence of acid-base imbalances respiratory alkalosis [26 cases] Followed by respiratory acidosis [16] metabolic alkalosis [10] and metabolic acidosis [6] had more than one acid base imbalance concurrently.
All India Institute of Medical Science (2002) New Delhi Stated that postoperatively collected data of patient with respiratory failure admitted to medical ICU. In that type II respiratory failure [90.2%] number of patient had previous hospitalization as well as intubations 39% and 18.3% respectively. Almost 55% of the patients had evidence of car pulmonale 67% pneumonia 3.7% was pneumothorax.
detects the onset of adverse pulmonary effects. It gives rapid confirmation of ventilator setting changes and resuscitation and helps to ensure precise adjustment of therapy.
NHLBI (1999) USA Stated thatIn USA death rate of respiratory failure is 3,597 per year, 69 permonth, 9 perweek, In United States estimated that 3,55,000 people are diagnosed annually for pulmonary disorder. Regulating in as many as 24,000 deaths per year. The current death rate 40% for respiratory failure, 90% mortality rate for clients with acute respiratory distress syndrome.
NEED FOR THE STUDY:
The arterial blood gases is one of the most important investigation for assessment of clinical oxygenation and acid-base status in critically ill patients, it provides us with information about ventilation, oxygenation, and acid-base status.
[Cardio Thoracic centre Pune (2004)]
improved among both nurses and nursing students. So these data should be taken in to consideration when training nurses to perform arterial puncture
Corbridge.et.al(2008) Germany they conducted the study to assess the effectiveness of teaching module specific to arterial blood gas interpretation among the staff nurses of health memorial hospital at germany, they found that stff nurses knowledge is increased significantly after viewing the teaching module they concluded that the teaching module is nessay for provind continuing education to nurses.
Coggon J.M (2008), Newyork states that Arterial Blood Gas analysis is valuable diagnostic tool as it enables the objective evaluation of a patient’s oxygenation, ventilation and acid-base balance. Such information demonstrates how well a patients respiratory and metabolic system are working. Within the current health care climate patients being nursed in all clinical areas are becoming sicker, It is not unusual for a nurse to care for patients who need frequent arterial blood gas tests, so it has become necessary for nurses to interpret the results of these tests. This will enable medical staff to be rapidly alerted to any potential problems and care to be tailored to the exact needs of the patient.
Graham Williamson describe a competency based education and training programme for nurses to carry out this procedure.
Allen K (2005) Nursing Times, stated that arterial blood gas analysis can be complex. However, in many clinical areas the nurse is one of the first to see the results. So they need to know whether immediate actions required, this articles stated that guideline for ABG interpretation is useful to the nurses even when all the complexities are not fully understood.
Simpson H. (2004) Nursing Times stated that arterial blood gas analysis has become an essential skill for all healthcare practitioners. It provides important information with regard to adequacy of ventilation, oxygen delivery to the tissues and acid-base balance. If the nurse having proper skill regarding arterial blood gas analysis can able to provide appropriate nursing intervention, and medical consultation.
Cheng YJ. Kao EL (2003), Nursing times, statedthat The study find out that whether Arterial Blood Gas (ABG) analysis is helpful for deciding on the best management plan in the study results concluded that ABG data can help the nurse to make the right decision about treatment.
Russell JM (1991), Australia stated that understanding acid-base disturbances is essential in the care of the critically ill patient. Through systemic evaluation of patient symptoms and arterial blood gas value, patient care can be improved. These formulas can be effective tools for the nurse to use in the care of patients with acid-base imbalances.
Rabichoud-Ekstrnds (1990) Journal of cardiovascular nursing stated the acid-base problems can be easily identified by the nurse when a systematic approach is utilized during arterial blood gases interpretation. Understanding acid-base balance assist the nurse in choosing the appropriate intervention, since the nurse in is the primary care giver and is most readily available for the client, early interventions to correct acid-base problems would expedite the client’s recovery. so the nurse understood the ABG report and interpretation is very essential skill to provide appropriate intervention.
STATEMENT OF THE PROBLEM:
OBJECTIVES OF THE STUDY:
1. To assess the pretest and posttest knowledge of experimental and control group of staff nurses regarding ABG analysis.
2. To compare the pretest and posttest knowledge of experimental and control group regarding ABG analysis.
3. To implement and evaluate the STP regarding ABG analysis
4. To findout the association between the knowledge of experimental and control group with selected demographic variables.
HYPOTHESIS:
H1 – There is significant difference between pretest and posttest knowledge of
experimental group regarding ABG analysis.
H2- There is a significant difference between posttest knowledge of experimental
and control group.
H3– There is a significant association between the knowledge of staff nurses with
selected demographic variables .
ASSUMPTIONS:
OPERATIONAL DEFINITIONS:
Structured teaching programme:
It is systematically developed instruction and teaching aids designed from a group of staff nurse to provide information regarding ABG analysis.
Knowledge:
Facts, information, and skills acquired by a person through experience or educator. The theoretical person through experience or educative, the theoretical or practice understanding of a subject.
ABG analysis:
A measurement of oxygen, carbon dioxide, as well as pH 0% the blood that provides a means of assessing the adequacy ventilation (PaCo2) oxygenation (PaO2).
Staff Nurse:
An experimental nurses less than a charge nurse with specific qualification as GNM or B.Sc, (N).
LIMITATIONS
1. The study is limited to 6 weeks period only.
2. The study is not generalized since it includes only the staff nurses who are working in ICU staff nurses of Vinayaka Misssion Hospital, Salem.
CHAPTER- II
REVIEW OF LITERATURE
INTRODUCTION:
Review of literature is a key step in research process. Review of literature refers to an extensive and systemic examination of publications relevant to the research project. Nursing research may be considered and continuing process in which knowledge is gained from earlier studies an integral parts of research in general.
According to Polit and Hungler refers to the activities involved in searching for information on a topic and developing a comprehensive picture of the state as knowledge on that topic.
Purposes are to
To determine what is already known about the topic that the researcher wish to
study.
It helps to build on previous knowledge in the research process
A literature source will serve as that basis for the topic
It helps the researcher to decide whether to replicate a study or not
It is necessary to narrow the problem to be studied.
It helps to plan the study methodology
It helps to select the research methods and research tools
REVIEW OF LITERATURES DIVIDED IN TO THE FOLLOWING HEADINGS:
Section- AÆGeneral Information on Arterial Blood Gas analysis
Section- B Æ Review of literature related to knowledge of Arterial Blood Gas analysis.
SECTION- A:
GENERAL INFORMATION ON ARTERIAL BLOOD GAS ANALYSIS:
Vijaya Sekaran L. (2001), Switzerland Stated that, Arterial blood gas analysis is a important monitoring for treating the critically ill patients. Many serious acid-base disturbances can co-exist without significant clinical manifestations. In children with acute disorders of respiratory system, circulatory system, gastrointestinal system and renal system underlying acid-base disturbances are inevitable. These should be identified at the earliest and attempts made to maintain normal homeostasis till the organ function, recovers, arterial blood gas analysis reveals oxygenation status, adequacy of ventilation and acid-base balance. It plays a significant role in documenting and monitoring respiratory failure, especially during ventilator and oxygen therapy.
The results from an ABG will indicate how well a patient’s respiratory system is working. However, ABG can offer more than just information on the respiratory system they also indicate how well a patients kidneys and other internal organs [The metabolic system] are functioning.
Although all of the data in an ABG analysis can be useful. It is possible to interpret the results accurately without considering ill of the values. It is only essential to consider a maximum of six values.
- Hydrogen ion concentration (pH)
- Oxygen saturation (SaO2)
- Oxygen concentration (PaO2)
- Carbon dioxide concentration (PCo2)
- Bicarbonate ion concentration (HCo3)
- Base excess (BE)
Arterial Blood Gas:
Purpose of ABG analysis:
¾ For accurate assessment of acid-base status
¾ For assessing degree of oxygenation of blood and adequacy of alveolar ventilation
¾ To know the respiratory function of body.
¾ For providing immediate intervention for respiratory disorders.
REVIEW RELATED TO HYDROGEN ION CONCENTRATION (pH):
The hydrogen ion concentration (pH) provides information on acid-base balance. This relates to how much acid or alkali a patient had in their blood. The pH scale indicates the concentration of hydrogen ions. The normal level of pH is 7.35-7.45. If the pH level decrease less than 7.35-7.45 that is known as Acidemia and the pH the level Increase more than 7.45 that is known as Alkalemia.
Review related to oxygen saturation (SaO2):
Saturation (SaO2) measures how well the haemoglobin in the blood is saturated, the SaO2 value derived from a blood gas is very similar to the SPO2 values gained from pulse oximetry. The only difference is that in a blood gas we are measuring the saturation of arterial blood SaO2 and in pulse oximetry we are measuring the saturation of peripheral capillary blood (SPO2) the normal range is 95-100%.
Seguin P, et al [2000], France states that The comparison between the pulse oximery saturation [SPO2] with arterial blood gas saturation [SaO2] obtained during clinical routine examination, study findings concludes that SaO2 ranged from 87 to 99% and SPO2 ranged from 92% to 100%. Based on this result the author concluded that before defining Fio2 with SpO2 the materials used daily must be evaluated.
Review related to (PaO2):
This is partial pressure of oxygen dissolved within the arterial blood will determine oxygen binding to haemoglobin (SaO2). The normal level of PaO2 is 80-100mmHg. The PaO2 low level is low to80/ it indicates hyoxemia.
Rudiger M, (2005), Germany, this study explains that PaO2 are important monitoring parameters in intensive care units. The study survey shows that the use of transcutaneous monitors to measure the PaO2 remains widespread among German. ICUS, the earlier data suggesting that their use had been abandoned in many ICUS worldwide in addition, we suggest that the current method of monitoring oxygenation may not prevent hypoxemia.
Review related to PaCo2:
This is the partial pressure of carbon dioxide dissolved within the arterial blood. It is used to assess the effectiveness of ventilation. The normal level for PaCo2 is 35-45mg. If the normal level is reduced below 35 mm Hg that is known as respiratory alkalosis, the PaO2 level is Increased than 45 mm Hg that is known as respiratory acidosis.
Florian Floss (2008), France the study explained there are three different methods to determine PCO2 during transport are available, arterial blood gas analysis (PaCO2) end-tidal [PetCO2] and transcutaneous [PtCCO2] measurement.
who either require a tight control of PCO2 or endured lengthy transportation could benefit greatly from the combination of expiratory capnorgraphy with mobile arterial blood gas analysis or the transcutaneous measurement of PCO2.
Review related to HCO3:
HCO3 is the chemical formula for bicarbonate, and alkali. It is the main chemical buffer in plasma and alludes the body’s metabolic status. It takes in to account bicarbonate produced as a result of respiratory failure the normal HCO3 is 22-26 meq/L, the HCO3 is level decreased below 22 meq/L that is known as metabolic acidosis the level is Increased above 26 meq/L that is known as metabolic alkolosis.
V. Kumar, (2008),New Delhi Roche dia gnostics center conducted the study regarding comparison of measured and calculated Bicarbonate value, the study findings shows that In the majority of instances the HCo3 concentration calculated from ABG measurements provided a good estimate of the measured venous HCo3 concentration, the calculated HCo3 values may provide effective means for detecting systematic errors in either procedures.
Review related to Base excess (BE):
Paake MJ, White GH (2002) Express laboratory south path finders medical centre stated that as part of arterial blood gas analysis, base excess is often reported as a measure of non-respiratory acid-base disturbance. Most blood gas analysers offer, the option of calculating either the base excess of the blood sample or the base excess of the extracellular fluid (ECF). We report a case that illustrates that selecting the physiologically appropriate parameter avoids the potential for misinterpretation, of acid-base data, we recommend that the base excess of the ECF is the appropriate metabolic blood gas parameter for clinical use.
SECTION – B:
REVIEW OF LITERATURE RELATED TO KNOWLEDGE OF ABG ANALYSIS:
Chen CZ, Hsiue TR (2003), Department of Internal medicine, college of Medicine National University Tainan, Stated that arterial blood gas analysis knowledge is useful in evaluation of the clinical condition of critically ill patients, however, arterial puncture or insertion an arterial catheter may be used for arterial blood gas analysis, Through this we can evaluate pH, partial pressure of carbon dioxide PaCo2 and partial pressure of oxygen PaCo2 and bicarbonate, (HCo3) and predict the ABG analogs for patients with acute respiratory failure treated by mechanical ventilation in an intensive care unit.
Day TK (2002) Louisville veterinary specially and emergency services USA stated that evaluation of both arterial and central venous blood can be valuable in monitoring the critically ill veterinary patient. The traditional approach, which concentrates on arterial blood gas analysis only, may miss important aspects of oxygen delivery to tissues, especially in patients with poor perfusion, the advances that have resulted in affordable bedside blood gas analyzers have created a clinical situation in which blood gas analysis should be an integral part of critical care monitoring and assessing both the arterial and central venous samples should results in more efficient and higher quality care for critically ill patients.
Shoulders Odom.B.(2000) Dimens critical care of nursing ,cardiology department USA, stated that the arterial blood gas (ABG) analysis, one of the most common tests ordered provides clinicians with valuable information on a patient’s oxygenation and acid-base balance. Interpreting ABG analysis results can be challenging, even for the most experienced practitioners, because it requires knowledge of the physiology and cause and effects relationship of the disturbances. Applying the principles ,and the ABG algorithm described in this article will provide nurses with a systematic way to Interpret uncomplicated arterial blood gas results, including primary, mixed and compensated acid -base disturbances.
Capovilla J. Miller (2000) critical care nursing Napa Valley College Napa, California, Stated that In the clinical setting, knowledge of noninvasive blood gas monitoring has become the standard of care over arterial puncture, Technology has provided ways to measure both arterial oxygen (PaO2) and arterial carbon dioxide (PaCO2) with the availability of non invasive blood gas monitoring, patient care and comfort is improving and cost saving are being implemented, Overall non-invasive monitoring can aid in the diagnosis of some pulmonary diseases and monitor patient progress.
Coleman (1999) Australia nursing journal stated that information about acid-base balance is to be useful, we need to know how to interpret arterial blood gas [ABGs] so we can intervence rapidly when the body is unable to restore a normal acid-base balance in the face of an overwhelming derangement.
hospital cardiac arrest. In emergency patients alternative methods fail to detect severe disturbances of the patients oxygen and / or carbon dioxide status and the acid-base balance management of prehospital. Cardiac arrest could be optimized by the routine use of blood gas analysis.
Faria SH, (1997) Journal of vascular Nursing stated, that many clinical nurses find the concept of acid/base balance confusing. The nurse can use the further step approach in ABG interpretation. In addition, the components at ABGs [pH1 PCo2 and HCo3] are essential, metabolic and respiratory abnormalities [Acidosis and alkalosis] related cause and signs &symptoms. By using this approach, the nurse can analyze the ABG values confidently and make a wise choice about appropriate nursing actions.
Zimmerman (1996) critical care clinic’s, Baylor college of medicine, USA stated that arterial blood gas (ABG) measurement are one of the most frequently requested laboratory examinations in critically ill patients, ABGs include measurement of pH1, PaCo2 and Oxyhemoglotion saturation these measurements allows for assessment often nature, progression, and severity of metabolism and respiratory disturbances.
Robichaud – (1990) “Journal of cardiovascular nursing stated that acid-base problems can be easily identified by the nurse when a systematic approach is utilized during arterial blood gas interpretation. By intervening early, many emergency situation can be avoided, since the nurse is the primary care giver, and is most readily available for the client, early interventions to correct acid-base problems would expedite the client’s recovery.
Shapiro, BA. (1988), Critical Care Clinics, Northwestern University Medical College, Illinois, stated that a clinically relevant presentation of interpretation of arterial blood gas measurement in the critically ill patient is presented. Oxygenation deficits are discussed in relation to differentiation of pulmonary, cardiovascular, and metabolic causes gas measurement and interpretation is very essential skill for nurses who are working in ICU.
CONCEPTUAL FRAME WORK
Conceptualization refers to the process of developing an refining abstract.
Creasla. J.L. et.al. (1991) stated that a conceptual model gives a clear picture for logical thinking for systemic observation and interpreting the observed data. The model also gives direction for relevant questions on phenomena and points out solution to practical problems.
A conceptual model frame work deals with the concept of the research problems assembled together to provide certain frame of reference. The frame work helps and guide the researcher to gain in sight in to the problem by explaining the relationship between the facts.
To describe the relationship of concepts in the study, open system mdoel by J.W. Kenny’s was used. Open system model serves as a model for reviewing people as interrupting with the environments. Open system model is a set of related definitions, assumptions and prepositions which deals with reality as an integrated hierarchy, system model focuses in each system as a, whole, but, pays particular attention to the interaction of its part or subsystems. A system is a group of elements that interact with one another in order to achieve a goal.
The following are the major concepts of the theory:
Throughout is the use of structured questionnaire by structured teaching programme.
Output is the expected outcome that was obtained by assessing the knowledge through structured questionnaire, the output was considered in times of change in post-test knowledge scores obtained through structured questionnaire.
Feed Back:
-
Input
Demographic Variables Age Sex
Qualification
Area of
experience
Years of
experience Pretest Assess the knowledge regarding ABG analysis Experimental Control Group Structure Teaching Programme
Definition
Purposes
Indication
Contraindication
Principles
Procedure
Interpretation
Throughput Post Test Assess the knowledge regarding ABG analysis Experimental Control Group Output Positive outcomes Significant Improvement in level of knowledge
Negative outcome No Significant improvement in the level of knowledge
Positive Outcome Negative outcome Moderately Adequate level of knowledge
Negative output InAdequate level of knowledge
[image:39.595.102.798.65.431.2]Feed Back No intervention
CHAPTER III
METHODOLOGY
Research methodology is the systematic way to solve the research problem. Pearson (1992) stated that there is no short cut to truth. There is no way to gain knowledge of universe except through the gate way of scientific method. Methodology is one which enables the researcher to project a blue print of the research undertaken.
The research methodology presents the research approach and the research design. The design of the study describes about the setting of the study, population the sample and sampling technique. The data collection technique, content validity and reliability of tools. Pilot study, and methods of data analysis based on the statement.
Research approach:
The research approaches adopted for this research study is an Quantitative approach. It helps to understand the effect of independent variables on the dependent variables. So the above mentioned research approach is suitable for the study.
Research design:
[Polit DF, Hungler 1999]
For this study the research design choosen is quasi experimental design which includes
pre-test, post test control group design. The design was used for assessing the level of knowledge of staff nurses regarding ABG analysis. It will be achieved through the comparison between two groups. The groups are experimental and control group.
The schematic representation of research design:
A quasi - experimental design, which include manipulation, control and no randomization.
GROUP
PRE ASSESSMENT
INTERVENTION
POST ASSESSMENT
Experimental O1 X O2
Control O1 - O2
Key: O1 – Pre assessment
X -- Structured teaching programme
VARIABLES:
Variables are the qualities, properties or the characteristics of the person, things or situation that change or vary. The variables mainly include in this study are Independent and Dependent variables Dependent variables explain the effect of independent variables.
I. Independent variables:
Independent variables is the variable which is not dependent on any other, In this study the independent variable refers to structured teaching programme, on ABG analysis.
II. Dependent variables:
The Dependent variable is the variable that the researcher is interested in understanding explaining or predicting . In this study the dependent variable refers to gain the knowledge of staff nurses towards ABG analysis who are working in selected hospitals at Salem.
POPULATION:
SAMPLE:
Sample refers to a subject of a population that is selected to participate in a particular study. It is a portion of the population. Which represents the entire population, Hence the researcher selected sample from staff nurses working in ICU of Vinayaka Mission Hospital, Salem.
SAMPLE SIZE:
The sample comprises of 60 staff nurses [30 experimental, 30 control] who met the inclusion criteria and working in ICU of Vinayaka Mission Hospital, Salem.
SAMPLING TECHNIQUES:
The investigator selected subjects by Purposive sampling technique.
SITE AND SETTINGS:
Site:
Site is the exact physical location where the study was conducted.
Setting:
Setting is the physical location of the site in which data collection takes place.
Present study was conducted at selected ICU of Vinayaka Mission Hospital, Salem, Tamilnadu.
CRITERIA FOR SAMPLE SELECTION:
Inclusion criteria:
¾ Staff nurses who are working in ICU of Vinayaka Mission Hospital, Salem.
¾ Staff nurses who are completed GNM and B.Sc Nursing.
¾ Staff nurses who are available at the time of study period.
Exclusion Criteria:
¾ Staff nurses who are on night shift.
¾ Staff nurses who are in leave.
¾ Staff nurses who are not willing to participate in this study.
DEVELOPMENT OF DATA COLLECTION INSTRUMENT:
The major task of the researcher is to develop instrument that accurately and precisely to measure the variables of interest. Questioning allows the gathering of large sample. Relatively quickly and inexpensively. It avoids interviewer bias, offers, anonymity and the cost effective data collection method, that is self report.
To assess the knowledge of staff nurses a questionnaire was prepared based on objectives of the study by the investigator, after reviewing and considering literature on ABG analysis, based on the opinion of the nursing experts.
Data Collection Instrument:
Data collection instrument used was
Structured questionnaire [Pre-test and Post-test]
Structured teaching programme
Data collection method:
¾ Data collection method was used was Self report method.
Description of data collection instruments:
The instrument used for data collection was Structured questionnaire which consists of 3 sections.
Section -2 – Structured knowledge questionnaire
i). Introduction regarding ABG analysis
ii). Procedure regarding arterial puncture
iii). Reference range and interpretation
Section -3 – Structured teaching programme on ABG analysis
Section 1 – Demographic data:
It consists of selected demographic variables like age, sex, qualification, area of experience, years of experience that was taken.
Section 2 : Structured Knowledge questionnaire:
A questionnaire to assess the level of knowledge of the subjects on ABG analysis.
It consists of 40 items, All the items were multiple choice questions it divided into the areas like basic knowledge regarding ABG analysis.
• Introduction - 5
• Procedure - 16
• Interpretation - 19
Level of knowledge based on score
LEVEL OF
KNOWLEDGE PERCENTAGE OF SCORE ACTUAL SCORE
Inadequate <50% 0 – 20 score
Moderate 51%-75% 21 – 30 score
Adequate 75%-100% 31 -40 score
i). Introduction regarding ABG analysis:
It consists of 5 Items, All the items were multiple choice questions. A score (1) for the correct answer and a score (0) for the incorrect answer was awarded.
ii). Procedure regarding arterial puncture:
It contains 16 questions related to procedure regarding Arterial puncture which was multiple choice questions.
For correct answer a score is (1) and Incorrect answer a score is (0).
iii). Reference range and interpretation:
Section -3 – Structured teaching programme on ABG analysis
Teaching programme was titled as structured teaching programme on ABG analysis it was organized to previous headings.
i) Introduction of ABG analysis
ii) Definition of ABG analysis
iii) Purpose of ABG analysis
iv) Indications for ABG analysis
v) Contraindications for ABG analysis
vi) Limitations or principles for ABG analysis
vii) Article needed for ABG analysis
viii) Procedure for arterial puncture
ix) Interpretation of ABG value
p(H), SaO2, PaO2, PaCo2, HCO3, BE
Content Validity:
Reliability:
The reliability is the degree of consistency or accuracy with which an instrument measures on attribute that is supposed to measures.
In order to establish reliability of the tool. It was administered to 5 staff nurses those not in sample area, Reliability of the tool was established through test and retest method.
Pilot study:
The pilot study is a small preliminary investigation of the same general character as the major study. It is designed to acquaint the researcher with the problems to be corrected in preparation for the large research project and try out the problems for collecting the data. Pilot study was conducted to ensure validity and reliability of the tool and feasibility for giving intervention.
The pilot study was conducted in KMCH hospital, Erode From 1.11.09 to 7.11.09.. After getting formal permission through principal. 6 samples were taken during the pilot study. They were selected by using purposive sampling method. In that 3 sample in experimental group and 3 in control group who fulfilled the selection selectioncriteria other than the main study sample area.
DATA COLLECTION PROCE
The study was conducted in Vinayaka Mission hospital From 11.11.09 to 30.11.09 after getting written permission was from Vinayaka Mission Hospital, Medical Director and Cardio Thoracic Surgeon, Nursing Superintendent, then the researcher introduced herself & explain about the study and purposes of study to the staff nurses. Researcher select the sample according to the selection criteria by using purposive sampling technique method. Then the researcher introduced herself to the staff nurses and developed a good rapport. The researcher assured the participants for the confidentiality of their response.
A pretest was conducted by the researcher by providing Structured questionnaire to experimental and control group of staff nurses on knowledge on ABG analysis for 15-20 mts. After that researcher distributed structured teaching programme to the experimental group .
After 7 days, the post test was administered to the experimental and control group staff nurses for 15-20 minutes regarding knowledge on ABG analysis using the same questionnaire.
PLAN FOR STATISTICAL ANALYSIS
The data analyzed was based on the objectives of the study using descriptive and inferential statistics.
Frequencies and percentages for the analysis of the demographic data.
Paired ‘t’ test and Chi-square used for association between the selected
demographic variables of knowledge and practice score.
PLAN FOR DATA ANALYSIS
S.No. Data Analysis Methods Remarks
1. Descriptive Mean, Standard deviation
percentage
Assess the level of knowledge, regarding ABG analysis
2. Inferential statistics
paired‘t’ test
Chi-square test
compare the pretest and posttest knowledge of ABG analysis among the experimental and control group
Analyse the association between knowledge with demographic variables
ETHICAL CLEARANCE
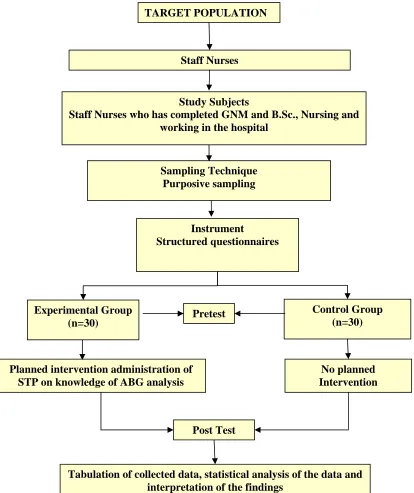
Fig. 2: SCHEMATIC REPRESENTATION OF THE STUDY DESIGN
TARGET POPULATION
Staff Nurses
Study Subjects
Staff Nurses who has completed GNM and B.Sc., Nursing and working in the hospital
Sampling Technique Purposive sampling
Instrument
Structured questionnaires
Control Group
Experimental Group Pretest
(n=30) (n=30)
Planned intervention administration of STP on knowledge of ABG analysis
No planned Intervention
Post Test
CHAPTER- IV
ANALYSIS AND INTERPRETATION
Kerlinger (1995) defines analysis as the categorizing ordering manipulating and summarizing of data to obtain answers to research question. The purpose of analysis is to reduce the data into interpretable form so that relations of research problem can be studied and tested.
This chapter deals with analysis and interpretation of the information collected from 60 staff nurses working in Vinayaka Mission hospital at Salem.
DESCRIPTION OF DATA ANALYSIS:
The analysis of the data is organized and presented under the following broad headings,
Section I: Description of study subjects by demographic characteristics.
Section II: Analysis of pre test and posttest knowledge of experimental group of staff nurses regarding ABG analysis.
Section III: Analysis of pre test and posttest knowledge of control group of staff nurses regarding ABG analysis.
Section IV: Comparison of pretest and posttest knowledge of experimental and control group staff nurses regarding ABG analysis.
SECTION I
[image:54.595.96.523.187.648.2]FREQUENCY AND PERCENTAGE DISTRIBUTION OF DEMOGRAPIC CHARACTERISTICS:
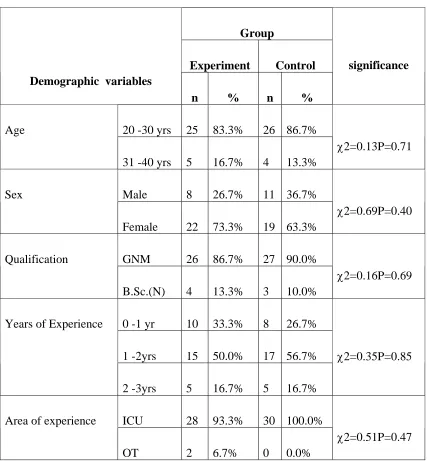
Table 1: DEMOGRAPHIC PROFILE
Group
Experiment Control Demographic variables
n % n %
significance
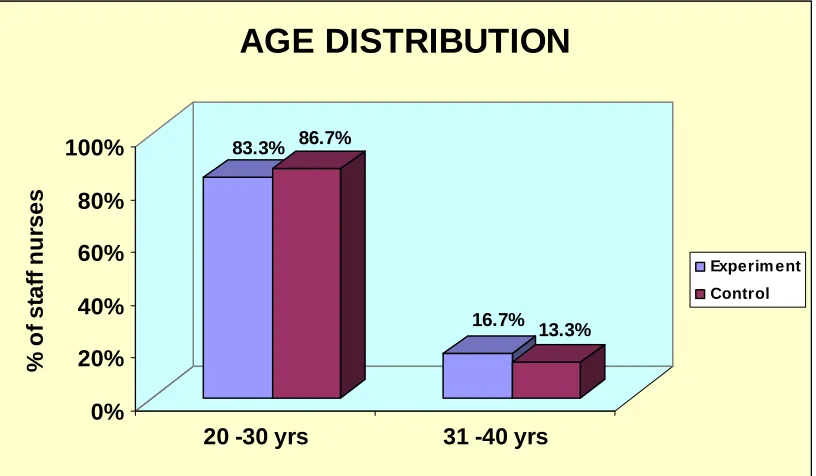
20 -30 yrs 25 83.3% 26 86.7% Age
31 -40 yrs 5 16.7% 4 13.3%
χ2=0.13P=0.71
Male 8 26.7% 11 36.7% Sex
Female 22 73.3% 19 63.3%
χ2=0.69P=0.40
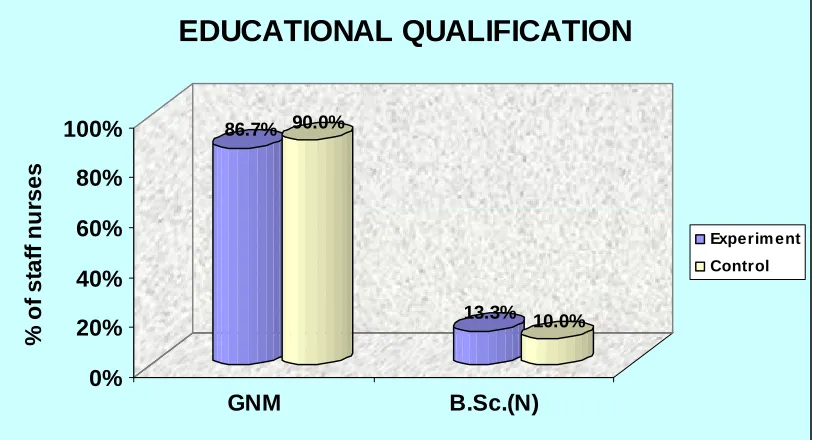
GNM 26 86.7% 27 90.0% Qualification
B.Sc.(N) 4 13.3% 3 10.0%
χ2=0.16P=0.69
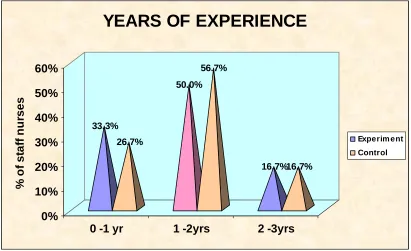
0 -1 yr 10 33.3% 8 26.7%
1 -2yrs 15 50.0% 17 56.7% Years of Experience
2 -3yrs 5 16.7% 5 16.7%
χ2=0.35P=0.85
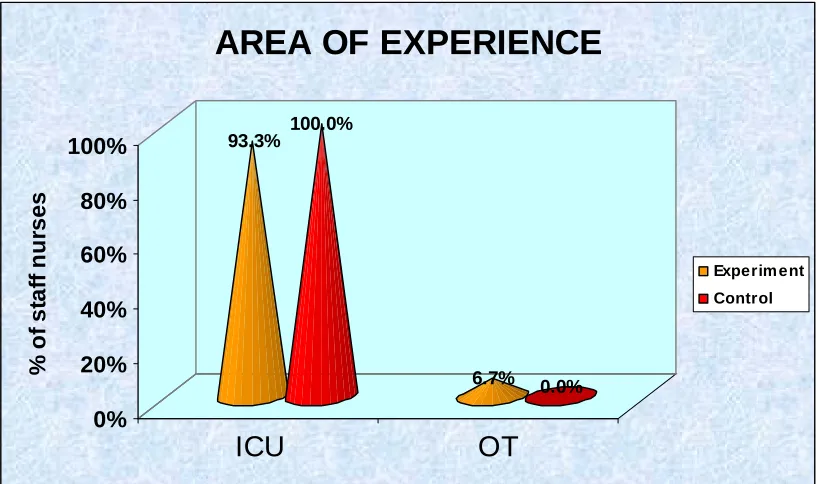
ICU 28 93.3% 30 100.0% Area of experience
OT 2 6.7% 0 0.0%
χ2=0.51P=0.47
arterial blood gas analysis among the staff nurses who are working in ICU of Vinayaka Mission hospital at Salem.”
Statistical analysis shows that there is no statistically significant difference between experimental and control group. It means both groups are similar. It was calculated using Pearson chi-square test/Yates corrected chi-square test.
83.3% 86.7%
16.7% 13.3%
0% 20% 40% 60% 80% 100%
%
o
f st
af
f n
u
rses
20 -30 yrs 31 -40 yrs
AGE DISTRIBUTION
[image:55.595.106.514.249.487.2]Experim ent Control
Fig. 3: Bar diagram showing distribution of age among the experimental and control group of staff nurses.
Fig.4.: Pie diagram showing sex distribution among experimental and control group of staff nurses
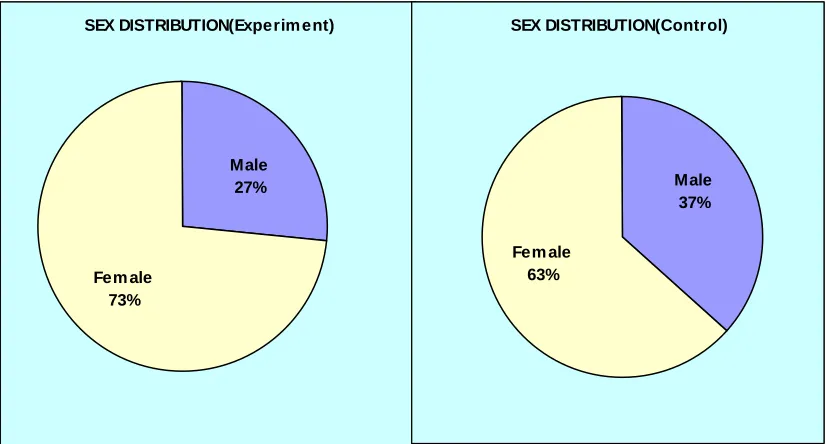
Fig. 4: Pie diagrams showing distribution of sex among the experimental and control group of staff nurses.
SEX DISTRIBUTION(Experim ent)
Male 27%
Fem ale 73%
SEX DISTRIBUTION(Control)
Male 37%
Fem ale 63%
According to sex 73% female and 27% male in experimental and in control
Fig. 5: Cylindrical diagram showing distribution of educational qualification among the experimental and control group of staff nurses
86.7% 90.0%
13.3% 10.0%
0% 20% 40% 60% 80% 100%
%
o
f st
af
f n
u
rses
GNM B.Sc.(N)
EDUCATIONAL QUALIFICATION
Experim ent Control
Fig. 6: Pyramid diagram showing distribution of years of experience among the experimental and control group of staff nurses
33.3% 26.7%
50.0% 56.7%
16.7%16.7%
0% 10% 20% 30% 40% 50% 60%
%
of
s
ta
ff
nur
s
e
s
0 -1 yr 1 -2yrs 2 -3yrs
YEARS OF EXPERIENCE
Experim ent Control
Fig. 7: Cone diagram showing distribution of area of experience among the experimental and control group of staff nurses
93.3% 100.0%
6.7% 0.0%
0% 20% 40% 60% 80% 100%
%
of
st
af
f n
u
rs
e
s
ICU
OT
AREA OF EXPERIENCE
Experim ent Control
SECTION II
TO ASSESS THE PRETEST AND POSTTEST KNOWLEDGE OF EXPERIMENTAL GROUP OF STAFF NURSES REGARDING ABG ANALYSIS
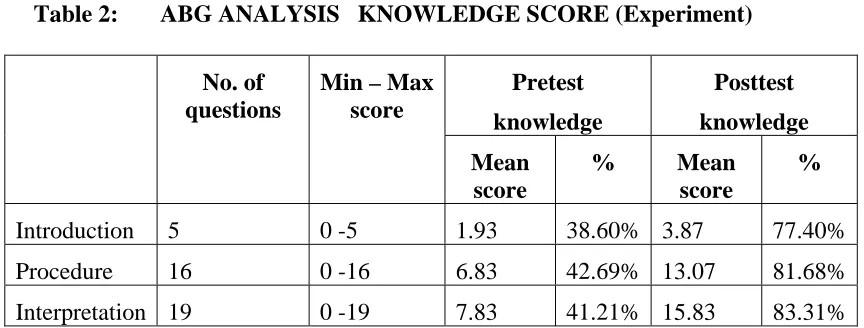
Table 2: ABG ANALYSIS KNOWLEDGE SCORE (Experiment)
Pretest knowledge Posttest knowledge No. of questions
Min – Max score Mean score % Mean score %
[image:60.595.93.525.216.380.2]Introduction 5 0 -5 1.93 38.60% 3.87 77.40% Procedure 16 0 -16 6.83 42.69% 13.07 81.68% Interpretation 19 0 -19 7.83 41.21% 15.83 83.31%
Table no.2 shows the experimental group staff nurses pretest and posttest knowledge score on each aspects of ABG analysis. In pretest staff nurses scored only poor score but in posttest they scored adequate score on ABG analysis questions.
Table 3: OVERALL KNOWLEDGE SCORE(Experiment)
Pretest
knowledge
posttest
knowledge
No. of
questions
Min – Max score
Mean score
% Mean score
%
Overall mean score
40 0 -40
16.60 41.50% 32.77 81.93%
score but in posttest they scored adequate score on ABG analysis. Overall knowledge score shows, they improved their knowledge from 41.5% to 81.93%.
Table 4: LEVEL OF KNOWLEDGE (Experiment)
Level of knowledge Pretest Posttest
Inadequate 27(90.0%) 0(0.0%)
Moderately Adequate 3(10.0%) 6(20.0%)
Adequate 0(0.0%) 24(80.0%)
Table no. 4 shows the pretest and posttest overall level of knowledge for experimental group. In pretest 90% of staff nurses are having inadequate knowledge regarding ABG analysis. In posttest none of the staff nurses are having inadequate knowledge regarding ABG analysis.
Score 0 - 40
< 50% inadequate knowledge = 0 – 20 score
51 -75% moderately adequate knowledge = 21 – 30 score
90.0%
10.0%
0.0% 0.0%
20.0% 80.0%
0% 20% 40% 60% 80% 100%
%
of
st
af
f nu
rs
e
s
Pretest
posttest
COMPARISON OF EXPERIMENTAL GROUP LEVEL OF KNOWLEDGE
[image:62.595.105.511.76.327.2]Inadequate Moderate Adequate
SECTION III
[image:63.595.97.523.177.415.2]TO ASSESS THE PRETEST AND POSTTEST KNOWLEDGE OF CONTROL GROUP OF STAFF NURSES REGARDING ABG ANALYSIS
Table 5: ABG ANALYSIS KNOWLEDGE SCORE(Control)
Pretest
knowledge
posttest
knowledge
No. of
questions
Min – Max score
Mean score
% Mean score
%
Introduction 5 0 -5 1.73 34.60% 1.80 36.00%
Procedure 16 0 -16 6.67 41.69% 6.77 42.31%
Interpretation 19 0 -19 7.90 41.57% 8.23 43.31%
[image:63.595.97.522.543.717.2]Table no.5 shows the control group staff nurses pretest and posttest knowledge score on each aspects of ABG analysis. In pretest, staff nurses scored only poor score and in posttest also they scored poorly on ABG analysis questions.
Table 6: OVERALL KNOWLEDGE SCORE(Control)
Pretest knowledge posttest knowledge No. of questions
Min – Max score
Mean score
% Mean score
%
Overall mean score
40 0 -40
Table no.6 shows the control group staff nurses pretest and posttest overall knowledge score on ABG analysis. In pretest staff nurses scored only poor score and in posttest also they scored poorly on ABG analysis. Overall knowledge score shows, they improved their knowledge from 40.75% to 42.00%.
Table 7: LEVEL OF KNOWLEDGE (Control)
Level of knowledge Pretest Posttest
Inadequate 26(86.7%) 25(83.3%)
Moderately Adequate 4(13.3%) 5(16.7%)
Adequate 0(0.0%) 0(0.0%)
Table no 7 shows the pretest and posttest overall level of knowledge for control group . In pretest 86.7% of staff nurses are having inadequate knowledge regarding ABG analysis. In posttest also 83.3% of the staff nurses are having inadequate knowledge regarding ABG analysis.
Score 0 - 40
86.7%
13.3%
0.0%
83.3%
16.7%
0.0%
0% 20% 40% 60% 80% 100%
%
of
st
af
f nur
s
e
Pretest
posttest
COMPARISON OF CONTROL GROUP
LEVEL OF KNOWLEDGE
[image:65.595.105.498.74.327.2]Inadequate Moderate Adequate
SECTION IV
TO COMPARE THE PRETEST AND POSTTEST KNOWLEDGE OF EXPERIMENTAL AND CONTROL GROUP REGARDING ABG ANALYSIS.
TABLE 8
COMPARISON OF PRETEST & POSTTEST ABG ANALYSIS KNOWLEDGE SCORE (EXPERIMENT)
Pretest knowledge Posttest knowledge Knowledge
Mean SD Mean SD
Student’s paired t-test
Introduction 1.93 0.87 3.87 0.73
t=13.49 P=0.001 significant
Procedure 6.83 1.58 13.07 1.14
t=16.97 P=0.001 significant
Interpretation 7.83 0.95 15.83 1.32
t =33.37 P=0.001 significant
Table no 8 Compares the pre and posttest knowledge score. It shows there is a significant difference between pretest and posttest score of staff nurses knowledge on all aspects of ABG analysis. It was analysed using student‘s paired t-test.
Table 9: COMPARISON OF OVERALL KNOWLEDGE SCORE (Experiment)
No. of
staff nurses
Pretest Mean±SD
Posttest Mean±SD
Student paired t-test
Overall
Knowledge Score
Table no 9 shows the comparison of overall knowledge score. On an average staff nurses are improved their knowledge from 16.6 to 32.77 on ABG analysis. Or we can say , in pretest they are able to answer only 17 questions, in posttest they are able to answer upto 33 questions. This improvement is statistically significant. it was analysed using student ‘s paired t-test.
posttes t pretest
M
e
a
n
K
n
ow
ledg
e
s
c
o
re
40
30
20
[image:67.595.136.526.229.487.2]10
EACH EXPERIMENT GROUP STAFF NURSES PRE AND POSTTEST KNOWLEDGE SCORE
0 10 20 30 40
1 2 3 4 5 6 7 8 9 10 11 12 13 14 15 16 17 18 19 20 21 22 23 24 25 26 27 28 29 30
M
e
a
n
k
n
ow
le
dg
e
s
c
or
e
[image:68.595.107.515.171.390.2]pretest posttest
TABLE 10
COMPARISON OF PRETEST & POSTTEST ABG ANALYSIS KNOWLEDGE SCORE(Control group)
Pretest knowledge Posttest knowledge Knowledge
Mean SD Mean SD
Student’s
paired t-test
Introduction 1.73 0.78 1.80 0.76
t=1.43 P=0.61
not significant
Procedure 6.67 1.54 6.77 1.72
t=1.00 P=0.32
not significant
Interpretation 7.90 2.16 8.23 1.79
t =1.87 P=0.06
not significant
Table 11: COMPARISON OF OVERALL KNOWLEDGE SCORE
(Control group)
No. of
staff nurses
Pretest
Mean±SD
Posttest
Mean±SD
Student paired
t-test
Overall Knowledge
Score
30 16.30 ± 2.95 16.80 ± 2.71 t=1.91 P=0.06
[image:70.595.96.507.157.333.2]significant
posttest pretest Mean k n ow ledge s c or e 24 22 20 18 16 14 12 10
Fig 12: Box Plot compares the control group staff nurses pretest and posttest knowledge score on ABG analysis
EACH CONTROL GROUP STAFF NURSES PRE AND POSTTEST KNOWLEDGE SCORE
0
10
20
30
40
1 2 3 4 5 6 7 8 9 10 11 12 13 14 15 16 17 18 19 20 21 22 23 24 25 26 27 28 29 30
[image:71.595.104.512.465.674.2]OVERALL KNOWLEDGE SCORE
Experiment group Control group Knowledge
Mean SD Mean SD
Student’s
Independent t-test
Pretest 16.60 1.98 16.30 2.95 t=0.46 P=0.64 not significant
[image:72.595.96.507.73.225.2]Posttest 32.77 1.79 16.80 2.71 t=26.91 P=0.001 significant
Table No 12 shows, Comparison of experiment and control group knowledge score, it was analysed using student ‘s independent t-test. In pretest there is no significant difference between experiment and control group, but after STP it is observed significant difference between experiment and control
PRE & POSTTEST KNOWLEDGE SCORE
16.6 16.3 16.8
[image:72.595.103.512.375.616.2]32.77 0 5 10 15 20 25 30 35 40 Experiment Control M ean kn o w le d g e sco re Pretest Posttest
Fig 14: Bar diagram showing comparison of pretest and posttest knowledge score among the experimental and control group staff nurses regarding ABG analysis
EFFECTIVENESS OF STRUCTURED TEACHING PROGRAMME
Pretest Posttest % of Difference Net
Benefit
Experiment 41.50% 81.93% 40.33% Knowledge
Control 40.75% 42.00% 1.25%
39.08%
Table no 13 shows the effectiveness of the STP Considering the overall score, Staff nurses gained 39 percent more knowledge on ABG analysis, after the administration of STP this 39 percent of knowledge gain is the net benefit of this study, which indicates the effectiveness of STP.
41.5% 40.8% 81.9% 42.0% 0% 10% 20% 30% 40% 50% 60% 70% 80% 90% % of know le dg e scor e Pretest Posttest
EFFECTIVENESS OF STP
[image:73.595.105.510.377.635.2]Experim ent Control
FIND OUT THE ASSOCIATION BETWEEN THE KNOWLEDGE OF EXPERIMENTAL AND CONTROL GROUP WITH SELECTED DEMOGRAPHIC VARIABLES
TABLE 14
ASSOCIATION BETWEEN PRETEST LEVEL OF KNOWLEDGE AND THEIR DEMOGRAPHIC VARIABLES( Experiment)
Pretest
Inadequate Moderate
n % n % Total
Chi square test/ Yates corrected chi square test 20-30 yrs 24 96.0% 1 4.0% 25
Age
31-40 yrs 3 60.0% 2 40.0% 5
χ2=2.66P=0.10 Not significant Male 8 100.0% 0 0 8
Sex
Female 19 86.4% 3 13.6% 22
χ2=0.17P=0.68 Not significant GNM 24 92.3% 2 7.7% 26
Qualification
B.Sc.(N) 3 75.0% 1 25.0% 4
χ2=0.03P=0.85 Not significant 0 -1 yr 9 90.0% 1 10.0% 10
1 -2yrs 15 100.0% 15 Years of Experience
2 -3yrs 3 60.0% 2 40.0% 5
χ2=1.15P=0.28 Not significant
ICU 26 92.9% 2 7.1% 28 Area of experience
OT
1 50.0% 1 50.0% 2
χ2=0.53P=0.46 Not significant
TABLE 15
ASSOCIATION BETWEEN POSTTEST LEVEL OF KNOWLEDGE AND THEIR DEMOGRAPHIC VARIABLES (Experiment)
Posttest
Moderate Adequate
n % n %
Total
Chi square test/
Yates corrected
chi square test
20-30 yrs 3 12.0% 22 88.0% 25 Age
31-40 yrs 3 60.0% 2 40.0% 5
χ2=6.00P=0.01
significant
Male 3 37.5% 5 62.5% 8 Sex
Female 3 13.6% 19 86.4% 22
χ2=0.86P=0.35
Not significant
GNM 5 19.2% 21 80.8% 26 Qualification
B.Sc.(N) 1 25.0% 3 75.0% 4
χ2=0.07P=0.78
Not significant
0 -1 yr 3 30.0% 7 70.0% 10
1 -2yrs 1 6.7% 14 93.3% 15 Years of Experience
2 -3yrs 2 40.0% 3 60.0% 5
χ2=8.54P=0.01
significant
ICU 5 17.9% 23 82.1% 28 Area of experience
OT 1 50.0% 1 50.0% 2
χ2=1.20P=0.27
[image:75.595.101.516.167.647.2]Not significant
12.0% 88.0% 60.0% 40.0% 0% 20% 40% 60% 80% 100% % of s ta ff nur s e s
20 -30 yrs 31 -40 yrs
ASSOCIATION BETWEEN LEVEL OF
KNOWLEDGE AND STAFF NURSES AGE
[image:76.595.106.513.72.336.2]Moderate Adequate
Fig 16: Pyramid diagram shows the. Association between posttest level of knowledge and staff nurses age
30.0% 70.0% 6.7% 93.3% 40.0% 60.0% 0% 20% 40% 60% 80% 100% % o f st af f n u rses
0 -1 yr 1 -2yrs 2 -3yrs
ASSOCIATION BETWEEN LEVEL OF KNOWLEDGE AND STAFF NURSES EXPERIENCE
Moderate Adequate
[image:76.595.105.512.414.661.2]TABLE 16
ASSOCIATION BETWEEN PRETEST LEVEL OF KNOWLEDGE AND THEIR DEMOGRAPHIC VARIABLES (Control)
Pretest
Inadequate Moderate
n % n % Total
Chi square test/ Yates corrected chi square test 20 -30 yrs 23 88.5% 3 11.5% 26
Age
31 -40 yrs 3 75.0% 1 25.0% 4
χ2=0.54P=0.46
Not significant Male 10 90.9% 1 9.1% 11
Sex
Female 16 84.2% 3 15.8% 19
χ2=0.27P=0.60
Not significant GNM 24 88.9% 3 11.1% 27
Qualification
B.Sc.(N) 2 66.7
![Fig 1: Conceptual frame work based on J.W. Kenny’s open system model [Modified] sources-management concepts and practice](https://thumb-us.123doks.com/thumbv2/123dok_us/1230744.75708/39.595.102.798.65.431/conceptual-frame-kenny-modified-sources-management-concepts-practice.webp)