JOURNAL OFVIROLOGY, 0022-538X/97/$04.0010
Mar. 1997, p. 2555–2561 Vol. 71, No. 3
Copyrightq1997, American Society for Microbiology
Host-Specific Driving Force in Human Immunodeficiency Virus
Type 1 Evolution In Vivo
LINQI ZHANG,1* RICARDO S. DIAZ,2DAVID D. HO,1JAMES W. MOSLEY,3MICHAEL P. BUSCH,2
ANDALLEN MAYER1,2
Aaron Diamond AIDS Research Center, The Rockefeller University, New York, New York 100161; Irwin Memorial Blood Centers,
San Francisco, California 941182; and Transfusion Safety Study, University of Southern California School of Medicine,
Los Angeles, California 900323
Received 31 May 1996/Accepted 9 December 1996
To investigate the process of human immunodeficiency virus type 1 (HIV-1) evolution in vivo, a total of 179 HIV-1 V3 sequences derived from cell-free plasma were determined from serial samples in three epidemio-logically linked individuals (one infected blood donor and two transfusion recipients) over a maximum period of 8 years. A systematic analysis of pairwise comparisons of intrapatient sequences, both within and between each sample time point, revealed a preponderance and accumulation of nonsynonymous rather than synony-mous substitutions in the V3 loop and flanking regions as they diverged over time. This strongly argues for the dominant role that positive selection for amino acid change plays in governing the pattern and process of HIV-1
envV3 evolution in vivo and nullifies hypotheses of purely neutral or mutation-driven evolution or completely chance events. In addition, different rates of evolution of HIV-1 were observed in these three different individuals infected with the same viral strain, suggesting that the degree of positive pressure for HIV-1 amino acid change is host dependent. Finally, the observed similar rate of accumulation in divergence within and between infected individuals suggests that the process of genetic divergence in the HIV epidemic proceeds regardless of host-to-host transmission events, i.e., that transmission does not reset the evolutionary clock.
A striking feature of human immunodeficiency virus type 1 (HIV-1) in vivo infection is the rapid generation and turnover of viral variants, resulting in a high degree of sequence diver-sity within and between infected individuals (5, 7, 10, 16, 18, 20, 21, 26, 33, 38, 40, 41). The rapid dynamics of HIV-1 replication in vivo is likely to be a consequence of intrinsic properties of the virus, such as a high replication rate and substantial num-bers of viral progeny produced per replication cycle (8, 15, 39). The cause of the high degree of sequence diversity in vivo, however, is much less well understood. It is fairly clear that the error-prone nature of the viral reverse transcriptase provides the biochemical basis for the observed viral variation. What determines the ultimate fate of a mutated variant genome, however, is controversial. One viewpoint is that the accumula-tion of specific variants is largely determined by their relative fitness in a given selective environment. Immune surveillance (16, 20, 26, 34, 41) and viral cell tropism (4, 31, 37) are exam-ples of plausible selective forces that may be shaping HIV diversity in vivo. Others discount the role of selection at the amino acid level and propose that the observed diversity could result from mutation-driven evolution (36), neutral evolution (14), or simply chance antigenic stimulation of lymphocytes carrying resident variant proviruses (38). Evidence that sup-ports the existence of some degree of selective pressure on the V3 region of HIV-1 env comes from analyses of Ka and Ks
values and theKa/Ksratio of sequence pairs, whereKais the
observed frequency of nonsynonymous substitutions per re-placement site andKsis the observed frequency of synonymous
substitutions per silent site (22–24, 28, 32, 33). The higher the value ofKaorKs, the more divergence there is between a pair
of sequences, and the higher theKa/Ksratio, the stronger the
selection pressure for amino acid change.
To quantify and assess the temporal pattern of selective constraints that might underlie the process of HIV-1 evolution in vivo, Bonhoeffer and colleagues (2) used HIV-1 plasma V3 sequence data from samples collected from an HIV-1-infected hemophiliac over a 7-year time period. These sequences were analyzed in terms of the changes inKa,Ks, and theKa/Ksratio
within each sampling point. TheKsvalue within each sampling
point was seen to increase over time, whereas the Ka value
remained roughly the same. Consequently, the Ka/Ks ratio
within each sampling point decreased over time, which is in-terpreted as being due to a gradually weakening selective pres-sure for amino acid sequence change as the patient’s CD4 counts dropped (2).
A circumstance consisting of the transfusion in 1985 of com-ponents derived from the same HIV-1-contaminated unit of blood into two recipients, followed by the enrollment of the donor and recipients in the Transfusion Safety Study (11), has allowed us to compare the evolution of the same HIV-1 strain in three different hosts, namely, the two recipients (A and B) and the actual blood donor. The V3 regions of genomes present in sequential plasma samples obtained from these three epidemiologically linked individuals over a maximum period of 8 years were sequenced (10a). To assess the intensity and pattern of the selective constraints exerted by different individuals on the same viral strain, we have used this sequence data to calculate both intra- and intersampleKa,Ks, and the
Ka/Ksvalues.
Details of the donor and the two patients, the transfusion event, and the sequential samples obtained from them as part of the Transfusion Safety Study (11) up to 8 years after the transfusion are given elsewhere (10a). A total of 179 HIV-1 RNA genomes derived from cell-free plasma were PCR am-plified for the V3 region after reverse transcription, as de-scribed in detail in reference 10a. V3 region sequences were * Corresponding author. Mailing address: Aaron Diamond AIDS
Research Center, Rockefeller University, 455 First Ave., 7th Floor, New York, NY 10016. Phone: (212) 725-0018. Fax: (212) 725-1126. E-mail: [email protected].
2555
on November 9, 2019 by guest
http://jvi.asm.org/
obtained by direct sequencing of nested PCR products derived from single cDNA molecules. Ten genomes were obtained from the serum of the original donated unit of blood, 53 genomes were obtained from six sequential donor follow-up plasma samples, 57 genomes were obtained from five sequen-tial recipient A plasma samples, and 59 genomes were ob-tained from six sequential recipient B plasma samples (Gen-Bank accession numbers U29433 to U29437, U29956 and U29957, U29959 to U30074, U30077 to U30145, U31573 to U31582, and U43035 to U43054). The 237-nucleotide-long sequences covered the entire V3 loop as well as flanking
re-gions. The average frequencies of synonymous (Ks) and
non-synonymous (Ka) nucleotide substitutions for all pairwise
[image:2.612.148.473.67.550.2]se-quence comparisons, both within and between samples, were calculated by the methods of Nei and Gojobori (29) and Li et al. (24). Because results obtained by these two methods were similar, only those calculated by the former method were used in the analysis. Intra- and intersample genetic distances were calculated with the program DNADIST, implemented in the PHYLIP package (version 3.5) (12). The Jukes-Cantor model of molecular evolution was used to correct for multiple substi-tutions in observed genetic distance, as well as in Ka andKs
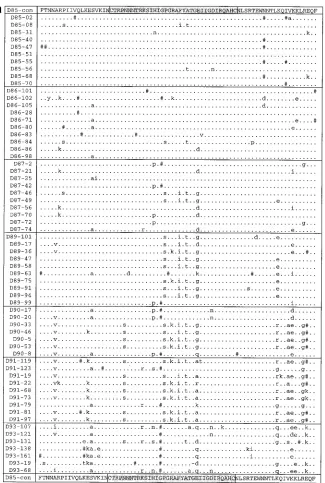
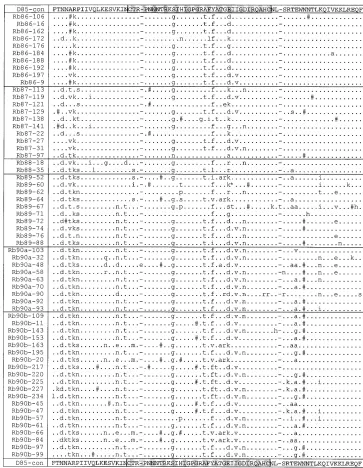
FIG. 1. The amino acid alignments of donor (a), recipient A (b), and recipient B (c) sequences are shown aligned with the consensus sequence obtained from the donation sample in 1985 (D85-con). Dots represent amino acid identity to the consensus, dashes indicate gaps introduced to preserve the alignment, and pound signs represent sites of synonymous substitutions. Nonsynonymous substitutions are indicated by lowercase letters. The V3 loop is highlighted. This figure is a modified version of Fig. 2 in reference 10a.
on November 9, 2019 by guest
http://jvi.asm.org/
(29). Regression curves were constructed by the program Curve Fitting, implemented in the DeltaGraph package (ver-sion 3.0) (9), and correlation coefficients (rvalues) were esti-mated by the principle of least squares (9).
The amino acid alignments of the sequences from the donor and the two recipients are shown in Fig. 1 to highlight both synonymous and nonsynonymous changes. As discussed by Diaz et al. (10a), the general pattern seen is one of individual-specific divergence, but there are some common amino acid changes in the different individuals. No unusual mutations or foci of mutations with respect to published sequences are prominent. A phylogenetic study demonstrated that early quences cluster around the origin of the tree whereas se-quences from later time points are more distant (10a).
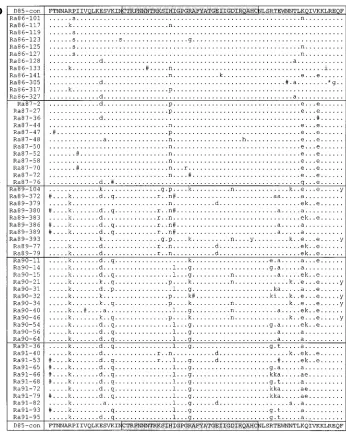
The average number of nucleotide substitutions per nonsyn-onymous site (Ka) and per synonymous site (Ks) for all pairwise
comparisons of sequences within each sampling point were calculated for the donor and the two transfusion recipients, the same method used in the study by Bonhoeffer et al. (2). The
means of intrasampleKa,Ks, andKa/Ksvalues are shown in Fig.
2a to c, respectively, plotted versus the time at which the samples were collected. The intrasample Ks values for the
three individuals fluctuate substantially without a steady in-crease or dein-crease over time (Fig. 2b). This is different from the gradual increase observed in the individual studied by Bonhoeffer et al. (2). The intrasampleKavalues in our three
individuals appear to increase with time, and they drop off late in recipient B. This contrasts with the relatively stableKavalue
in the individual in the study by Bonhoeffer et al. (2). The intrasample Ka/Ks ratios fluctuate with time like Ks values,
although there is a minor tendency toward an increase over time (Ka/Ks.1 during the later years of infection).
[image:3.612.135.481.67.503.2]The lack of concordance between the results from this study and those from the study by Bonhoeffer et al. (2) might be due to differences in host factors or, alternatively, the analytic ap-proach used. In an attempt to explore the second possibility, we chose to go beyond the snapshot measurement provided by the intrasample Ka and Ks values to the calculation of the
FIG. 1—Continued.
VOL. 71, 1997 NOTES 2557
on November 9, 2019 by guest
http://jvi.asm.org/
intersampleKaandKsvalues obtained by pairwise comparison
of sequences belonging to samples obtained at different times (termed rKaand rKs). The means of intersample rKaand rKs
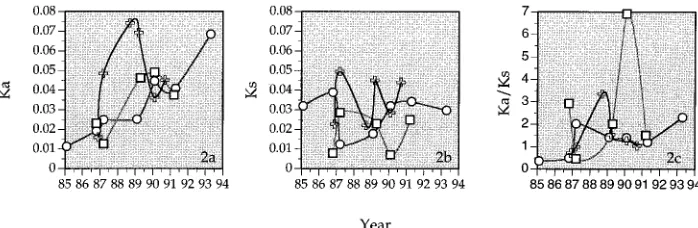
values for the three individuals (one donor and two recipients) were plotted as a function of corresponding nucleotide diver-gence, calculated under the Jukes-Cantor model of molecular evolution (29). By using this approach, the relative contribu-tions of nonsynonymous and synonymous changes to the over-all nucleotide divergence can be readily estimated. The results are shown in Fig. 3, which demonstrates a strong linear corre-lation between the rKavalues and genetic divergence for all
three individuals. Thervalue for rKaand genetic divergence is
highly significant, reaching 0.99 (P,0.001) in the donor and in recipient A and 0.96 (P,0.001) in recipient B. In contrast, the relatedness between rKsand genetic divergence is minimal.
Ther values for rKsand genetic divergence are all relatively
small in both recipients A (0.15,P.0.10) and B (0.29,P.
0.10), although a weak correlation can be seen in the donor (0.66, P , 0.01). It is also interesting to note that in cases where genetic divergence is relatively small, rKs values are
about the same as the corresponding rKa values. However,
when the overall genetic divergence increases, rKaincreases at
a much faster rate than rKs. As a result, rKavalues gradually
surpass rKsvalues and become the dominant contributor to the
overall genetic divergence (Fig. 3). The observed pattern is consistent with the notion that selective pressure in these three individuals actively promotes amino acid changes in the V3 loop and flanking regions.
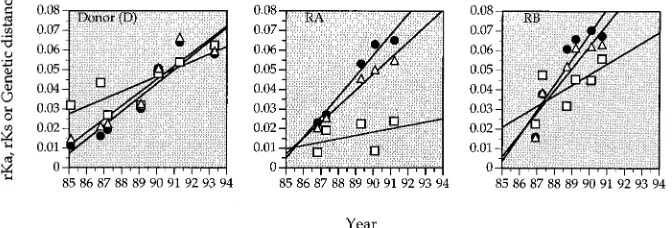
[image:4.612.128.491.69.537.2]To investigate the temporal pattern of divergence over time in these three individuals, rKa, rKs, and genetic distance were
FIG. 1—Continued.
on November 9, 2019 by guest
http://jvi.asm.org/
plotted versus time, using pairwise comparisons between the first and all subsequent samples of each individual. Figure 4 demonstrates the linear regression lines for rKa, rKs, and
ge-netic distance versus time in the donor and the two recipients, A and B. Strong linear correlations for rKa and genetic
dis-tance were observed, showing an increase with time. The linear correlations shown are strongly supported by the highrvalues in all three of the individuals analyzed. With regard to the regression curve for rKa and time, the r value is 0.94 (P ,
0.001) in the donor, 0.98 (P,0.001) in recipient A, and 0.91 (P ,0.001) in recipient B, whereas for genetic distance and time, thervalue is as high as 0.94 (P,0.001) in the donor, 0.98 (P,0.001) in recipient A, and 0.91 (P,0.001) in recipient B. A linear correlation between rKsand time, on the other hand,
is much less apparent, withrvalues of 0.83 in the donor, 0.42 in recipient A, and 0.67 in recipient B. The linear correlations between both rKaand genetic divergence and time suggest that
the entire intrapatient viral population, as far as the V3 loop and flanking regions are concerned, progressively diverges away from the initial viral inoculum without significant back mutation to, or reappearance of, previous sequences.
The linear relationships obtained by this type of analysis facilitate quantitative comparisons between different individu-als. When the slopes of the rKaand genetic distance curves in
Fig. 4 for the three different individuals are compared, differ-ences are noted, indicating different evolutionary paces of HIV-1 V3 sequences within the different hosts. The slopes of the rKaregression lines for the donor and for recipients A and
B are 0.007, 0.009, and 0.013, respectively, and the respective values for genetic distance are 0.007, 0.007, and 0.012. The
rates of amino acid and nucleotide change in recipient B are therefore approximately 1.7 times faster than those in the donor and recipient A. The different pace of viral evolution in recipient B, although this individual was initially infected with the same viral strain as the donor and recipient A, argues for the existence of different intensities of selective pressure in different individuals.
In summary, we have analyzed the evolution of the hyper-variable V3 region of a single HIV-1 strain over time in three epidemiologically related infected individuals. The existence, temporal pattern, and relative strength of positive pressure for HIV-1 amino acid change within the different individuals were assessed by calculating the relative contributions of nonsynony-mous and synonynonsynony-mous nucleotide changes to V3 genotypic divergence over time. We observed marked fluctuations over time in the values of Ks, Ka, and Ka/Ks calculated from
in-trasample sequence comparisons for the three individuals be-longing to this epidemiological cluster, which makes quantita-tion and comparison between the different individuals difficult. We show instead that plotting intersample rKa values versus
time yields linear curves that are better suited for interpatient comparisons. Furthermore, plotting the intersample rKa and
rKsvalues versus genetic divergence effectively demonstrates
the predominant contribution of nonsynonymous rather than synonymous changes to the V3 nucleotide sequence diver-gence shown by this particular HIV-1 strain within all three of the individuals infected by it.
[image:5.612.132.481.71.185.2] [image:5.612.130.480.567.691.2]If this strain is representative of HIV-1 in general, then selective pressure appears to be the dominant driving force for V3 sequence evolution leading to the vast diversification in FIG. 2. Average intrasampleKa,Ks, andKa/Ksvalues from plasma-derived HIV-1 RNA sequences obtained from three epidemiologically linked individuals over the time period of the study. The open circles, squares, and crosses represent samples collected from the donor, recipient A, and recipient B, respectively. Each point represents the average value obtained from pairwise sequence comparisons within a particular sample.
FIG. 3. The average values of the frequencies of intersample synonymous (rKs) (open squares) and nonsynonymous (rKa) (solid circles) substitutions plotted versus total genetic distance in the donor, recipient A, (RA), and recipient B (RB). Each point represents the average value obtained from pairwise comparisons of sequences for two samples from a given individual. The ranges of the standard deviations (SD) for rKaand rKswere comparable (donor: SDrKa, 0.7 to 3.8%, and SDrKs, 1.3 to 2.9%; recipient A: SDrKa, 0.7 to 2.7%, and SDrKs, 1.1 to 2.4%; recipient B: SDrKa, 0.6 to 3.3%, and SDrKs, 1.5 to 3.3%).
VOL. 71, 1997 NOTES 2559
on November 9, 2019 by guest
http://jvi.asm.org/
viral quasispecies in vivo (1, 5, 7, 10, 16, 18, 20, 21, 25, 26, 33, 34, 40, 41). If HIV diversity was instead largely a manifestation of purely neutral evolution (14), mutation-driven evolution (36), or completely random events (38), then one would not expect to see a more significant correlation between rKaand
time than between rKsand time over the course of infection.
The preponderance of nonsynonymous substitutions observed and the rapid turnover of the viral population observed by Ho et al. (15) and Wei et al. (39) make it clearly inappropriate to apply neutral and chance theory to the evolutionary process of HIV-1. The rapid accumulation of nonsynonymous substitu-tions in other retroviruses and RNA viruses, such as simian immunodeficiency virus (3) and foot-and-mouth disease virus (13), also argues for a similar nonneutral process of viral evo-lution in vivo.
In addition, the observation here that the slopes of the rKa
regression versus time curves are not all the same in these three individuals infected with the same viral strain suggests that the selective pressure for V3 region amino acid change is host dependent. A similar conclusion was reached from an analysis of HIV-1 proviral DNA from two time points per person in a cluster of five epidemiologically linked transfusion recipients (40). However, the correlation between the selective pressure for amino acid change and the rate of clinical pro-gression is not clear-cut, since recipient A, who showed a more moderate clinical progression and V3 amino acid change than recipient B, showed about the same pressure for divergence as the donor, who did not progress clinically over the course of the study (10a). A study by Lukashov et al. (25) comparing two sequences, one obtained during seroconversion and one deter-mined 5 years later, from each of 44 individuals showed a positive correlation between the length of the immunocompe-tent period (CD4 counts.200) and the degree of nonsynony-mous substitution, suggesting that slower progressors have stronger selective pressures for amino acid change. However, in five HIV-1-infected infants, Strunnikova et al. (35) found an inverse correlation between average CD4 cell counts and the rate of sequence divergence. In a recent study of six patients, two moderate progressors and one slow progressor showed higher rates of nonsynonymous changes than one slow progres-sor and two rapid progresprogres-sors (41). It must be emphasized that our population consists of only three patients and that they were not selected to represent extremes with regard to rate of clinical progression. The relationship between the rate of se-quence divergence and CD4 cell decline warrants further study.
Our results do not directly address the issue of the nature of the force for selection, be it related to immune escape or to the
acquisition of a wider cellular host range for the virus within the infected individual. If the pressure for amino acid change is due to immune selection, then at least for the three individ-uals studied here, sharing the same viral strain, there was no clear-cut correlation between the degree of immune selection and the time to onset of immunodeficiency.
Due to the significant linear correlation between genetic distance and time in these three individuals, we ventured fur-ther to estimate the rate of genetic divergence within each of the study subjects. The slopes of the genetic distance regres-sion curves yield average rates of increase in genetic diver-gence per year of 0.7% in the donor, 0.7% in recipient A, and 1.2% in recipient B. The overall average among these three individuals is therefore 0.87% per year, which is in fact very similar to the rate of nucleotide divergence (1.10% per year) calculated from a large cross-sectional sequence data set (19, 20, 27, 28). The observed rate of variation is also surprisingly similar to that seen in macaques experimentally infected with molecularly cloned simian immunodeficiency virus (3, 17). The similar rates of accumulation of divergence within and between infected individuals suggests that the process of genetic diver-gence in the HIV epidemic proceeds regardless of host-to-host transmission events, i.e., that transmission does not reset the evolutionary clock. Thus, the homogeneous viral population observed during seroconversion (6, 30, 42, 43) may not be the result of selection back to a common universal transmission sequence but rather may be due to selection for a particular viral phenotype within a given incoming viral population. In-deed, distinct viral sequences that share a predominantly mac-rophage-tropic phenotype have been obtained from different individuals during seroconversion (6, 30, 43). The sequences of these transmitted viral genomes would be predicted to have evolved away from their ancestral sequence at a rate of about 1% per year, particularly during the early course of the HIV-1 epidemic in the human population.
We thank Steve Wolinsky, Andrew Leigh Brown, and Sebastian Bonhoeffer for critical reading of the manuscript.
Financial support for the collection and documentation of the sub-jects and their specimens was provided by contracts NO1-HB-47002, NO1-HB-47003, and NO1-HB-97074 from the NHLBI and is grate-fully acknowledged. The sequencing was supported by NHLBI grant RO1-HL-48367. The visit by R.S.D. to Irwin Memorial Blood Centers was funded by the Fogarty International Program through the Univer-sity of California, Berkeley.
REFERENCES
[image:6.612.140.476.77.191.2]1.Balfe, P., P. Simmonds, C. A. Ludlam, J. O. Bishop, and A. J. Leigh Brown. 1990. Concurrent evolution of human immunodeficiency virus type 1 in patients infected from the same source: rate of sequence change and low FIG. 4. The average values of the frequencies of intersample synonymous (rKs) (open squares) and nonsynonymous (rKa) (solid circles) substitutions and genetic distances (open triangles) relative to the first available sample over the time period of the study. Each point represents the average value obtained from pairwise comparisons between sequences in each subsequent sample and sequences in the first sample. RA, recipient A; RB, recipient B.
on November 9, 2019 by guest
http://jvi.asm.org/
frequency of inactivating mutations. J. Virol.64:6221–6233.
2.Bonhoeffer, S., E. Holmes, and M. Nowak.1995. Causes of HIV diversity. Nature376:125.
3.Burns, D. P. W., and R. C. Desrosiers.1991. Selection of genetic variants of simian immunodeficiency virus in persistently infected rhesus monkeys. J. Virol.65:1843–1854.
4.Cheng-Mayer, C., D. Seto, M. Tateno, and J. Levy.1988. Biological features of HIV-1 that correlate with virulence in the host. Science240:80–82. 5.Cichutek, K., H. Merget, S. Norley, R. Linde, W. Kreuz, M. Gahr, and R.
Kurth.1992. Development of a quasispecies of human immunodeficiency virus type 1 in vivo. Proc. Natl. Acad. Sci. USA89:7365–7369.
6.Cichutek, K., S. Norley, R. Linde, W. Kreuz, M. Gahr, J. Lower, V. von Wangenheim, and R. Kurth.1991. Lack of HIV-1 V3 region sequence diversity in two haemophiliac patients infected with a mutative biologic clone of HIV-1. AIDS5:1185–1187.
7.Coffin, J.1992. Genetic diversity and evolution of retroviruses. Curr. Top. Microbiol. Immunol.176:143–164.
8.Coffin, J.1995. HIV population dynamics in vivo: implications for genetic variation, pathogenesis, and therapy. Science267:483–489.
9.DeltaGraph.1993. Deltapoint, Inc., Monterey, Calif.
10. Delwart, E. L., H. W. Sheppard, B. D. Walker, J. Goudsmit, and J. I. Mullins.1994. Human immunodeficiency virus type 1 evolution in vivo tracked by DNA heteroduplex mobility assays. J. Virol.68:6672–6683. 10a.Diaz, R. S., L. Zhang, M. P. Busch, J. W. Mosley, and A. Mayer.AIDS, in
press.
11. Donegan, E., M. Stuart, J. C. Niland, H. S. Sacks, S. P. Azen, S. L. Dietrich, C. Faucett, M. A. Fletcher, S. H. Kleinman, E. A. Operskalski, H. A. Perkins, J. Pindyck, E. R. Schiff, D. P. Stites, P. A. Tomasulo, and J. W. Mosley.1990. Infection with human immunodeficiency virus type 1 (HIV-1) among recip-ients of antibody-positive blood donations. Ann. Intern. Med.113:733–739. 12. Felsenstein, J.1993. PHYLIP manual, version 3.5. Department of Genetics,
University of Washington, Seattle.
13. Gebauer, F., J. C. de la Torre, I. Gomes, M. G. Mateu, H. Barahona, B. Tiraboschi, I. Bergmann, P. Auge´ de Mello, and E. Domingo.1988. Rapid selection of genetic and antigenic variants of foot-and-mouth disease virus during persistence in cattle. J. Virol.62:2041–2049.
14. Gojobori, T., E. N. Moriyama, and M. Kimura.1990. Molecular clock of viral evolution, and the neutral theory. Proc. Natl. Acad. Sci. USA87:10015– 10018.
15. Ho, D. D., A. Neumann, A. Perelson, W. Chen, J. M. Leonard, and M. Markowitz.1995. Rapid turnover of plasma virions and CD4 lymphocytes in HIV-1 infection. Nature373:123–126.
16. Holmes, E. C., L. Zhang, P. Simmonds, C. A. Ludlam, and A. J. Leigh Brown.1992. Convergent and divergent sequence evolution in the surface envelope glycoprotein of human immunodeficiency virus type 1 within a single infected patient. Proc. Natl. Acad. Sci. USA89:4835–4839. 17. Johnson, P. R., T. E. Hamm, S. Goldstein, S. Kitov, and V. M. Hirsch.1991.
The genetic fate of molecularly cloned simian immunodeficiency virus in experimentally infected macaques. Virology185:217–228.
18. Korber, B. T. M., E. E. Allen, A. D. Farmer, and G. L. Myers.1995. Heter-ogeneity of HIV-1 and HIV-2. AIDS9(Suppl. A):S5–S18.
19. Kuiken, C. L., V. V. Lukashov, E. Baan, J. Dekker, J. A. M. Leunissen, and J. Goudsmit.1996. Evidence for limited within-person evolution of the V3 domain of the HIV-1 envelope in the Amsterdam population. AIDS10:31– 37.
20. Kuiken, C. L., G. Zwart, E. Baan, R. A. Coutinho, J. A. R. van del Hoek, and J. Goudsmit.1993. Increasing antigenic and genetic diversity of the HIV-1 V3 domain in the course of the AIDS epidemic. Proc. Natl. Acad. Sci. USA 90:9061–9065.
21. LaRosa, G. J., J. P. Davide, K. Weinhold, J. A. Waterbury, A. T. Prosy, J. A. Lewis, A. J. Langlois, G. R. Dreesman, R. N. Boswell, and B. P. Shadduck. 1990. Conserved sequence and structural elements in the HIV-1 principal neutralizing determinant. Science249:932–935.
22. Leigh Brown, A. J., and P. Monaghan.1988. Evolution of the structural proteins of human immunodeficiency virus: selective constraints on nucleo-tide substitution. AIDS Res. Hum. Retroviruses4:399–407.
23. Li, W. H., and D. Graur.1991. Fundamentals of molecular evolution. Si-nauer Associates, Inc., Sunderland, Mass.
24. Li, W. H., C. I. Wu, and C. C. Luo.1985. A new method for estimating synonymous and nonsynonymous rates of nucleotide substitution
consider-ing the relative likelihood of nucleotide and codon changes. Mol. Biol. Evol. 2:150–174.
25. Lukashov, V. V., C. L. Kuiken, and J. Goudsmit.1995. Intrahost human immunodeficiency virus type 1 evolution is related to length of the immu-nocompetent period. J. Virol.69:6911–6916.
26. McNearney, T., A. Hornickova, R. Markhan, A. Birdwell, M. Arens, A. Saah, and L. Ratner.1992. Relationship of human immunodeficiency virus type 1 sequence heterogeneity to stage of disease. Proc. Natl. Acad. Sci. USA 89:10247–10251.
27. Myers, G., K. MacInnes, and B. Korber.1992. The emergence of simian/ human immunodeficiency viruses. AIDS Res. Hum. Retroviruses8:373–386. 28. Myers, G., and G. N. Pavlakis.1992. Evolutionary potential of complex retroviruses, p. 51–104.InJ. A. Levy (ed.), The retroviruses. Plenum Press, New York, N.Y.
29. Nei, M., and T. Gojobori.1986. Simple methods for estimating the numbers of synonymous and nonsynonymous nucleotide substitutions. Mol. Biol. Evol.3:418–426.
30. Roos, M. T. L., J. M. A. Lange, R. E. Y. Goede, R. A. Coutinho, P. T. A. Schellekens, F. Miedema, and M. Tersmette.1992. Viral phenotype and immune response in primary human immunodeficiency virus type 1 infec-tion. J. Infect. Dis.165:427–432.
31. Schiutemaker, H., M. Koot, N. A. Kootstra, M. W. Dercksen, R. E. Y. de Goede, R. P. van Steenwijk, J. M. A. Lange, J. K. M. Eeftink Schattenkerk, F. Miedema, and M. Tersmette.1992. Biological phenotype of human im-munodeficiency virus type 1 clones at different stages of infection: progres-sion of disease is associated with a shift from monocytotropic to T-cell-tropic virus populations. J. Virol.66:1354–1360.
32. Shpaer, E. G., and J. I. Mullins.1993. Rates of amino acid changes in the envelope protein correlate with pathogencicity of primate lentiviruses. J. Mol. Evol.37:57–65.
33. Simmonds, P., P. Balfe, C. A. Ludlam, J. O. Bishop, and A. J. Leigh Brown. 1990. Analysis of sequence diversity in hypervariable regions of the external glycoprotein of human immunodeficiency virus type 1. J. Virol.64:5840– 5850.
34. Simmonds, P., L. Q. Zhang, F. McOmish, P. Balfe, C. A. Ludlam, and A. J. Leigh Brown.1991. Discontinuous sequence changes of human immunode-ficiency virus (HIV) type 1envsequences in plasma viral and lymphocyte-associated proviral populations in vivo: implications for models of HIV pathogenesis. J. Virol.65:6266–6276.
35. Strunnikova, N., S. C. Ray, R. A. Livingston, E. Rubalcaba, and R. P. Viscidi. 1995. Convergent evolution within the V3 loop domain of human immuno-deficiency virus type 1 in association with disease progression. J. Virol. 69:7548–7558.
36. Temin, H. W.1989. Is HIV unique or merely different? J. Acquired Immune Defic. Syndr.2:1–9.
37. Tersmette, M., J. M. Lange, R. E. de Goede, F. de Wolf, J. K. M. Eeftink Schattenkerk, P. T. Schellekens, R. A. Coutinho, J. G. Huisman, J. Goudsmit, and F. Miedema.1989. Association between biological properties of human immunodeficiency virus variants and risk for AIDS and AIDS mortality. Lanceti:983–985.
38. Wain-Hobson, S.1992. Human immunodeficiency virus type 1 quasispecies in vivo and ex vivo. Curr. Top. Microbiol. Immunol.176:181–193. 39. Wei, X., S. K. Ghosh, M. E. Taylor, V. A. Johnson, E. A. Emini, P. Deutsch,
J. D. Lifson, S. Bonhoeffer, M. A. Nowak, B. Hahn, M. S. Saag, and G. M. Shaw.1995. Viral dynamics in human immunodeficiency virus type 1 infec-tion. Nature373:117–122.
40. Wolfs, T. F., J. J. de Jong, H. Van den Berg, J. M. Tijnagel, W. J. Krone, and J. Goudsmit.1990. Evolution of sequences encoding the principal neutral-ization epitope of human immunodeficiency virus type 1 is host dependent, rapid, and continuous. Proc. Natl. Acad. Sci. USA87:9938–9942. 41. Wolinsky, S. M., B. T. Korber, A. U. Neumann, M. Daniels, K. J. Kunstman,
A. J. Whetsell, M. R. Furtado, Y. Cao, D. D. Ho, J. T. Safrit, and R. A. Koup. 1996. Adaptive evolution of human immunodeficiency virus type 1 during the natural course of infection. Science272:537–542.
42. Zhang, L. Q., P. MacKenzie, A. Cleland, E. C. Holmes, A. J. Leigh Brown, and P. Simmonds.1993. Selection for specific sequences in the external envelope protein of human immunodeficiency virus type 1 upon primary infection. J. Virol.67:3345–3356.
43. Zhu, T., H. Mo, N. Wang, D. S. Nam, Y. Cao, R. A. Koup, and D. D. Ho.1993. Genotypic and phenotypic characterization of HIV-1 in patients with pri-mary infection. Science261:1179–1181.
VOL. 71, 1997 NOTES 2561