R E S E A R C H
Open Access
Simultaneous quantification of proposed
anti-malarial combination comprising of
lumefantrine and CDRI 97
–
78 in rat plasma
using the HPLC
–
ESI-MS/MS method: application
to drug interaction study
Muhammad Wahajuddin
1,2*, Sheelendra P Singh
3, Isha Taneja
1,2, Kanumuri SR Raju
1,2, Jiaur R Gayen
1,2,
Hefazat H Siddiqui
4and Shio K Singh
1,2Abstract
Background:Lumefantrine is the mainstay of anti-malarial combination therapy in most endemic countries presently. However, it cannot be used alone owing to its long onset time of action. CDRI 97–78 is a promising trioxane-derivative anti-malarial candidate that is currently being investigated as a substitute for artemisinin derivatives owing to their emerging resistance.
Methods:In the present study, a sensitive, simple and rapid high-performance liquid chromatography coupled with positive ion electrospray ionization-tandem mass spectrometry (LC-ESI-MS/MS) method was developed for the simultaneous determination of lumefantrine and CDRI 97-78’s metabolite, 97–63, in rat plasma using halofantrine as an internal standard. Lumefantrine and 97–63 were separated on a Waters Atlantis C18 (4.6 × 50 mm, 5.0μm) column under isocratic condition with mobile phase consisting of acetonitrile: methanol (50:50, v/v) and ammonium formate buffer (10 mM, pH 4.5) in the ratio of 95:5 (v/v) at a flow rate of 0.65 mL/min.
Results:The method was accurate and precise within the linearity range 3.9-500 ng/mL for both lumefantrine and 97–63 with a correlation coefficient (r2) of≥0.998. The intra- and inter-day assay precision ranged from 2.24 to 7.14% and 3.97 to 5.90%, and intra- and inter-day assay accuracy was between 94.93 and 109.51% and 96.87 and 108.38%, respectively, for both the analytes. Upon coadministration of 97–78, the relative bioavailability of lumefantrine significantly decreased to 64.41%.
Conclusions:A highly sensitive, specific and reproducible high-throughput LC-ESI-MS/MS assay was developed and validated to quantify lumefantrine and CDRI 97–78. The method was successfully applied to study the effect of oral co-administration of lumefantrine on the pharmacokinetics of 97–78 in maleSprague–Dawleyrats andvice versa. Co-administration of 97–78 significantly decreased the systemic exposure of lumefantrine.
Keywords:Validation, Lumefantrine, Extraction, Malaria, Resistance, HPLC-ESI-MS-MS
* Correspondence:[email protected]
1Academy of Scientific and Industrial Research, New Delhi, India 2
Pharmacokinetics and Metabolism Division, CSIR- Central Drug Research Institute, Lucknow 226031, Uttar Pradesh, India
Full list of author information is available at the end of the article
Background
Artemether-lumefantrine (AL) is a first-line artemisinin combination therapy (ACT) recommended by WHO for the treatment of uncomplicatedPlasmodium falciparum
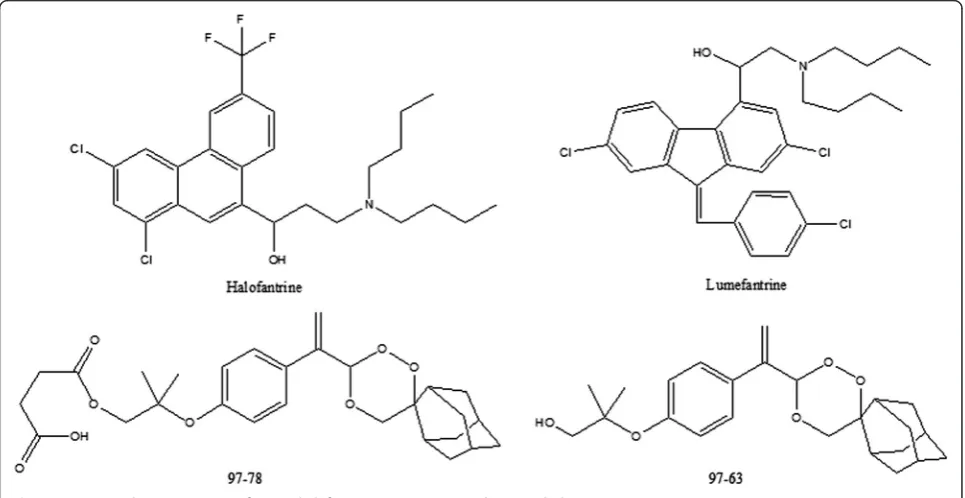
malaria [1]. The drugs are commercially available as a fixed dose combination in form of tablets, Coartem®and Riamet®. The combination of a short-acting and a long-acting drug is apt for treatment of malaria cases since the short-acting partner kills most of the circulating par-asites while the long-acting drug clears the remaining more slowly, thus preventing recrudescence. Lumefantrine (LUME) (previously known as benflumetol) was synthe-sized in the 1970s by the Academy of Military Medical Sciences in Beijing, China. It is a racemic fluorene deriva-tive, named 2-dibutylamino-1-[2,7-dichloro-9-(4-chloro-benzylidene)- 9H-fluoren-4-yl]-ethanol [2,3]. It is the long-acting partner drug of the artemisinin derivative artemether, in this ACT. However, recently reports of artemisinin resistance have emerged from the Greater Mekong Subregion of Myanmar, Cambodia, Thailand, and Vietnam with increased parasite clearance times [1,4]. Owing to the emerging resistance to artemisinin deriva-tives as well as their low oral bioavailability, there is the need to find novel anti-malarial agents that are devoid of such drawbacks and are more affordable to serve as an artemisinin alternative. To find a suitable fast-acting partner drug for LUME, CSIR-Central Drug Research Institute (India) (CDRI) has developed a series of trioxane anti-malarial compounds in its drug discovery programme [5,6]. One of the most promising compounds among these is CDRI candidate drug molecule 97–78 (Figure 1), which
has been identified for development as a suitable alter-native for artemisinin derivatives for use against drug-resistantP. falciparum and cerebral malaria cases. It is currently under Phase 1 clinical trials in licensing agree-ment with IPCA Pharmaceuticals Ltd, Mumbai, India. It is a water-soluble synthetic 1,2,4-trioxane derivative ac-tive in both rodent and monkey malaria models. This CDRI drug candidate has undergone preclinical efficacy, regulatory toxicity and pharmacological studies and has been found safe. Its Phase 1 safety trials have been com-pleted in 50 volunteers and Phase 1 single dose pharmaco-kinetics in 16 volunteers [7]. In vivo, 97–78 gets rapidly and completely converted into its active metabolite 97–63 (Figure 1), which is quantified in the biological system [8].
The preclinical pharmacokinetics of LUME (Figure 1) has been established previously [9-11]. In the present re-port, a simple, sensitive and specific liquid chromatog-raphy is described coupled with positive ion electrospray ionization-tandem mass spectrometry (LC-ESI-MS/MS) method developed and validated for the simultaneous quantification of LUME and 97–63 in 100μL rat plasma using halofantrine (Figure 1) as an internal standard (IS). The validated method was then applied to study the pre-clinical pharmacokinetic interaction of LUME and CDRI 97–78 combination to evaluate its prospects as a poten-tial anti-malarial combination.
Methods
Chemicals and reagents
[image:2.595.57.540.472.721.2]LUME and halofantrine (IS) were a generous gift from Ipca Laboratories Ltd, Mumbai, India. 97–78 and 97–63
were synthesized at the Medicinal Chemistry Division of Central Drug Research Institute, Lucknow, India. High performance liquid chromatography (HPLC) grade aceto-nitrile was purchased from Sisco Research Laboratories (SRL) Pvt Ltd, Mumbai, India. HPLC grade methanol was purchased from Thomas Baker Pvt Ltd, Mumbai, India. Ammonium formate and glacial acetic acid AR were pur-chased from E Merck Ltd, Mumbai, India. Sodium car-boxy methyl cellulose (CMC) was purchased from Sigma Aldrich Ltd, St Louis, USA. Ultra-pure water was obtained from a Sartorius Arium 611 system. Heparin sodium in-jection IP (1,000 IU/mL, Biologicals E Ltd, Hyderabad, India) was purchased from local pharmacy.
Animals and prerequisites
Blank, drug-free, plasma samples were collected from adult, healthy male Sprague–Dawley (SD) rats at the Division of Laboratory Animals (DOLA) of Central Drug Research Institute, Lucknow, India. Plasma was obtained by centrifuging the heparinized blood (25 IU/mL) at 2,000 × g for 10 min at 20°C. Prior approval from the In-stitutional Animal Ethics Committee (IAEC) was sought for maintenance, experimental studies, euthanasia, and disposal of carcass of animals.
Instrumentation and chromatographic conditions
HPLC system consisting of Series 200 pumps and auto-sampler with temperature-controlled Peltier-tray (Perkin-Elmer Corp, Norwalk, CT, USA) was used to inject 10-μL aliquots of the processed samples on a Waters Atlantis C18 column (4.6 × 50 mm, 5.0μm). The system was run in isocratic mode with mobile phase consisting of aceto-nitrile: methanol (50:50, v/v) and 10 mM ammonium for-mate buffer (pH = 4.5) in the ratio of 95:5 (v/v) at a flow rate of 0.65 mL/min. Mobile phase was duly filtered through 0.22μm Millipore filter (Billerica, MA, USA) and degassed ultrasonically for 15 min prior to use. Separa-tions were performed at room temperature. Auto-sampler carry-over was determined by injecting the highest cali-bration standard then a blank sample. 97–78 rapidly converted to 97–63 in plasma [8], hence, 97–63 was quantified instead of 97–78.
Mass spectrometric detection was performed on an API 4000 mass spectrometer (Applied Biosystems/MDS Sciex, Toronto, Canada) equipped with an API electro-spray ionization (ESI) source. The ion electro-spray voltage was set at 5,500 V. The instrument parameters: nebulizer gas, curtain gas, auxillary gas, and collision gas, were set at 40, 13, 50, and 10, respectively. Compounds parame-ters: declustering potential (DP), collision energy (CE), entrance potential (EP), and collision exit potential (CXP) were 80, 33, 10, 10 V, 50, 30, 4, 10 V, and 90, 33, 6, 8 V for LUME, 97–63 and IS, respectively. Zero air was used as source gas while nitrogen was used as both
curtain and collision gas. The mass spectrometer was operated at ESI positive ion mode and detection of the ions was performed in the multiple reaction monitoring (MRM) mode, monitoring the transition of m/z 529 pre-cursor ion [M + H]+ to the m/z 511.3 product ion for LUME, m/z 418.2 precursor ion [M + H]+ to the m/z 119.1 product ion for 97–63 and m/z 502 precursor ion [M + H]+to the m/z 142.2 product ion for IS. Quadrupole 1 and quadrupole 3 were maintained at unit resolution and dwell time was set at 200 ms. Data acquisition and quantitation were performed using analyst software ver-sion 1.4.1 (Applied Biosystems/MDS Sciex Toronto, Canada).
Preparation of standard and quality control samples
Primary stock solutions of LUME, 97–63 and IS were pre-pared by dissolving the compounds in acidified methanol (1% glacial acetic acid) to achieve desired concentration of 1 mg/mL. Working standard solutions of LUME and 97–63 were prepared by combining the aliquots of each primary stock solution, and diluting with methanol. A working stock solution of IS (50 ng/mL) was prepared by diluting an aliquot of primary stock solution with acetonitrile. All the stock solutions were stored at 4°C until analysis and were found to be stable up to six months. Calibration standards of LUME and 97–63 (3.9, 7.8, 15.6, 31.25, 62.5, 125, 250, and 500 ng/mL) were prepared by spiking 90μL of pooled, drug-free, rat plasma with the ap-propriate working standard solution of the analytes (10μL). Quality control (QC) samples were prepared by individually spiking control rat plasma at four concentration levels (3.9 ng/mL (lower limit of quantitation, LLOQ), 10 ng/mL (QC low), 100 ng/mL (QC medium) and 400 ng/mL (QC high)) and stored at−70 ± 10°C until analysis.
Recovery
The extraction recovery of analytes through protein pre-cipitation extraction procedure was determined by com-paring the peak areas of pre-spiked extracted plasma standard QC samples (n = 6) to those of the post-spiked standards at equivalent concentrations. Recoveries of LUME and 97–63 were determined at three concentra-tion levels, LLOQ, QC low and QC high concentraconcentra-tions: 3.9, 10 and400 ng/mL, whereas the recovery of the IS was determined at a single concentration of 50 ng/mL.
Recoveryð Þ ¼% Concentration of pre−spiked sample Concentration of post−spiked sample100
Sample preparation
acetonitrile), was added and vortexed for 10 min followed by centrifugation for 10 min at 15,000 × g. The super-natant (200μL) was separated and was injected onto ana-lytical column.
Validation procedures
Specificity and selectivity
The specificity and selectivity has been studied by using independent plasma samples from six different rats to investigate the potential interferences at the chromato-graphic peak region for analyte and IS, using the proposed extraction procedure and chromatographic-MS conditions.
Matrix effect
Pooled rat plasma from six different rats was used. The effect of rat plasma constituents over the ionization of LUME, 97–63 and IS was determined by comparing the
responses of the post-extracted plasma standard QC samples (low and high) (n = 6) with the response of ana-lytes from neat standard samples. The neat samples of equivalent concentrations were prepared by spiking equal volume of the working stock solutions in mobile phase. The matrix effect was calculated as:
%ME ¼ Response of the post‐extracted spiked sample Response of the equivalent neat standard sample100
Calibration curve
[image:4.595.57.540.304.703.2]The plasma calibration curve was constructed using eight calibration standards (3.9-500 ng/mL for LUME and 97–63) prepared by spiking 90μL of pooled, drug-free rat plasma with the appropriate working standard solution of the analytes (10μL).
Precision and accuracy
The intra-day assay precision and accuracy were esti-mated by analysing six replicates at four different QC levels, i.e., 3.9, 10, 100, and 400 ng/mL, for LUME and 97–63. The inter-day assay precision was determined by analysing the four levels QC samples on three different runs. The criteria for acceptability of the data included accuracy within ±15% deviation from the nominal values and a precision of within ±15% relative standard devi-ation (RSD), except for LLOQ, where it should not ex-ceed ±20% for accuracy as well as precision.
Stability experiments
All stability studies were conducted at two concentration levels, i.e., QC low and QC high, using six replicates at each concentration levels. Replicate injections of proc-essed samples were analysed up to 18 hrs to establish auto-sampler stability (AS) of analytes and IS at 4°C. The peak areas of analyte and IS obtained at initial cycle were used as the reference to determine the stability at
subsequent points. The stability of LUME and 97–63 in the biomatrix during 6 hrs of exposure at room temperature in rat plasma (bench top (BT)) was determined at ambient temperature (25 ± 2°C). Freeze/thaw (FT) stability was evalu-ated up to three cycles. In each cycle, samples were frozen for at least 12 hrs at−70 ± 10°C. Freezer stability of both ana-lytes in rat plasma was assessed by analysing the QC samples stored at−70 ± 10°C for at least 15 days. Samples were considered to be stable if assay values were within the acceptable limits of accuracy (i.e., ±15% deviation) and precision (i.e., ±15% RSD).
Dilution integrity
[image:5.595.58.542.101.338.2]The dilution integrity experiment was performed with an aim to validate the dilution test to be carried out on higher analyte concentrations (above the upper limit of quantification), which may be encountered during real subject samples analysis. Dilution integrity experiments were carried out by 20 times dilution of plasma samples containing 8,000 ng/mL of LUME and 97–63 with blank
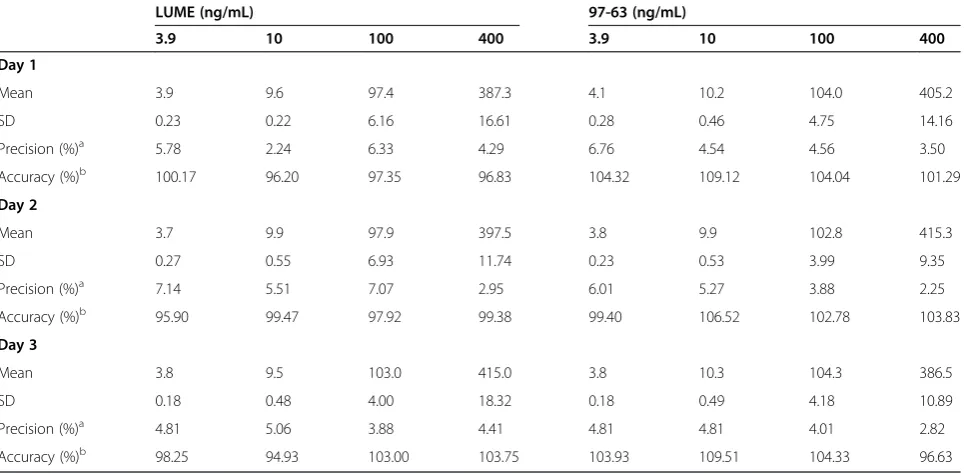
Table 1 Intra-day assay precision and accuracy for LUME and 97–63 in rat plasma (n = 6)
LUME (ng/mL) 97-63 (ng/mL)
3.9 10 100 400 3.9 10 100 400
Day 1
Mean 3.9 9.6 97.4 387.3 4.1 10.2 104.0 405.2
SD 0.23 0.22 6.16 16.61 0.28 0.46 4.75 14.16
Precision (%)a 5.78 2.24 6.33 4.29 6.76 4.54 4.56 3.50
Accuracy (%)b 100.17 96.20 97.35 96.83 104.32 109.12 104.04 101.29
Day 2
Mean 3.7 9.9 97.9 397.5 3.8 9.9 102.8 415.3
SD 0.27 0.55 6.93 11.74 0.23 0.53 3.99 9.35
Precision (%)a 7.14 5.51 7.07 2.95 6.01 5.27 3.88 2.25
Accuracy (%)b 95.90 99.47 97.92 99.38 99.40 106.52 102.78 103.83
Day 3
Mean 3.8 9.5 103.0 415.0 3.8 10.3 104.3 386.5
SD 0.18 0.48 4.00 18.32 0.18 0.49 4.18 10.89
Precision (%)a 4.81 5.06 3.88 4.41 4.81 4.81 4.01 2.82
Accuracy (%)b 98.25 94.93 103.00 103.75 103.93 109.51 104.33 96.63
a
Expressed as % RSD = (SD/mean) × 100. b
Calculated as (mean determined concentration/nominal concentration) × 100.
Table 2 Inter-day assay precision and accuracy for LUME and 97–63 in rat plasma
LUME (ng/mL) 97-63 (ng/mL)
3.9 10 100 400 3.9 10 100 400
Meana 3.8 9.7 98.1 399.9 4.0 10.2 103.7 402.3
SD 0.23 0.46 5.37 18.94 0.23 0.48 4.11 16.45
Precision (%)b 5.90 4.72 5.48 4.74 5.77 4.75 3.97 4.09
Accuracy (%)c 98.11 96.87 99.42 99.99 102.55 108.38 103.72 100.58
a
n = 18; three days with six replicates per day. b
Expressed as % RSD = (SD/mean) × 100. c
[image:5.595.57.539.625.708.2]plasma to obtain samples containing 400 ng/mL (QC high)of LUME and 97–63.
Application to interaction study
Study was performed in male Sprague–Dawley rats (n = 5, weight range 200–220 g). The rats were fasted overnight (14–16 hrs) prior to the experiment but given free access to water. Rats were divided into three groups (n = 5 each): two control groups (LUME, 10 mg/kg, oral, suspension in 0.25% sodium CMC and 97–78, 70 mg/kg, oral, suspen-sion in 0.25% sodium CMC), and one co-administration group (70 mg/kg of oral 97–78 and 10 mg/kg of oral LUME). Blood samples (approximately 0.25 mL) were col-lected from the retro-orbital plexus into heparinized microfuge tubes at 0.25, 0.50, 1, 3, 6, 9, 11, 13, 15, 24, 48, 72, and 120 hrs post-dosing and plasma was harvested by centrifuging the blood at 15,000xg for 10 min and stored frozen at−70 ± 10°C until bio-analysis.
Pharmacokinetic and statistical analysis
Plasma data were subjected to non-compartmental pharmacokinetics analysis using WinNonlin (version 5.1, Pharsight Corp, Mountain View, CA, USA). The observed maximum plasma concentration (Cmax) and the time to
reach the maximum plasma concentration (Tmax) were
obtained by visual inspection of the experimental data. Area under the plasma concentration-time curve from time zero to the last quantifiable concentration (AUC0-t)
was calculated using linear trapezoidal rule. The total area under the plasma concentration–time curve from time zero to time infinity (AUC0-∞) was calculated as the sum
of AUC0-t and Clast/kel, where, Clast represents the last
quantifiable concentration and Kelrepresents the terminal
phase rate constant. The apparent elimination half-life (t1/2) was calculated as 0.693/kel and the kel was
esti-mated by linear regression of the plasma concentrations in the log-linear terminal phase. The clearance (Cl/F); where F represents the oral bioavailability, was calcu-lated as dose/AUC, and the volume of distribution (Vd/F) was calculated as (Cl/F)/kel. The data is presented as a mean ± SD. The pharmacokinetic parameters were com-pared using Student’sttest. A P-value of <0.05 was con-sidered significant. The relative bioavailability (RB %) was calculated as follows:
[image:6.595.58.541.100.296.2]Relative bioavailability RBð %Þ ¼AUC coadimin AUC control 100
Table 3 Stability of LUME and 97–63 in rat plasma
LUME 97-63
Meana SD Precisionb(%) Accuracyc(%) Meana SD Precisionb(%) Accuracyc(%)
10 (ng/mL)
0 hr (for all) 9.6 0.22 2.24 96.20 10.2 0.46 4.54 109.12
24 hrs (AS) 9.9 0.40 4.05 103.72 4.3 0.16 3.74 104.67
6 hrs (BT) 9.8 0.69 7.01 101.73 3.8 0.16 4.30 93.85
FT-3 9.6 0.74 7.74 99.48 3.9 0.13 3.34 98.16
15 days at−70°C 9.6 0.24 2.49 105.73 4.1 0.12 2.92 100.47
400 (ng/mL)
0 hr (for all) 387.3 16.61 4.29 96.83 405.2 14.16 3.50 101.29
24 hrs (AS) 393.2 17.62 4.48 101.51 407.0 16.16 3.97 100.45
6 hrs (BT) 391.3 19.01 4.86 101.03 388.3 14.47 3.73 95.85
FT-3 413.5 12.34 2.98 106.78 404.3 6.15 1.52 99.79
15 days at−70°C 397.2 9.28 2.34 102.54 400.0 8.34 2.09 98.72
a
Back calculated plasma concentrations (n = 6). b
Expressed as % RSD = (SD/mean) × 100. c
Calculated as (mean determined concentration/nominal concentration) × 100.
[image:6.595.306.540.549.694.2]Results
LC-MS/MS optimization
It was important to optimize extraction technique, chroma-tographic conditions and mass spectrometry parameters to develop and validate a selective and rapid assay method for simultaneously quantitation of LUME, 97–63 and IS in rat plasma. Protein precipitation was chosen as the sample preparation method. Several organic solvents, including acetic acid, trichloroacetic acid, acetonitrile and metha-nol, were investigated as the precipitation extraction solvents. Acetonitrile was chosen because of higher ex-traction efficiency for LUME, 97–63 and IS, and much cleaner samples than other solvents. Several column types and chromatographic conditions were tested in order to develop a short, robust and sensitive analytical method. A short (4.6 × 50 mm, 5.0μm) Waters Atlantis C18 column with mobile phase consisting of acetonitrile: methanol (50:50, v/v) and 10 mM ammonium formate buffer (pH 4.5) in the ratio of 95:5 (v/v) at a flow rate of 0.65 mL/ min provided the best compromise between selectivity and speed of analysis. The overall analysis time was 6.0 min. No carry-over was observed, as indicated by the lack of LUME and 97–63 and halofantrine (IS) peaks in the blank sample.
[image:7.595.58.540.99.240.2] [image:7.595.305.539.547.694.2]Mass parameters were optimized by infusing standard analyte solution (100 ng/mL) into the mass spectrometer. In order to optimize ESI conditions for LUME, 97–63 and IS, quadrupole full scans were carried out in positive ion detection mode. During a direct infusion experiment, the mass spectra for LUME, 97–63 and IS revealed peaks at m/z 529, 418.2 and 502, respectively, as protonated mo-lecular ions [M + H]+. Following detailed optimization of mass spectrometry conditions (provided in instrumenta-tion and chromatographic condiinstrumenta-tions secinstrumenta-tion) m/z 529 precursor ion [M + H]+ to the m/z 511.3 product ion for LUME, m/z 418.2 precursor ion [M + H]+ to the m/z 119.1 product ion for 97–63 and m/z 502 precursor ion [M + H]+to the m/z 142.2 product ion for IS was used for the quantitation purpose.
Recovery
The extraction recovery of the LUME and 97–63 ranged from 94.63 to 109.56%, and the extraction recovery of the internal standard was 93.26% (See Additional file 1).
Validation procedures
The procedures were followed as per US FDA guidelines [12].
Specificity and matrix effect
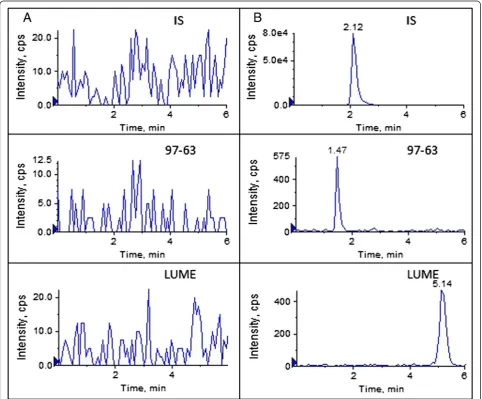
In the present study, the specificity and selectivity has been studied by using independent plasma samples from six different rats. Figure 2 shows a typical chromatogram for the drug-free plasma (Figure 2A) and drug-free plasma spiked with LUME and 97–63 at LLOQ and IS (Figure 2B). As shown in Figure 2A, there is no significant interference from plasma found at retention time of either the analyte or the IS. The ion suppression or enhancement by plasma was less than 13.25% for the analytes and 18.5% for IS which demonstrated that the matrix effects do not cause quantita-tion bias. Therefore, matrix effect could be negligible under the experimental conditions (See Additional file 1).
Table 4 The pharmacokinetic parameters of LUME and 97–78 in rats (n = 5 each)
Parameters Control LUME with 97-78
LUME (10 mg/kg) 97-78 (70 mg/kg) LUME (10 mg/kg) 97-78 (70 mg/kg)
AUC0-t(h*μg/mL) 16.52 ± 2.96 9.10 ± 1.48 10.64 ± 0.71* 8.04 ± 1.26
AUC0-∞(h*μg/mL) 17.42 ± 3.29 9.15 ± 1.46 11.02 ± 0.66* 8.15 ± 1.26
Cmax(μg/mL) 1.81 ± 0.75 1.35 ± 0.17 1.92 ± 0.62 1.79 ± 0.69
Tmax(h) 3.75 ± 1.50 2.2 ± 1.09 4 ± 2.45 0.5#
Vd/F (L/kg) 39.45 ± 6.26 106.05 ± 30.57 62.73 ± 8.40* 142.03 ± 28.13
CL/F (L/h/kg) 0.59 ± 0.09 7.81 ± 1.26 0.91 ± 0.06* 8.76 ± 1.38
t1/2(h) 46.94 ± 6.52 9.27 ± 1.33 47.82 ± 6.48 11.25 ± 1.45
RB% – – 64.41* 88.35
All data are expressed as mean ± SD. *
P <0.05,vsLUME control;#
P <0.05,vs97–78 control.
Calibration curve
The plasma calibration curve was constructed using eight calibration standards (3.9-500 ng/mL). The average regression (n = 3) was found to be≥0.998. The percent-age accuracy observed for the mean of back-calculated concentrations for three calibration curves was within 93.89 to 106.53, while the percentage precision values ranged from 1.39 to 9.00 for both the analytes.
Accuracy and precision
Accuracy and precision data for intra- and inter-day plasma samples are presented in Tables 1 and 2. The assay values on both the occasions (intra- and inter-day) were found to be within the accepted variable limits.
Stability
The predicted concentrations for LUME and 97–63 at 10 and 400 ng/mL samples deviated within the nominal concentrations in a battery of stability tests: AS (18 hrs), BT (6 hrs), repeated three FT cycles (FT-3) and at−70 ± 10°C for at least for 15 days (Table 3). The results were found to be within the assay variability limits during the entire process.
Dilution integrity
The percentage accuracy of diluted QCs was in the range of 94.56 to 107.68, while percentage precision values ranged from 0.89 to 7.52 for both the analytes. The results suggested that samples with concentrations greater than the upper limit of calibration curve could be re-analysed by appropriate dilution.
Application to interaction study
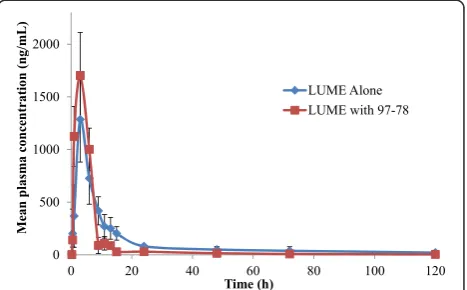
The rat plasma samples generated following administration of LUME and 97–78 were analysed by the newly developed and validated method along with QC samples. The mean plasma concentration-time profiles of LUME administered (10 mg/kg) alone or in combination with 97–78 (70 mg/kg) orally in rats, are shown in Figure 3. Table 4 summarizes the pharmacokinetic parameters of LUME and 97–78. The presence of 97–78 significantly (p <0.05) decreased the AUC0-∞(63.26%) of orally administered LUME. Consequently,
the RB% of LUME in the presence of 97–78 is remarkably de-creased (64.41%) compared to the LUME alone. The Tmax
and Cmax were not significantly altered by 97–78. LUME
clearance (Cl/F) was increased by 64.84% and Vd/F increased
by 62.89% with 97–78 co-administration. As both apparent CL/F and apparent Vd/F were increased almost proportionally,
there was no significant effect on the t1/2of LUME in
pres-ence of 97–78 (47.82vs46.94 hrs; p > 0.05).
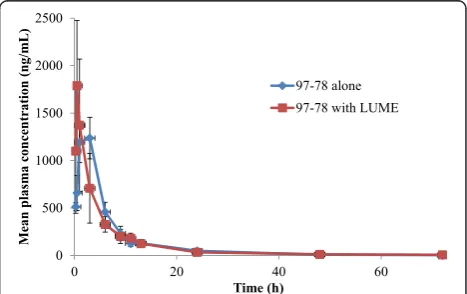
Mean plasma concentration-time profiles of 97–78 are shown in Figure 4. The Tmax of 97–78 was significantly
decreased by LUME (2.2vs0.5 hrs; p < 0.05). LUME had no significant effect on other PK parameters of 97–78
(Table 4). Further studies are required to understand the mechanistic basis of alterations upon per-oral co-administration of anti-malarial as potential combina-tions. These results should be taken into consideration while designing clinical proof of concept pharmacody-namic studies and while designing dosage regimen.
Conclusion
In this study, a highly sensitive, specific, reproducible, and high-throughput LC–ESI-MS/MS assay has been developed and validated to quantify LUME and CDRI 97–78 following protein precipitation extraction tech-nique from rat plasma, for the first time using halofantrine as IS. Due to good sensitivity (LLOQ−3.9 ng/mL for both LUME and 97–63) of the assay and its short run time of 6 min, it offers a suitable platform for the determination of LUME and 97–63 in preclinical studies. The results of the interaction study show that there are potential chances of pharmacokinetic interactions between long-acting LUME and short-acting 97–78.
Additional file
Additional file 1: Table S1.Recovery and matrix effect for LUME, 97–63 and IS in rat plasma.
Abbreviations
LUME:Lumefantrine; ACT: Artemisinin combination therapy; IS: Internal standard; AS: Auto-sampler; BT: Bench top; FT: Freeze/thaw; LC-ESI-MS/ MS: Liquid chromatography-electrospray ionization-tandem mass spectrometry; CMC: Carboxy methyl cellulose; MRM: Multiple reaction monitoring;
LLOQ: Lowest limit of quantification; QC: Quality control.
Competing interests
The authors declare that they have no competing interests.
Authors’contributions
IT and KSRR executed the animal analytical laboratory experiments. SPS, MW and HHS performed the statistical data analysis. SKS and JRG critically reviewed this manuscript. All authors read and approved the final manuscript.
Acknowledgements
We thank the Director, CDRI for his constant encouragement and support. We acknowledge Council of Scientific and Industrial Research (CSIR) for providing research fellowship to IT and KSRR. CDRI communication number for this manuscript is 8974.
Author details
1Academy of Scientific and Industrial Research, New Delhi, India. 2Pharmacokinetics and Metabolism Division, CSIR- Central Drug Research
Institute, Lucknow 226031, Uttar Pradesh, India.3Analytical Chemistry Division, CSIR-Indian Institute of Toxicology Research, Lucknow 226001Uttar Pradesh, India.4Faculty of Pharmacy, Integral University, Lucknow, India.
Received: 26 November 2014 Accepted: 8 April 2015
References
1. WHO. World malaria report 2013. Geneva: World Health Organization; 2013. 2. Wahajuddin, Singh SP, Singh SK, Jain GK. Quantitation of Lumefantrine in
Biological Matrices. Cur Pharm Anal. 2011; 7:42-6.
4. Dondorp AM, Nosten F, Yi P, Das D, Phyo AP, Tarning J, et al. Artemisinin resistance in Plasmodium falciparum malaria. N Engl J Med. 2009;361:455–67.
5. Singh C, Malik H, Puri SK: Spiro-1, 2, 4-trioxanes. US Patent 7495025 B2. 2009. 6. Singh C, Puri SK. Substituted 1, 2, 4-trioxanes as antimalarial agents and a
process of producing the substituted 1, 2, 4-trioxanes. US Patent 6316493 B1,2001.
7. Shafiq N, Rajagopalan S, Kushwaha HN, Mittal N, Chandurkar N, Bhalla A, et al. Single ascending dose safety and pharmacokinetics of CDRI-97/78: first-in-human study of a novel antimalarial drug. Malar Res Treat. 2014;2014:372521.
8. Singh RP, Sabarinath S, Gautam N, Gupta RC, Singh SK. Pharmacokinetic study of the novel, synthetic trioxane antimalarial compound 97–78 in rats using an LC-MS/MS method for quantification. Arzneimittel-Forschung. 2011;61:120–5.
9. Wahajuddin, Singh SP, Jain GK. Determination of lumefantrine in rat plasma by liquid-liquid extraction using LC-MS/MS with electrospray ionization: assay development, validation and application to a pharmacokinetic study. J Chromatogr B Analyt Technol Biomed Life Sci. 2009;877:1133–9. 10. Wahajuddin, Singh SP, Jain GK. Gender differences in pharmacokinetics of
lumefantrine and its metabolite desbutyl-lumefantrine in rats. Biopharm Drug Dispos. 2012;33:229–34.
11. Wahajuddin, Singh SP, Raju KSR, Nafis A, Puri SK, Jain GK. Intravenous pharmacokinetics, oral bioavailability, dose proportionality and in situ permeability of anti-malarial lumefantrine in rats. Malar J. 2011;10:293. 12. US FDA. Guidance for industry: bioanalytical method validation. Rockville,
MD: CDER; 2013.
Submit your next manuscript to BioMed Central and take full advantage of:
• Convenient online submission • Thorough peer review
• No space constraints or color figure charges • Immediate publication on acceptance
• Inclusion in PubMed, CAS, Scopus and Google Scholar
• Research which is freely available for redistribution