R E S E A R C H
Open Access
HIV-1 subtype C envelope characteristics
associated with divergent rates of chronic disease
progression
Derseree Archary
1, Michelle L Gordon
1, Taryn N Green
1, Hoosen M Coovadia
1, Philip JR Goulder
1,2,
Thumbi Ndung
’
u
1*Abstract
Background:HIV-1 envelope diversity remains a significant challenge for the development of an efficacious vaccine. The evolutionary forces that shape the diversity of envelope are incompletely understood. HIV-1 subtype C envelope in particular shows significant differences and unique characteristics compared to its subtype B
counterpart. Here we applied the single genome sequencing strategy of plasma derived virus from a cohort of therapy naïve chronically infected individuals in order to study diversity, divergence patterns and envelope characteristics across the entire HIV-1 subtype C gp160 in 4 slow progressors and 4 progressors over an average of 19.5 months.
Results:Sequence analysis indicated that intra-patient nucleotide diversity within the entire envelope was higher in slow progressors, but did not reach statistical significance (p = 0.07). However, intra-patient nucleotide diversity was significantly higher in slow progressors compared to progressors in the C2 (p = 0.0006), V3 (p = 0.01) and C3 (p = 0.005) regions. Increased amino acid length and fewer potential N-linked glycosylation sites (PNGs) were observed in the V1-V4 in slow progressors compared to progressors (p = 0.009 and p = 0.02 respectively). Similarly, gp41 in the progressors was significantly longer and had fewer PNGs compared to slow progressors (p = 0.02 and p = 0.02 respectively). Positive selection hotspots mapped mainly to V1, C3, V4, C4 and gp41 in slow progressors, whereas hotspots mapped mainly to gp41 in progressors. Signature consensus sequence differences between the groups occurred mainly in gp41.
Conclusions:These data suggest that separate regions of envelope are under differential selective forces, and that envelope evolution differs based on disease course. Differences between slow progressors and progressors may reflect differences in immunological pressure and immune evasion mechanisms. These data also indicate that the pattern of envelope evolution is an important correlate of disease progression in chronic HIV-1 subtype C infection.
Background
The rate of disease progression in HIV-1 infected indivi-duals is determined by a complex interplay of viral char-acteristics, host genetic factors, immune responses and environmental factors. The high viral replication rate, the lack of proof-reading mechanism by the HIV reverse transcriptase enzyme, and high recombination rate are characteristics that ensure that the virus continuously
mutates and evolves, resulting in both HIV diversifica-tion and viral escape from host immune responses [1,2]. Viral diversity and the constant generation of new viral quasispecies that may not be recognized or eliminated by the host immune mechanisms, particularly contem-poraneous virus-specific cytotoxic CD8+ T-cells or neu-tralizing antibodies, are major impediments for the development of an efficacious HIV-1 vaccine [3,4].
The HIV-1 envelope (Env) subunits gp120 and gp41 are the only viral proteins that are exposed on the virus surface, and they are under continuous host selective pressure, as they are key determinants of the target host cell range and are important targets of neutralizing * Correspondence: ndungu@ukzn.ac.za
1HIV Pathogenesis Programme, Doris Duke Medical Research Institute,
Nelson R. Mandela School of Medicine, University of KwaZulu-Natal, Durban, South Africa
Full list of author information is available at the end of the article
antibodies and CD8 T cell responses. Specific Env sequence characteristics such as the overall amino acid diversity, the number of putative N-linked glycosylation sites (PNGs), and the length of variable loops have been shown to influence or correlate with antibody neutrali-zation sensitivity, cell tropism, co-receptor utilineutrali-zation and virus transmission [5-7]. Studies of Env diversity can also provide important clues for selective forces that may significantly influence the rate of disease progres-sion or alternatively identify specific regions of the Env protein that comprise important targets of effective immune pressure which may be important considera-tions in rational HIV-1 vaccine design.
In HIV-1 subtype B, the relationship between HIV-1 Env diversity and disease progression is complex, as illu-strated by a series of studies. In one early study, HIV-1 Env hypervariable region 3 (V3 loop) diversity was shown to increase with time [8]. A subsequent study showed that Env hypervariable regions 3 to 5 (V3 to V5) diversity was directly associated with duration of patient survival, positive selection for change, and inver-sely correlated with the rate of disease progression as measured by the slope of CD4+ T cell loss [9]. Another study that examined Env C2-V5 sequences in men fol-lowed for 6 to 12 years following seroconversion demonstrated a complex pattern of viral diversity char-acterized by an early phase of linear increases in diver-gence and diversity, followed by an intermediate phase with increase in divergence but stabilization or decline of diversity, and a final phase showing stabilization or reduction in divergence and continued stability or decline in diversity [10]. In another study, analysis of C2-V5 Env sequences among typical progressors versus slow progressors showed that the typical progressors exhibited higher diversity, lower intra- and inter-sample divergence, evidence of lower host selective pressure and increases in both synonymous and non-synonymous substitutions over time while only non-synonymous sub-stitutions increased in slow progressors [11].
The aforementioned studies and a comprehensive body of similar studies on HIV-1 diversity, divergence, and host selective forces that may impact on disease progression have been performed on HIV-1 subtype B [10,12-18]. Furthermore, these studies clearly demon-strate that patterns of Env diversity, divergence, and associated selective pressures identified can differ according to the stage of disease, the sampling metho-dology, the region of Env analyzed, the founder virus, and the host genetic background.
HIV-1 subtype C is the most rapidly spreading subtype worldwide [19,20], and an effective global vaccine will have to show efficacy against this subtype. A number of studies have explored Env diversity and diversification within HIV-1 subtype C [21,22] but data on this subtype
remain relatively limited, despite accumulating evidence that this subtype may differ significantly from HIV-1 sub-type B in certain biological properties mediated by the Env gene [21-25]. In particular, possible differences in Env diversity, divergence, and selective pressures between HIV-1 subtype C-infected individuals with divergent rates of disease progression remain understudied.
In this study, we used single genome amplification and sequencing to explore the evolution of the Env gp160 protein. Specifically, we investigated differences in diver-sity and divergence in 4 slow progressors and 4 progres-sors of black African descent infected with HIV-1 subtype C. Further, we investigated differences in Env features such as the extent of putative N-linked glycosy-lation, lengths of the variable and constant regions of gp160, and positive selection in slow-progressors and progressors in order to assess the correlation of these variables with rates of disease progression.
Materials and methods Participants
Participant samples were retrospectively identified from the Sinikithemba cohort, which is a prospective natural history study of HIV-1 infected individuals based at McCord Hospital, Durban, South Africa as previously reported [26]. Ethics approval was obtained from the University of KwaZulu-Natal Biomedical Research Ethics Committee and all participants gave written informed consent to participate in the study. CD4 counts were performed at three month intervals whereas viral loads were done at six month intervals.
For this substudy, CD4 count was chosen as the pri-mary determinant of disease progression for stratifica-tion into slow progressor and progressor categories. Both slow progressors and progressors were selected on the basis of a CD4 cell counts >500 cells/μl at study entry time point. However, at study exit, slow
progres-sors maintained a CD4 count above 500 cells/μl or a
viral load less than 10,000 viral RNA copies/ml. In con-trast, progressors declined in CD4 counts to below 500 cells/μl and had a viral load above 10,000 copies/ml. The overall average follow up time was 19.5 months. All individuals were antiretroviral therapy naive before and during the window of evaluation. When the virological and immunological data became available beyond the study window (follow-up of an average of 39.8 months for slow progressors and 36.8 months for progressors, we analyzed these parameters relative to the study entry criteria and they remain statistically different for the progressors only (p = 0.03 for both CD4 and viral load).
Sample Collection, CD4 T cell counts and Plasma Viral Load
Blood was drawn from each subject into EDTA tubes and plasma was separated by centrifugation and stored
Amplicor Version 1.5 assay (Roche, Alameda CA, USA). CD4+ T-cell counts were enumerated by Trucount tech-nology on a four colour FACS Calibur flow cytometer (Becton Dickinson, Franklin Lakes, New Jersey, USA).
cDNA synthesis and single genome amplification
HIV-1 RNA extraction, cDNA synthesis, and single gen-ome amplification were performed as previously reported with some modifications[27]. Briefly, primers were designed for the efficient amplification of HIV-1 subtype C envelope through nested PCR. For the first
round PCR, the external primers used were VIF1: 5’
-GGGTTTATTACAGGGACAGCAGAG-3’(HXB2
posi-tions 4900-4923) and OFM19: 5’
-GCACTCAAGGC-AAGCTTTATTGAGGCTTA-3’(HXB2 positions
9604-9632). Primers for the second round PCR reaction were
ENV A: 5’
-GCTTAGGCATCTCCTATGGCAGGAA-GAA-3’(HXB2 positions 5954-5982) and ENV N: 5’
-CTGCCAATCAGGGAAGTAGCCTTGTGT-3’(HXB2
positions 9145-9171) [27]. Cycling conditions for first round PCR were as follows: 94°C for 4 min, 35 cycles of 94°C for 15 sec, 55°C for 30 sec, 68°C 4 min, and final extension of 68°C for 20 min followed by hold at 4°C. Second round PCR conditions were as follows: 94°C for 2 min, 45 cycles of 94°C for 15 sec, 55°C for 30 sec, 68°C for 4 min; final extension at 68°C for 20 min and 4°C hold. PCR products were visualized on a 1% agarose gel and amplicons were purified using the QIAquick PCR Purification Kit (Qiagen).
Sequencing analysis of gp160
The full-length envelopes were sequenced in the forward and reverse directions using the ABI Prism Big Dye Ter-minator Version 3.1 cycle sequencing kit (Applied Bio-systems, Foster City, CA), utilizing primers spanning the entire envelope and approximately 300 bp apart. Sequences were then resolved on the ABI 3130 XL genetic analyzer. Contigs were assembled and edited using the Sequencher v 4.8 software (Genecodes, Ann Arbor, MI). The sequences were aligned using Clustal W [28] and manually edited in the Genetic Data Environ-ment (GDE 2.2). For phylogenetic analysis, subtype refer-ence strains were obtained from the Los Alamos HIV sequence database http://www.hiv.lanl.gov/content/ sequence/NEWALIGN/align.html). Phylogenetic trees were generated in PAUP*4.0b10 using the TVM I + G model of substitution as determined by MODELTEST 3.7 [29]. Trees were rooted with a homologous region of Group O reference (O.CM.96). Maximum likelihood (ML) trees of sequences from individual patients were also drawn using the appropriate evolutionary model (as determined by MODELTEST 3.7) and rooted with the “Best-fit root”as determined by Path-O-Gen v1.2 [30]. All trees were bootstrapped with 1,000 sampling
replicates. Trees were viewed with FigTree v1.1.2 [30]. The approximate time of HIV-1 infection was estimated using BEAST (Bayesian Evolutionary Analysis Sampling Trees) version 1.4.8 (http://beast.bio.ed.ac.uk) in order to predict approximate time of infection prior to study enrollment [31]. BEAUTi was used to generate the .xml file to generate the BEAST file. The GTR substitution model with estimated base frequencies and a site hetero-geneity model of gamma + invariant sites were used. A relaxed, uncorrelated lognormal molecular clock model was chosen. The MCMC (Monte Carlo Markov Chain) length of chain was set at 30,000,000 to give an effective sample size (ESS) > 170. The number and location of putative N-linked glycosylation sites (PNGs) were esti-mated using N-GlycoSite (http://www.hiv.lanl.gov/con-tent/sequence/GLYCOSITE/glycosite.html) from the Los Alamos National Laboratory database. Sequence diversity was calculated using the Maximum Composite Likeli-hood option in Mega 4.0 [32]. Characteristic differences between progressors and slow progressors including cor-responding study entry and exit time-points were identi-fied using VESPA (Viral Epidemiology Signature Pattern Analysis) [33]. Nucleotide substitution rates were calcu-lated using baseml from the PAML software package [34]. Sites under positive selection were identified using the SLAC option in HyPhy [35] and CODEML as imple-mented in the PAML software package.
Positively selected sites and signature mutations were mapped onto the X-ray structure of a clade C HIV-1 gp120 (3LQA.pdb) [36] using the BIOPREDICTA mod-ule in the VLifeMDS software package (VLife Science Technologies, 2007). Gp41 was modeled in SWISS-MODEL [37] using 1ENV.pdb [38] as a template. Struc-tures were rendered and annotated in PyMol [39].
Statistical analyses
Pairwise comparisons of different parameters including genetic diversity, PNGs, and length polymorphism between subjects in the two groups were calculated by the Mann-Whitney non-parametric test using the GraphPad Prism 5 software programme unless otherwise stated. Correlations were regarded as statistically signifi-cant with apvalue < 0.05. All reported pvalues are for two-sided tests.
Genebank accession numbers
Sequences have been assigned the following GenBank
accession numbers: GU216702-GU216737 and
GU216739-GU216847.
Results
Study participant characteristics
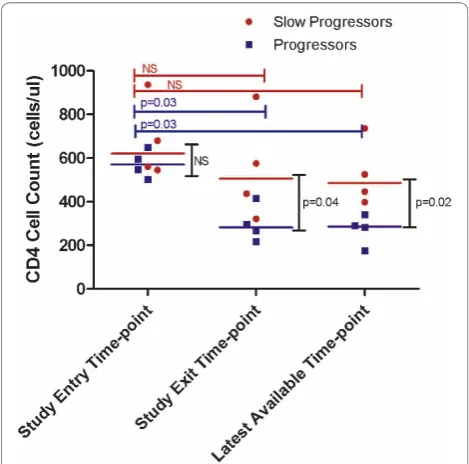
34 years old (range: 22-59 years). At study entry, both progressors and slow progressors did not differ in their
CD4 T cell counts (medians of 621 cells/μl versus 571
cells/μl (p = 0.39) as shown in figure 1. However, at
study exit the median CD4 count of slow progressors was 506 cells/μl, which is not significantly different from the CD4 count at study entry (p = 0.7), while the
pro-gressors’ median CD4 count had significantly declined
to 283 cells/μl, (p = 0.03). Slow progressors also had no significant difference for viral load (p = 1.0, data not shown) between study entry and exit time-points, whereas progressor participants had significantly lower viral load (p = 0.03, data not shown) at study entry compared to exit time-point. In addition, CD4 (figure 1) and viral load (data not shown) were statistically different for progressors only at the latest available time-point compared to study entry (p = 0.03 for both parameters). Furthermore, we used BEAST to estimate
the approximate time of infection in both groups of par-ticipants. Slow progressors were estimated to be infected for a mean period of 8.2 years (range 4.75-15 years) compared with 2 years (range 0.75-3.75 years) for progressors.
Phylogenetic relationships
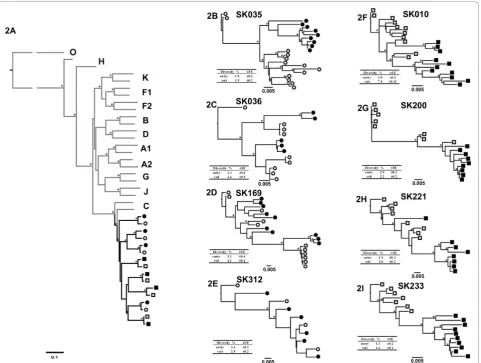
To analyze phylogenetic relationships and changes in envelope sequences in slow progressors and progressors over a period 19.5 month follow-up, a mean of 9 single genome full-length gp160 amplicons per participant per timepoint(range 4-11 amplicons) for the study entry and exit time-point were analyzed, for a total of 146 sequences. One of the slow-progressors (SK312) had a few putative functional Env amplicons which were included in the final analysis when compared to the other study participants. This was due to a low number of SGA-derived clones which was limited by the low viral load and plasma sample availability. All
partici-pants’ consensus sequences bootstrapped confidently
with subtype C reference strains, as determined by a Maximum Likelihood tree for each patient at each time point (Figure 2A). As expected, consensus sequences from the study entry and study exit for each patient formed monophyletic groups.
Overall, there were no distinguishing phylogenetic pat-terns noted between sequences from the slow progres-sors and progresprogres-sors (Figure 2A). Slow progresprogres-sors showed a more diverse pattern characterized by either separate (sub)clusters at study entry and exit (Figure 2B - SK035) or intermingling of sequences from early and exit time points (Figure 2E - SK312). Additionally, phy-logenetic clusters at study exit typically showed similar (Figure 2C - SK036) or longer branch length (Figure 2D, example subject - SK169), compared with that of the study entry sequences. However, individual participant sequence trees for the progressors tended to show seg-regation between entry and exit time-point sequences (Figures 2F-I).
Intra-patient diversity analysis
[image:4.595.56.291.321.553.2]Intra-patient diversity, defined as the mean pair-wise nucleotide distance, was calculated by measuring dis-tances between all sequences from a single individual at a single time-point, and is shown alongside the phyloge-netic trees (Figures 2B-I). Mean overall intra-patient diversity was 2.75% for the four slow progressors and 2.21% for the four progressors (p = 0.07). The mean baseline intra-patient nucleotide diversity for the slow progressors was 2.63% (range 1.8-3.3%) and 1.42% (range 1.0-2.0%) for the progressors, but this did not reach statistical significance (p = 0.08). Study exit time point mean intra-patient diversity was 2.88% (range 1.9-4.2%) and 3.0% (range 1.0-7.4%) for slow progressors
Figure 1CD4 of study entry, study exit and latest available time-point data for slow progressors and progressors. The red circles depict the data points for the slow-progressors. The blue squares depict data points for the progressors. Red bars and blue bars represent thepvalues for the slow progressors and progressors respectively. Black bars representpvalues for inter-group
and progressors, respectively, which was not a signifi-cant difference (p-value = 0.56). Collectively, these data show that in this cohort, slow progressors trended to higher intra-patient sequence diversity compared to pro-gressors although the differences did not reach statistical significance.
Nucleotide substitution rates in study entry and exit in slow progressors and progressors
To examine the evolution of the envelope gene over the study period, we calculated the rate of nucleotide diver-gence for each patient’senvsequences. On average the nucleotide substitution rate was higher in the progres-sors (1.2 ×10⁻²nucleotide substitutions/site/year; range
6-17 ×10-3), compared to the slow progressors (3 ×10⁻³ nucleotide substitutions/site/year; range 0.1-7 ×10⁻³), but did not differ significantly (p = 0.12). The nucleotide substitution rate appeared to follow the viral load pat-tern, such that there was a positive but non-significant linear correlation between divergence (nucleotide substi-tution rate) and the log10viral load (p = 0.12) - data not
shown.
Heterogeneity of diversity in Env in slow progressors and progressors for the variable and constant regions
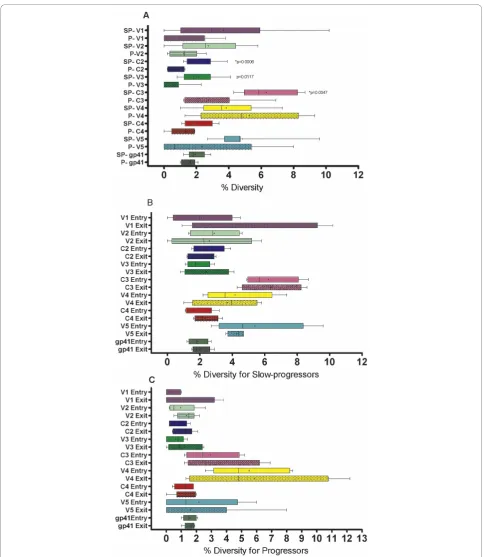
To assess whether there were overall differences in diversity between regions ofenvat study entry and exit,
[image:5.595.59.541.88.451.2]we analyzed distinct regions of the envgene separately
and compared diversity scores between the slow pro-gressors and propro-gressors for the five variable loops, three constant regions and gp41 over time as seen in Figure 3A. Significant diversity differences between slow progressors and progressors were noted for the C2 (p = 0.004), V3 (p = 0.01) and C3 (p = 0.005), with differ-ences remaining significant for C2 and C3 even after applying Bonferroni correction for multiple comparisons (≤0.006). There was no significant difference in overall inter-patient percentage diversity between slow progres-sors and progresprogres-sors for V1 (p = 0.12), V2 (p = 0.09), V4 (p = 0.29), C4 (p = 0.13), V5 (p = 0.08) and gp41 (p = 0.40).
Next, we assessed the differences in inter-individual envdiversity patterns acrossenvfor study entry and exit time-points. The results of this analysis are summarized in Figure 3B for slow progressors and Figure 3C for pro-gressors. There were no significant differences between the early and exit time-point intra-patient diversity for either of the groups in any of the regions.
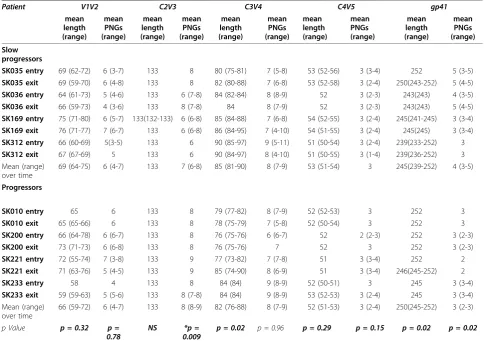
Length polymorphisms and glycosylation patterns for the variable and constant regions
Overall length of certain regions and changes in the number of N-linked glycosylation sites (PNGs) in Env have been shown to influence the sensitivity or resis-tance of the virus to antibody neutralization and may also influence efficiency of interactions with receptors on the cell surface [7,40]. However, these characteristics have not been comprehensively analyzed for HIV-1 sub-type C and most studies have focused on the V3 loop, which is an important but not exclusive determinant of viral tropism and cell entry [41]. We sought to deter-mine whether Env sequence characteristics are asso-ciated with disease progression in HIV-1 subtype C. Table 1 depicts Env region length polymorphisms and numbers of PNGs in slow progressors and progressors over time. Mean V1-V2 length for progressors and slow progressors was 66 amino acids and 69 amino acids respectively (Table 1) but this difference was not statisti-cally significant (p = 0.32). Similarly, we observed no differences in C4-V5 amino acid length (p = 0.29) or PNGs (p = 0.15), and length polymorphism for C2-V3 showed no significant difference between the groups. However, a significant difference was noted in the over-all number of PNGs in C2-V3 between slow progressors and progressors (p = 0.009), a result that remained sig-nificant after Bonferroni test correction (p < 0.01). For C3-V4, slow progressors had a significantly higher mean of 85 (range 81-90) compared to 82 (range: 76-88) amino acids in progressors (p = 0.02), however analysis of PNGs indicated no difference between the groups (p = 0.96). Interestingly, there was a significant differ-ence overall between the groups in the numbers of
PNGs for C3 only in the progressors compared to the slow progressors (p = 0.0006) (data not shown). V1-V4 length overall was significantly different, with slow pro-gressors displaying longer V1-V4 length of 286 amino
acids (range 282-294) compared to progressors’ 281
(range 276-292; p = 0.009). In contrast, we found that the numbers of PNGs for V1-V4 overall was signifi-cantly higher with a mean of 22, (range 20-23) in pro-gressors compared to a mean of 20 (range 19-21) in slow progressors (p = 0.02). Gp41 length was signifi-cantly higher in progressors (range 245-252) compared to slow progressors (range 239-252; p = 0.02) (Table 1). However, the number of PNGs in gp41 in slow progres-sors (range 3-5) was statistically different from those of progressors (range 2-4 PNGs; p = 0.02).
Positive selection pressure
The dN/dS (ω) ratio reflects non-synonymous (dN) sub-stitutions to synonymous (dS) subsub-stitutions per codon site, with a value of >1 at any site indicating positive
selection pressure [42]. Theωvalues for the whole of
gp160, as well as the variable and constant regions within envelope, were calculated using the M1a and M2a models implemented in CODEML. The settings for the M1a (neutral) model were: model = 0, NSsites = 1, and for the M2a (selection) model were: model = 0,
NSsites = 2. A Likelihood Ratio Test (2ΔlnL) was
per-formed between the likelihood scores of the M1a (null)
vs. M2a (alternative) models. Ac2 test was performed
using two degrees of freedom [34]. For V1, the M2a (selection) model was supported only in the slow pro-gressors (p < 0.005). For V2 and V3, the null hypothesis (M1a) could not be rejected for both slow and typical progressors (p = 0.25), while the M2a model was sup-ported for all remaining envelope regions (p < 0.005) for both groups.
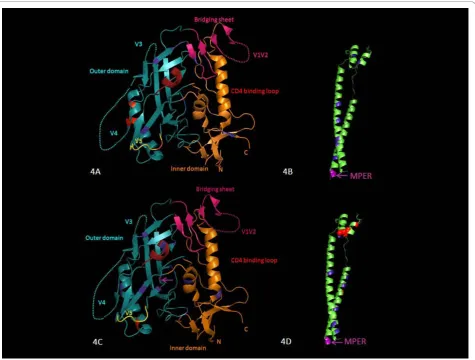
Analysis of the entire Env gp160 in the two groups using CODEML and the SLAC option in HYPHY iden-tified 9 common sites under positive selection in slow progressors and 5 sites in progressors. In slow progres-sors (Figures 4A and 4B), these were at codons 87, 138 and 140 (V1), 336 and 340 (C3), 396 and 410 (V4), 460 (V5) and 832 (gp41). Most of the sites under positive selection in slow progressors were either adjacent to a putative N-linked glycosylation site (codons 87, 138, 336 and 410) or were located at N-linked glycosylation sites (codons 140, 340, 396 and 460). Interestingly, positions
336 and 340 are within the a-2-helix (HXB2 position
335-352); it has been previously reported that changes within this region may confer autologous antibody neu-tralization resistance [19].
located in thea-2-helix of C3 immediately downstream of V3. Two of the sites under positive selection in the progressors were either adjacent to, (codon 612) or located at a putative N-linked glycosylation site (codon 641).
One additional site identified using CODEML, codon 671, is located at a linear epitope NWFNIT, which is within the membrane proximal external region (MPER) of gp41, an epitope that is well recognized by a broadly neutralizing antibody (4E10) [43].
Signature sequence differences between slow progressors and progressors
To identify key differences between the groups, consen-sus sequences of slow progressors and progressors study entry and exit were generated in VESPA using an 80%
threshold (i.e. sequence differences were in >80% of the sequences). Signature differences were noted at 6 amino acid positions between the progressors and slow pro-gressors consensus sequences. Four of six of these dif-ferences occurred in gp41 (codons 607, 727, 770 and 837), and the remaining two were at codons 80 and 133. No signature differences were noted between the entry and exit time points within each group.
[image:8.595.55.540.111.455.2]Except for an N to S/D mutation in the progressors at codon 80, which resulted in the gain of a casein-kinase-2 (CKcasein-kinase-2) phosphorylation site at codons 77-80, most of the signature changes were not at putative functional sites. Other changes, although not in the signature, but resulting in a change in putative functional sites in the progressors, are: a V to T mutation at codon 455 resulting in the gain of a myristoylation site at codon
Table 1 Env sequence characteristics of amino acid length and potential N-linked glycosylation sites for slow progressors and progressors#
Patient V1V2 C2V3 C3V4 C4V5 gp41
mean length (range)
mean PNGs (range)
mean length (range)
mean PNGs (range)
mean length (range)
mean PNGs (range)
mean length (range)
mean PNGs (range)
mean length (range)
mean PNGs (range)
Slow progressors
SK035 entry 69 (62-72) 6 (3-7) 133 8 80 (75-81) 7 (5-8) 53 (52-56) 3 (3-4) 252 5 (3-5)
SK035 exit 69 (59-70) 6 (4-8) 133 8 82 (80-88) 7 (6-8) 53 (52-58) 3 (2-4) 250(243-252) 5 (4-5)
SK036 entry 64 (61-73) 5 (4-6) 133 6 (7-8) 84 (82-84) 8 (8-9) 52 3 (2-3) 243(243) 4 (3-5)
SK036 exit 66 (59-73) 4 (3-6) 133 8 (7-8) 84 8 (7-9) 52 3 (2-3) 243(243) 5 (4-5)
SK169 entry 75 (71-80) 6 (5-7) 133(132-133) 6 (6-8) 85 (84-88) 7 (6-8) 54 (52-55) 3 (2-4) 245(241-245) 3 (3-4)
SK169 exit 76 (71-77) 7 (6-7) 133 6 (6-8) 86 (84-95) 7 (4-10) 54 (51-55) 3 (2-4) 245(245) 3 (3-4)
SK312 entry 66 (60-69) 5(3-5) 133 6 90 (85-97) 9 (5-11) 51 (50-54) 3 (2-4) 239(233-252) 3
SK312 exit 67 (67-69) 5 133 6 90 (84-97) 8 (4-10) 51 (50-55) 3 (1-4) 239(236-252) 3 Mean (range)
over time
69 (64-75) 6 (4-7) 133 7 (6-8) 85 (81-90) 8 (7-9) 53 (51-54) 3 245(239-252) 4 (3-5)
Progressors
SK010 entry 65 6 133 8 79 (77-82) 8 (7-9) 52 (52-53) 3 252 3
SK010 exit 65 (65-66) 6 133 8 78 (75-79) 7 (5-8) 52 (50-54) 3 252 3
SK200 entry 66 (64-78) 6 (6-7) 133 8 76 (75-76) 6 (6-7) 52 2 (2-3) 252 3 (2-3)
SK200 exit 73 (71-73) 6 (6-8) 133 8 76 (75-76) 7 52 3 252 3 (2-3)
SK221 entry 72 (55-74) 7 (3-8) 133 9 77 (73-82) 7 (7-8) 51 3 (3-4) 252 2
SK221 exit 71 (63-76) 5 (4-5) 133 9 85 (74-90) 8 (6-9) 51 3 (3-4) 246(245-252) 2
SK233 entry 58 4 133 8 84 (84) 9 (8-9) 52 (50-51) 3 245 3 (3-4)
SK233 exit 59 (59-63) 5 (5-6) 133 8 (7-8) 84 (84) 9 (8-9) 53 (52-53) 3 (2-4) 245 3 (3-4) Mean (range)
over time
66 (59-72) 6 (4-7) 133 8 (8-9) 82 (76-88) 8 (7-9) 52 (51-53) 3 (2-4) 250(245-252) 3 (2-3)
p Value p = 0.32 p = 0.78
NS *p =
0.009
p = 0.02 p = 0.96 p = 0.29 p = 0.15 p = 0.02 p = 0.02
pvalue was calculated using the two-tailed Mann-Whitney non-parametric test overall between the slow progressors and progressors. Where only the mean is reflected it is because it is equivalent to the range.
* represents thepvalue that remained significant after Bonferroni adjustment for multiple comparisons (p < 0.01), NS represents a non-significantpvalue. Potential N-linked glycosylation = PNGs.
#
Data for V1-V4 length is as follows: slow progressors had a mean of 286 amino acids (range 282-294) versus progressors’281 amino acids (range 276-292; p = 0.009).
#
451-456, a Q to K mutation at codon 665 (within the ALDSQWN epitope) resulting in the gain of a tyrosine kinase phosphorylation (TKP) site at codons 665-667, and an N to S mutation at codon 671 resulting in the gain of a CK2 phosphorylation site at codons 671-674 within the NWFDIT epitope. Interestingly, the loss of a putative N-linked glycosylation site in the progressors in the V4 region was compensated for by a gain of an N-linked glycosylation site in the C3 region (codons 362-365). When these signature patterns were compared with the subtype B reference strain, it was noted that an
L to V mutation at codon 800 in the subtype C signa-ture sequences resulted in a loss of a putative leucine zipper (codons 793-814). Whether the gain or loss of putative functional sites influence viral pathogenesis needs to be confirmed with functional assays.
Discussion
In this study we aimed to identify envsequence
[image:9.595.62.538.88.448.2]charac-teristics that may distinguish progressors from slow pro-gressors in a chronically HIV infected anti-retroviral naïve subtype C-infected cohort. We used a single
genome amplification approach in order to accurately and comprehensively represent the diversity of viral quasi-species. Several indicators of evolutionary forces were used to elucidate putative differences between the groups including heterogeneity of envelope sequence diversity, Env length polymorphisms, numbers of PNGs, positive selection, and signature sequence characteristics. Our study suggests that regions of Env are shaped by different evolutionary forces which may in turn leave viral sequence footprints that may distinguish slow pro-gressors from propro-gressors in chronic HIV-1 subtype C infection. It has previously been shown that in subtype B infection there may be Env region-specific differences in evolutionary forces between those with high versus low viral loads [9]. Our study demonstrated a non-sig-nificant trend towards increased intra-patient diversity in slow progressors, a finding consistent with other stu-dies on HIV disease progression [44-46]. In contrast, a study of primary HIV-1 subtype C infection has found that increased envelope diversity is inversely correlated with CD4 T cell counts and is associated with rapid dis-ease progression [47]. Together, these results may imply that evolutionary forces that drive HIV-1 subtype C diversification differ according to the phase of infection. On close examination of the envelope regions we found that diversity in C2, V3 and C3 was higher in slow pro-gressors compared to propro-gressors suggesting co-evolu-tion of these regions. These findings are consistent with findings from other studies [48,49]. From a functionality standpoint it appears that, because the V3 loop is very important for viral entry, increased diversity in this region is a correlate of viral attenuation [24].
Length polymorphisms in the constant and variable envelope regions may also contribute to structural diver-sity in terms of glycan packing and protein folding of the virion structure. An unusual finding was that the
longer V1-V4 in slow progressors had fewer PNG’s
whereas the longer gp41 domain contained fewer PNGs in progressors. Several studies have shown the associa-tion between neutralizaassocia-tion sensitivity and shorter V1-V4 length [50,51]. In contrast, other studies have shown longer V1-V4 with extensive glycosylation mask neutra-lizing antibody sensitive epitopes in subtype C [6]; how-ever, in subtype B no such association was found [52]. Our observations may imply that longer length regions may be masking neutralization sensitive epitopes as sug-gested by Gray et al. [47]. Additionally in progressors, a loss of a glycan in V4 was compensated for by a gain in a PNG within C3, implying a shifting glycan shield as suggested previously [7].
High dN/dS ratios indicative of strong diversifying selection due to humoral immune pressure [42], occurred mainly within gp41 in progressors, while slow progressors had a number of regions targeted. This
suggests that the nature of antibody targets may differ between the groups. Interestingly, both groups had
posi-tive selection in the a-2-helix within C3. It has been
suggested that, because the V4 loop is shorter in
sub-type C than in subsub-type B, the a-2 helix is more exposed
and more antigenic [49,53,54]. Interestingly, position 607 of gp41 was positively selected in progressors and was also a signature sequence difference between pro-gressors and slow-propro-gressors, indicating that there may be putative humoral immune pressure driving escape at that position. Additionally, gp41 in progressors showed differences at two putative antibody sites. Firstly, ELDK-WAS was recognized by neutralizing antibody (nAb) 2F5, where DKW are the sentinel amino acids that determine sensitivity to 2F5 [43]. This appears in the majority of the slow progressors’s sequences; however, it is substituted by DSW in all the progressors indicating a loss of a putative antibody recognition site. In addition there is a sequence change from Q at position 665 to K, making the overall progressor sequence ALDSWKN. Secondly, an N to S change at codon 671, which is within a linear epitope-NWFNIT- that is recognized by nAb 4E10, may result in a loss of this recognition site. In addition, this codon was positively selected for in the progressors. The effect of the loss of these putative recognition sites during chronic disease progression is unknown. We propose that the high antigenic stimula-tion in progressors may elicit antibodies whose antiviral effectiveness may be limited. Together these results may imply that the virus uses multiple strategies to evade the immune system, including increased V1-V4 amino acid length, increased numbers of PNGs, and specific muta-tions resulting in the virus gaining selective advantages. Essentially, the cat and mouse game that persists during chronic infection as a result of the dichotomy between antigenic stimulation and immunological response, which impacts and influences viral characteristics, needs further investigation.
their low viral load and sample volume limitation. In
addition, many more env amplicons were generated
than were included in the final analyses as some of the amplicons had sequences with stop codons. Fourth, although the slow progressors and progressors differed in markers of disease progression at study exit, more stringent selection criteria could potentially identify additional significant differences. Overall, therefore, the findings reported here will require duplication in larger cohorts with longer periods of follow-up and more sig-nificant differences in immunological and virological outcomes.
Conclusions
The dynamics of HIV-1env evolution between chronic
slow progressors and progressors are distinct. Single genome sequence analysis of circulating viruses in slow progressors and progressors indicate that diversity, Env length polymorphisms, sites under positive selection pressure, and PNGs consistently map to specific regions in slow progressors or progressors. Varied diversity
across theenvgenome, the relationship between amino
acid length, number of PNGs or sites under positive selection may provide further insight to the intrinsic dif-ferences between the viruses from both groups and the influence of the host’s selective pressures which may be used to inform more effective vaccine design.
Acknowledgements
This study was funded by the Hasso Plattner Foundation and the South African Department of Science and Technology/National Research Foundation Research Chair Initiative. We thank Dr Johannes Viljoen and the Africa Center Virology Laboratory for providing access to the sequencing facility. Keshni Hiramen, Nothemba Nontala and Huub C. Gelderblom provided excellent technical support. We thank Bruce D. Walker and Cynthia A. Derdeyn for critical review of the manuscript.
Author details
1
HIV Pathogenesis Programme, Doris Duke Medical Research Institute, Nelson R. Mandela School of Medicine, University of KwaZulu-Natal, Durban, South Africa.2Department of Pediatrics, Nuffield Department of Medicine, The Peter Medawar Building for Pathogen Research, Oxford University, Oxford, UK.
Authors’contributions
DA and TN conceived the experiments. DA, MG and TG carried out the experiments. DA, MG and TN wrote the paper and all authors helped interpret the data and reviewed the manuscript.
Competing interests
The authors declare that they have no competing interests.
Received: 30 July 2010 Accepted: 4 November 2010 Published: 4 November 2010
References
1. Mansky LM, Temin HM:Lower in vivo mutation rate of human immunodeficiency virus type 1 than that predicted from the fidelity of purified reverse transcriptase.J Virol1995,69:5087-5094.
2. Preston BD, Poiesz BJ, Loeb LA:Fidelity of HIV-1 reverse transcriptase. Science1988,242:1168-1171.
3. Brander C, Frahm N, Walker BD:The challenges of host and viral diversity in HIV vaccine design.Curr Opin Immunol2006,18:430-437.
4. Walker BD, Burton DR:Toward an AIDS vaccine.Science2008,320:760-764. 5. Resch W, Hoffman N, Swanstrom R:Improved success of phenotype
prediction of the human immunodeficiency virus type 1 from envelope variable loop 3 sequence using neural networks.Virology2001,288:51-62. 6. Rademeyer C, Moore PL, Taylor N, Martin DP, Choge IA, Gray ES,
Sheppard HW, Gray C, Morris L, Williamson C:Genetic characteristics of HIV-1 subtype C envelopes inducing cross-neutralizing antibodies. Virology2007,368:172-181.
7. Wei X, Decker JM, Wang S, Hui H, Kappes JC, Wu X, Salazar-Gonzalez JF, Salazar MG, Kilby JM, Saag MS,et al:Antibody neutralization and escape by HIV-1.Nature2003,422:307-312.
8. Nowak MA, Anderson RM, McLean AR, Wolfs TF, Goudsmit J, May RM:
Antigenic diversity thresholds and the development of AIDS.Science
1991,254:963-969.
9. Wolinsky SM, Kunstman KJ, Safrit JT, Koup RA, Neumann AU, Korber BT:
Response: HIV-1 Evolution and Disease Progression.Science1996,
274:1010-1011.
10. Shankarappa R, Margolick JB, Gange SJ, Rodrigo AG, Upchurch D, Farzadegan H, Gupta P, Rinaldo CR, Learn GH, He X,et al:Consistent viral evolutionary changes associated with the progression of human immunodeficiency virus type 1 infection.J Virol1999,73:10489-10502. 11. Bagnarelli P, Mazzola F, Menzo S, Montroni M, Butini L, Clementi M:
Host-specific modulation of the selective constraints driving human immunodeficiency virus type 1 env gene evolution.J Virol1999,
73:3764-3777.
12. Freel SA, Fiscus SA, Pilcher CD, Menezes P, Giner J, Patrick E, Lennox JL, Hicks CB, Eron JJ Jr, Shugars DC:Envelope diversity, coreceptor usage and syncytium-inducing phenotype of HIV-1 variants in saliva and blood during primary infection.Aids2003,17:2025-2033.
13. Delwart E, Magierowska M, Royz M, Foley B, Peddada L, Smith R, Heldebrant C, Conrad A, Busch M:Homogeneous quasispecies in 16 out of 17 individuals during very early HIV-1 primary infection.Aids2002,
16:189-195.
14. Gottlieb GS, Heath L, Nickle DC, Wong KG, Leach SE, Jacobs B, Gezahegne S, van‘t Wout AB, Jacobson LP, Margolick JB, Mullins JI:HIV-1 variation before seroconversion in men who have sex with men: analysis of acute/early HIV infection in the multicenter AIDS cohort study.J Infect Dis2008,197:1011-1015.
15. Keele BF, Giorgi EE, Salazar-Gonzalez JF, Decker JM, Pham KT, Salazar MG, Sun C, Grayson T, Wang S, Li H,et al:Identification and characterization of transmitted and early founder virus envelopes in primary HIV-1 infection.Proc Natl Acad Sci USA2008,105:7552-7557.
16. Learn GH, Muthui D, Brodie SJ, Zhu T, Diem K, Mullins JI, Corey L:Virus population homogenization following acute human immunodeficiency virus type 1 infection.J Virol2002,76:11953-11959.
17. Ritola K, Pilcher CD, Fiscus SA, Hoffman NG, Nelson JA, Kitrinos KM, Hicks CB, Eron JJ Jr, Swanstrom R:Multiple V1/V2 env variants are frequently present during primary infection with human immunodeficiency virus type 1.J Virol2004,78:11208-11218. 18. Frost SD, Liu Y, Pond SL, Chappey C, Wrin T, Petropoulos CJ, Little SJ,
Richman DD:Characterization of human immunodeficiency virus type 1 (HIV-1) envelope variation and neutralizing antibody responses during transmission of HIV-1 subtype B.J Virol2005,79:6523-6527.
19. Rong R, Gnanakaran S, Decker JM, Bibollet-Ruche F, Taylor J, Sfakianos JN, Mokili JL, Muldoon M, Mulenga J, Allen S,et al:Unique mutational patterns in the envelope alpha 2 amphipathic helix and acquisition of length in gp120 hypervariable domains are associated with resistance to autologous neutralization of subtype C human immunodeficiency virus type 1.J Virol2007,81:5658-5668.
20. Coetzer M, Cilliers T, Papathanasopoulos M, Ramjee G, Karim SA, Williamson C, Morris L:Longitudinal analysis of HIV type 1 subtype C envelope sequences from South Africa.AIDS Res Hum Retroviruses2007,
23:316-321.
21. Ping LH, Nelson JA, Hoffman IF, Schock J, Lamers SL, Goodman M, Vernazza P, Kazembe P, Maida M, Zimba D,et al:Characterization of V3 sequence heterogeneity in subtype C human immunodeficiency virus type 1 isolates from Malawi: underrepresentation of X4 variants.J Virol
22. Tscherning C, Alaeus A, Fredriksson R, Bjorndal A, Deng H, Littman DR, Fenyo EM, Albert J:Differences in chemokine coreceptor usage between genetic subtypes of HIV-1.Virology1998,241:181-188.
23. Ball SC, Abraha A, Collins KR, Marozsan AJ, Baird H, Quinones-Mateu ME, Penn-Nicholson A, Murray M, Richard N, Lobritz M,et al:Comparing the ex vivo fitness of CCR5-tropic human immunodeficiency virus type 1 isolates of subtypes B and C.J Virol2003,77:1021-1038.
24. Abraha A, Nankya IL, Gibson R, Demers K, Tebit DM, Johnston E, Katzenstein D, Siddiqui A, Herrera C, Fischetti L,et al:CCR5- and CXCR4-tropic subtype C human immunodeficiency virus type 1 isolates have a lower level of pathogenic fitness than other dominant group M subtypes: implications for the epidemic.J Virol2009,83:5592-5605. 25. Rong R, Li B, Lynch RM, Haaland RE, Murphy MK, Mulenga J, Allen SA,
Pinter A, Shaw GM, Hunter E,et al:Escape from autologous neutralizing antibodies in acute/early subtype C HIV-1 infection requires multiple pathways.PLoS Pathog2009,5:e1000594.
26. Kiepiela P, Leslie AJ, Honeyborne I, Ramduth D, Thobakgale C, Chetty S, Rathnavalu P, Moore C, Pfafferott KJ, Hilton L,et al:Dominant influence of HLA-B in mediating the potential co-evolution of HIV and HLA.Nature
2004,432:769-775.
27. Salazar-Gonzalez JF, Bailes E, Pham KT, Salazar MG, Guffey MB, Keele BF, Derdeyn CA, Farmer P, Hunter E, Allen S,et al:Deciphering human immunodeficiency virus type 1 transmission and early envelope diversification by single-genome amplification and sequencing.J Virol
2008,82:3952-3970.
28. Thompson JD, Higgins DG, Gibson TJ:CLUSTAL W: improving the sensitivity of progressive multiple sequence alignment through sequence weighting, position-specific gap penalties and weight matrix choice.Nucleic Acids Res1994,22:4673-4680.
29. Posada D, Crandall KA:MODELTEST: testing the model of DNA substitution.Bioinformatics1998,14:817-818.
30. Rambaut A:FigTree v1.1.2.2008 [http://tree.bio.ed.ac.uk/software/figtree]. 31. Drummond A, Rambaut A:BEAST: Bayesian evolutionary analysis by
sampling trees.BMC Evol Biol2007,7:214.
32. Tamura K, Dudley J, Nei M, Kumar S:MEGA4: Molecular Evolutionary Genetics Analysis (MEGA) software version 4.0.Mol Biol Evol2007,
24:1596-1599.
33. Korber B, Myers G:Signature pattern analysis: a method for assessing viral sequence relatedness.AIDS Res Hum Retroviruses1992,8:1549-1560. 34. Yang Z:PAML: a program package for phylogenetic analysis by
maximum likelihood.Comput Appl Biosci1997,13:555-556.
35. Pond SL, Frost SD, Muse SV:HyPhy: hypothesis testing using phylogenies. Bioinformatics2005,21:676-679.
36. Diskin R, Marcovecchio PM, Bjorkman PJ:Structure of a clade C HIV-1 gp120 bound to CD4 and CD4-induced antibody reveals anti-CD4 polyreactivity.Nat Struct Mol Biol17:608-613.
37. Schwede T, Kopp J, Guex N, Peitsch MC:SWISS-MODEL: An automated protein homology-modeling server.Nucleic Acids Res2003,31:3381-3385. 38. Weissenhorn W, Dessen A, Harrison SC, Skehel JJ, Wiley DC:Atomic
structure of the ectodomain from HIV-1 gp41.Nature1997,387:426-430. 39. DeLano W:The PyMOL Molecular Graphics System.DeLano Scientific, San
Carlos, CA, USA; 20062006.
40. Sagar M, Wu X, Lee S, Overbaugh J:Human immunodeficiency virus type 1 V1-V2 envelope loop sequences expand and add glycosylation sites over the course of infection, and these modifications affect antibody neutralization sensitivity.J Virol2006,80:9586-9598.
41. Huang W, Toma J, Fransen S, Stawiski E, Reeves JD, Whitcomb JM, Parkin N, Petropoulos CJ:Coreceptor tropism can be influenced by amino acid substitutions in the gp41 transmembrane subunit of human immunodeficiency virus type 1 envelope protein.J Virol2008,
82:5584-5593.
42. Yang W, Bielawski JP, Yang Z:Widespread adaptive evolution in the human immunodeficiency virus type 1 genome.J Mol Evol2003,
57:212-221.
43. Zwick MB, Jensen R, Church S, Wang M, Stiegler G, Kunert R, Katinger H, Burton DR:Anti-human immunodeficiency virus type 1 (HIV-1) antibodies 2F5 and 4E10 require surprisingly few crucial residues in the membrane-proximal external region of glycoprotein gp41 to neutralize HIV-1.J Virol
2005,79:1252-1261.
44. Mani I, Gilbert P, Sankale JL, Eisen G, Mboup S, Kanki PJ:Intrapatient diversity and its correlation with viral setpoint in human
immunodeficiency virus type 1 CRF02_A/G-IbNG infection.J Virol2002,
76:10745-10755.
45. McNearney T, Hornickova Z, Markham R, Birdwell A, Arens M, Saah A, Ratner L:Relationship of human immunodeficiency virus type 1 sequence heterogeneity to stage of disease.Proc Natl Acad Sci USA1992,
89:10247-10251.
46. Markham RB, Wang WC, Weisstein AE, Wang Z, Munoz A, Templeton A, Margolick J, Vlahov D, Quinn T, Farzadegan H, Yu XF:Patterns of HIV-1 evolution in individuals with differing rates of CD4 T cell decline.Proc Natl Acad Sci USA1998,95:12568-12573.
47. Gray ES, Moore PL, Choge IA, Decker JM, Bibollet-Ruche F, Li H, Leseka N, Treurnicht F, Mlisana K, Shaw GM,et al:Neutralizing antibody responses in acute human immunodeficiency virus type 1 subtype C infection.J Virol2007,81:6187-6196.
48. Menzo S, Sampaolesi R, Vicenzi E, Santagostino E, Liuzzi G, Chirianni A, Piazza M, Cohen OJ, Bagnarelli P, Clementi M:Rare mutations in a domain crucial for V3-loop structure prevail in replicating HIV from long-term non-progressors.Aids1998,12:985-997.
49. Gaschen B, Taylor J, Yusim K, Foley B, Gao F, Lang D, Novitsky V, Haynes B, Hahn BH, Bhattacharya T, Korber B:Diversity considerations in HIV-1 vaccine selection.Science2002,296:2354-2360.
50. Derdeyn CA, Decker JM, Bibollet-Ruche F, Mokili JL, Muldoon M, Denham SA, Heil ML, Kasolo F, Musonda R, Hahn BH,et al: Envelope-constrained neutralization-sensitive HIV-1 after heterosexual transmission.Science2004,303:2019-2022.
51. Rong R, Bibollet-Ruche F, Mulenga J, Allen S, Blackwell JL, Derdeyn CA:Role of V1V2 and other human immunodeficiency virus type 1 envelope domains in resistance to autologous neutralization during clade C infection.J Virol2007,81:1350-1359.
52. Liu Y, Curlin ME, Diem K, Zhao H, Ghosh AK, Zhu H, Woodward AS, Maenza J, Stevens CE, Stekler J,et al:Env length and N-linked glycosylation following transmission of human immunodeficiency virus Type 1 subtype B viruses.Virology2008,374:229-233.
53. Lynch RM, Shen T, Gnanakaran S, Derdeyn CA:Appreciating HIV type 1 diversity: subtype differences in Env.AIDS Res Hum Retroviruses2009,
25:237-248.
54. Gnanakaran S, Lang D, Daniels M, Bhattacharya T, Derdeyn CA, Korber B:
Clade-specific differences between human immunodeficiency virus type 1 clades B and C: diversity and correlations in C3-V4 regions of gp120.J Virol2007,81:4886-4891.
doi:10.1186/1742-4690-7-92
Cite this article as:Archaryet al.:HIV-1 subtype C envelope
characteristics associated with divergent rates of chronic disease progression.Retrovirology20107:92.
Submit your next manuscript to BioMed Central and take full advantage of:
• Convenient online submission
• Thorough peer review
• No space constraints or color figure charges
• Immediate publication on acceptance
• Inclusion in PubMed, CAS, Scopus and Google Scholar
• Research which is freely available for redistribution