R E S E A R C H
Open Access
Performance comparison of ventricular and
arterial dP/dt
max
for assessing left
ventricular systolic function during different
experimental loading and contractile
conditions
Manuel Ignacio Monge Garcia
1*, Zhongping Jian
2, Jos J. Settels
2, Charles Hunley
3, Maurizio Cecconi
4,
Feras Hatib
2and Michael R. Pinsky
5Abstract
Background:Maximal left ventricular (LV) pressure rise (LV dP/dtmax), a classical marker of LV systolic function,
requires LV catheterization, thus surrogate arterial pressure waveform measures have been proposed. We compared LV and arterial (femoral and radial) dP/dtmaxto the slope of the LV end-systolic pressure-volume relationship
(Ees), a load-independent measure of LV contractility, to determine the interactions between dP/dtmaxand Ees as loading
and LV contractility varied.
Methods:We measured LV pressure-volume data using a conductance catheter and femoral and radial arterial pressures using a fluid-filled catheter in 10 anesthetized pigs. Ees was calculated as the slope of the end-systolic pressure-volume relationship during a transient inferior vena cava occlusion. Afterload was assessed by the effective arterial elastance. The experimental protocol consisted of sequentially changing afterload (phenylephrine/nitroprusside), preload (bleeding/fluid bolus), and contractility (esmolol/dobutamine). A linear-mixed analysis was used to assess the contribution of cardiac (Ees, end-diastolic volume, effective arterial elastance, heart rate, preload-dependency) and arterial factors (total vascular resistance and arterial compliance) to LV and arterial dP/dtmax.
Results:Both LV and arterial dP/dtmaxallowed the tracking of Ees changes, especially during afterload and contractility
changes, although arterial dP/dtmaxwas lower compared to LV dP/dtmax(bias 732 ± 539 mmHg⋅s−1for femoral dP/dtmax,
and 625 ± 501 mmHg⋅s−1for radial dP/dtmax). Changes in cardiac contractility (Ees) were the main determinant of LV and
arterial dP/dtmaxchanges.
Conclusion:Although arterial dP/dtmaxis a complex function of central and peripheral arterial factors, radial and particularly
femoral dP/dtmaxallowed reasonably good tracking of LV contractility changes as loading and inotropic conditions varied.
Keywords:dP/dtmax, Contractility, Arterial pressure, Left ventricular function
* Correspondence:ignaciomonge@gmail.com
1Unidad de Cuidados Intensivos, Hospital Universitario SAS de Jerez, C/
Circunvalación, s/n, 11407 Jerez de la Frontera, Spain
Full list of author information is available at the end of the article
Background
Left ventricular (LV) contractility is one of the main de-terminants of cardiac function and an important element of the hemodynamic evaluation of the critically ill [1]. Impaired LV contractility is frequently seen in patients with acute coronary syndrome and sepsis [2]. Although LV end-systolic elastance (Ees) is the reference method for assessing LV contractility [3], its bedside use is lim-ited by its invasiveness and the technical difficulties as-sociated with its estimation [4]. LV ejection fraction (EFLV), estimated by echocardiography as the fractional area of contraction, is currently the most used clinical index for estimating LV systolic function. However, EFLV has known limitations as an index of cardiac inotropy, such as the high dependency on the cardiac loading con-ditions [5,6]. Although new echocardiographic indexes, such as speckle-tracking-derived LV global longitudinal strain or strain rate, have been recently introduced [7], their need of sophisticated software and trained opera-tors precludes their use for continuous hemodynamic monitoring of the LV systolic function.
The maximum rate of LV pressure during isovolumetric contraction (LV dP/dtmax) has been classically considered as a marker of LV inotropic state [8]. However, as LV dP/ dtmaxrequires a direct measure of LV pressure, other sur-rogates have been proposed using the arterial pressure waveform. Peripheral dP/dtmax, as measured from cathe-ters inserted into the femoral or radial arteries have been suggested as feasible surrogates for LV dP/dtmax[9, 10]. However, as the arterial pressure results from the com-bined interaction of the LV ejection and the arterial sys-tem properties, other potential factors could also contribute to the peripheral dP/dtmax, degrading its accur-acy as a measure of LV contractile state [10,11].
To address this issue, we compared LV and peripheral dP/dtmax during different preloading and afterloading and contractility conditions against the LV end-systolic elastance, a load-independent measure of cardiac con-tractility, and the other cardiac and arterial factors that were influencing these parameters in our established porcine model.
Methods
The study was approved by the Institutional Animal Care and Use Committee (IACUC) at the Edwards Re-search Center, and all experimentation was performed in accordance with the USDA Animal Welfare Act regula-tions (AWArs), and the Guide for the Care and Use of Laboratory Animals (ILAR, NAP, Washington, DC, 2010, 8th edition). The Test Facility is accredited by the Association for the Assessment and Accreditation of La-boratory Animal Care, International (AAALACi) and registered with the United States Department of Agricul-ture to conduct research with laboratory animals. The
Animal Research: Reporting of In Vivo Experiments (ARRIVE) guidelines were used for the elaboration of this manuscript [12].
Ten females adult Yorkshire cross breed pigs weighing 81 ± 6 kg were studied. They were maintained in temperature-controlled and humidity-controlled rooms with a typical light–dark cycle and given standard chow and tap water ad libitum. Prior to anesthesia induction, a general physical examination was performed including weight, temperature, heart rate, respiratory rate, mucus membrane, capillary refill time, general condition, and heart and lung auscultation. If found to be stable, the animal then was premedicated with an intramuscular combination of telazol (4.4 mg⋅kg−1), ketamine (2.2 mg⋅kg−1) and xylazine (1.1 mg⋅kg−1). Once the animal was on the preparation table, an endotracheal tube was placed in the trachea, and was anesthetized by gas with a mixture of 3–4% isoflurane and 100% oxygen. An intravenous catheter was placed in the auricular artery and vein and the neck and inguinal areas were shaved and cleaned, and the electrocardiogram (EKG) elec-trodes applied. Once on the operating table the pig was mechanically ventilated in a volume-controlled mode with respiratory rate set at 13–15 cycles⋅min−1, tidal vol-ume at 10 ml⋅kg−1(plus 100 ml compensation for dead space), and anesthesia was maintained with isoflurane 1.5–2.5% and a mixture of oxygen, air and/or nitrous oxide and fraction of inspired oxygen (FiO2) of 60–80%. Fluid was maintained by an intravenous infusion of Ringer’s lactate solution (2–4 ml⋅kg−1⋅h−1). Rectal temperature was monitored and kept between 36 and 37 °C using a heating pad. Animal anesthesia were moni-tored and recorded approximately every 15 min for the duration of the experimentation. Anesthesia depth and pain were assessed throughout the study by performing jaw tone and toe pinch. Positive jaw tone and negative toe pinch meant that the animal was under a non-painful depth of anesthesia. No paralytic agents were used for this study.
Instantaneous LV pressure-volume (PV) measure-ments were obtained from a 7Fr-lumen dual-field cath-eter with 12-equidistant electrodes and a high-fidelity pressure sensor (CA71083PL, CD Leycom, Zoetermeer, the Netherlands) connected to a PV signal processor (Inca®, CD Leycom, Zoetermeer, the Netherlands). The catheter tip was positioned in the LV apex and the cor-rect placement was confirmed by fluoroscopy and the examination of the segmental LV PV loops.
Data collection and analysis
thermodilution boluses for the determination of cardiac output (CO). Correction for parallel conductance (the conductance of the surrounding tissues, which was sub-tracted from the raw catheter volume) was performed with the injection of 10-ml boluses of 5% hypertonic saline through the distal port of the pulmonary artery catheter. The conductance signals obtained were then converted to calibrated volume signals by considering the inter-elec-trode spacing, the parallel conductance correction and the CO calibration factor obtained from thermodilution [13,
14]. CO calibration and parallel conductance correction were performed before starting the experimental protocol and after the fluid bolus stage.
LV pressure-volume data acquisition and analysis were performed in a dedicated software system (Conduct NT, version 3.18.1, CD Leycom, Zoetermeer, the Netherlands). The signals were recorded at 250 Hz sampling rate and fil-tered using a 25 Hz low-pass filter. Before and after each experimental stage, three transient (15 s maximum) occlu-sions of the inferior vena cava (IVC) were performed dur-ing apnea usdur-ing a Fogarty balloon. This procedure was repeated if ectopic beats were detected. End-systolic pres-sure (Pes), stroke volume (SV), CO, end-diastolic and end-systolic volumes (EDV and ESV, respectively), end-diastolic pressure, left ventricular ejection fraction (LVEF), effective arterial elastance (Ea) (a lumped
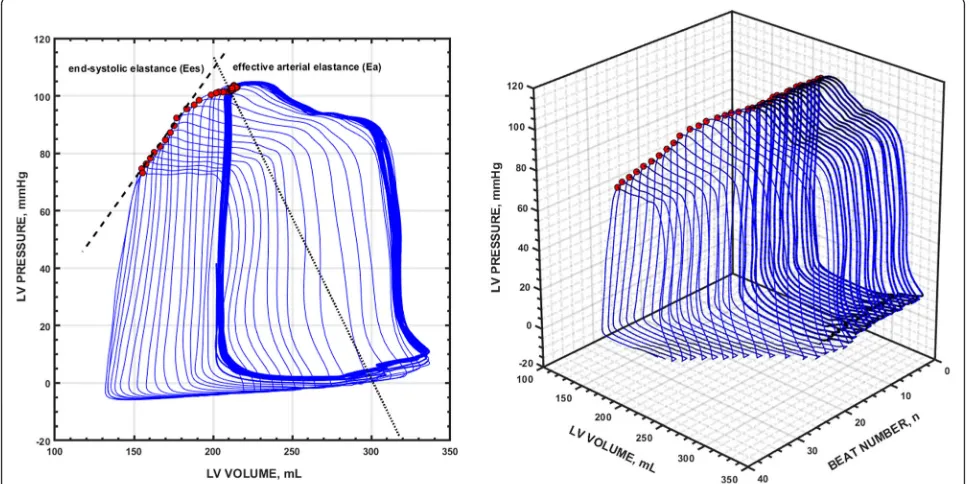
parameter of LV afterload calculated as Ea = Pes/SV [15]), arterial (radial and femoral) and LV dP/dtmaxwere calcu-lated from 3 to 5 beats in steady-state conditions during the respiratory pause just before the IVC occlusion. Ees was determined as the slope of the end-systolic pressure-volume relationship during the first 10 s of the IVC occlusion, calculated from the linear regression ana-lysis of the maximal elastance (E) points on each cardiac cycle, defined as E(t) = P(t)/V(t) – V0, where V0 is the volume-axis intercept or the LV unstressed volume [13]. An example of a typical PV loop analysis is illustrated in Fig.1.
The radial and femoral arterial pressure waveform were continuously recorded with a fluid-filled pressure transducer (FloTracIQ sensor; Edwards Lifesciences, Ir-vine, CA, USA) at a sampling rate of 100 Hz, using an EV1000 monitor (Edwards Lifesciences, Irvine, CA, USA) and then transferred onto a computer. Through-out the study, optimal damping of the arterial pressure waveform was carefully checked by fast flushing the line and checking the square wave test. Then cardiac beats were detected and maximum dP/dt for each beat was then calculated. The maximum dP/dt for all beats in a 20-s window of waveform was then averaged and the mean of three consecutive values (corresponding to measurement in 1 min) was used for analysis, in order to
[image:3.595.56.541.411.653.2]minimize the impact of respiratory variations on arterial pressure. The arterial system was characterized by a two-element Windkessel model [16], that consists of a resistive component: the total vascular resistance (TVR) = femoral mean arterial pressure (MAP)/CO * 80; and a pulsatile component: lumped arterial compliance (Cart) = SV/local arterial pulse pressure (femoral or radial pulse pressure) [17]. Preload-dependency was continuously es-timated using femoral pulse contour-derived stroke vol-ume variation (SVV).
Experimental protocol
Before starting with the experimental protocol, the animal received a fluid bolus (Voluven®, 130/0.4, Fresenius Kabi Deutschland GmbH, Bad Homburg, Germany) until it reached a SVV value < 15% for preload-optimization. Then they were allowed to stabilize for at least 10 min (heart rate and MAP variation < 5%). The study protocol consisted of three consecutive stages with two opposite (up and down) interventions each: changes in afterload (phenylephrine and nitroprusside), preload (bleeding and fluid bolus), and contractility (esmolol and dobutamine). The experiment started with the afterload interventions: the pigs were treated with sodium nitroprusside at a con-centration of 100–200 mg⋅kg−1⋅min−1 to decrease MAP to 40% from baseline (but not below 50 mmHg, allowing for adequate hemodynamic tolerance during the IVC oc-clusions) followed by recovery to baseline status. Then they were treated with a phenylephrine infusion to in-crease MAP by 40% mmHg from baseline (30–120 mg⋅kg−1⋅min−1) and were allowed to recover. Subse-quently, for preload interventions, the animals were sub-mitted to stepwise bleeding of 12 ml⋅kg−1at the rate of 50 ml⋅min−1 and the blood was stored in a heparinized sterile bag. Then the blood was slowly reinfused (50 ml⋅min−1), and a fluid bolus of 10 ml⋅kg−1of colloid in 5 min was infused. After the fluid administration, the con-tractility interventions followed: an esmolol infusion was introduced at 50μg⋅kg−1⋅min−1 and was increased until LV dP/dtmax was decreased by 50% from its previous value, with a limit dose of 200μg⋅Kg−1⋅min−1. Then the esmolol infusion was stopped and, after a period of recov-ery, the animals were treated with a dobutamine infusion (5μg⋅kg−1⋅min−1) to increase LV dP/dtmaxby 50%. LV PV loops and arterial pressure waveforms were obtained dur-ing baselines and after each intervention stage.
Statistical analysis
Data are expressed as the mean (SD) or median (25th to 75th interquartile range), as appropriate. The normality of data was checked by the Shapiro-Wilk test. Since we were interested in the effects of individual interventions, differences before and after each intervention were assessed by the paired t test or Wilcoxon test. LV and
radial and femoral arterial dP/dtmax were compared using Bland-Altman analysis, corrected for multiple measurements per subject. Concordance between Ees and dP/dtmax, defined as the percentage of data with agreement on the direction of change, was assessed by four-quadrant plots. Excellent concordance was assumed when the concordance rate was ≥90%. Linear mixed-effects model analysis was used to determine the contribution of the main cardiac variables (covariates: Ees, Ea, LV EDV and heart rate) to LV, femoral and ra-dial dP/dtmax. We also analyzed the impact of arterial factors (total vascular resistance (TVR) and arterial com-pliance (Cart)) and preload-dependency (SVV) on dP/ dtmaxvariables. Models were constructed using individ-ual animals as subjects for random factors, and sequen-tial experimental stages as repeated measurements. This allowed us to consider the correlation between subjects and non-constant variability over time, which is not con-sidered by the standard linear regression analysis. A Toe-plitz covariance structure was selected based on the corrected Akaike’s information criterion (AICc) value [18,19], in which lower scores indicate superior fit [18,
19]. Model parameters were estimated using the re-stricted maximum likelihood method and the estimated fixed effect of each parameter was quantified by the esti-mated value (95% confidence interval).
A P value < 0.05 was considered statistically signifi-cant. All statistical analyses were two-tailed and per-formed using MedCalc Statistical Software version 17.4 (MedCalc Software bvba, Ostend, Belgium; https://
www.medcalc.org; 2016) and SPPS (SPSS 21, SPPS Inc.,
Chicago, IL, USA).
Results
Hemodynamic changes during the experimental protocol
Hemodynamic variables throughout different experi-mental stages are detailed in Table 1(afterload), Table2
(preload), and Table3 (contractility). As expected, MAP increased with phenylephrine by 38 ± 6% (Ea by 59 ± 23%) and decreased with nitroprusside by 32 ± 6% (Ea by 41 ± 11%). Preload modifications decreased EDV by 10 ± 9% with bleeding and increased it by 23 ± 16% after fluid bolus. During contractility changes, esmolol decreased LV dP/dtmax by 53 ± 11% (Ees by 36 ± 12%) and in-creased with dobutamine by 83 ± 17% (Ees by 54 ± 25%).
Ees, LV and arterial dP/dtmaxevolution
Table 1Hemodynamic variables during afterload changes
Phenylephrine Sodium nitroprusside
Variables Before After Before After
CO, L⋅min−1 7.73 ± 1.40 7.07 ± 1.04* 8.09 ± 1.61 9.89 ± 1.49*
SV, ml 105 ± 11 96 ± 12‡ 103 ± 11 119 ± 15†
HR, beats⋅min−1 73 ± 11 73 ± 8 79 ± 11 75 ± 11*
MAP, mmHg 80 ± 9 111 ± 13‡ 81 ± 8 55 ± 4‡
EDV, ml 218 ± 47 214 ± 45 211 ± 43 212 ± 45
ESV ml 110 ± 42 115 ± 41 105 ± 40 89 ± 43†
LV Ped, mmHg 13 ± 4 18 ± 4‡ 12 ± 3 7 ± 3‡
LV Pes, mmHg 84 ± 11 122 ± 15‡ 90 ± 12 60 ± 7‡
Ea, mmHg⋅ml−1 0.69 ± 0.13 1.09 ± 0.20‡ 0.77 ± 0.16 0.45 ± 0.09‡
Ees, mmHg⋅ml−1 0.36 ± 0.12 0.48 ± 0.11‡ 0.41 ± 0.14 0.35 ± 0.14‡
LV ejection fraction, % 52 ± 10 48 ± 9* 52 ± 10 60 ± 13†
SVV, % 10.9 ± 3.6 5.8 ± 2.3‡ 10.9 ± 2.5 21.1 ± 5.9†
LV dP/dtmax, mmHg⋅s−1 1003 ± 158 1245 ± 175‡ 1089 ± 157 963 ± 182*
Femoral dP/dmax, mmHg⋅s−1 306 ± 52 378 ± 53† 335 ± 75 226 ± 52†
Radial dP/dtmax, mmHg⋅s−1 480 ± 110 409 ± 69* 463 ± 125 321 ± 96‡
Data are presented as mean ± SD
LVleft ventricle,COcardiac output,SVstroke volume,HRheart rate,MAPmean arterial pressure,EDVleft ventricular end-diastolic volume,ESVleft ventricular end-systolic volume,LV Pedleft ventricular end-diastolic pressure,LV Pesleft ventricular end-systolic pressure,Eesend-systolic elastance,Eaeffective arterial elastance, SVVstroke volume variation,dP/dtmaxpeak rate of pressure
*P< 0.05,†P≤0.001,‡P≤0.0001 vs“before”stage
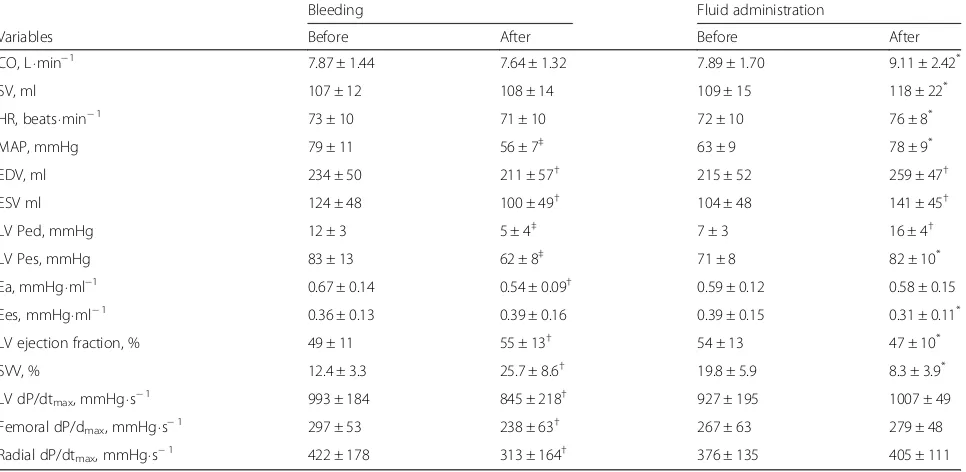
Table 2Hemodynamic variables during preload changes
Bleeding Fluid administration
Variables Before After Before After
CO, L⋅min−1 7.87 ± 1.44 7.64 ± 1.32 7.89 ± 1.70 9.11 ± 2.42*
SV, ml 107 ± 12 108 ± 14 109 ± 15 118 ± 22*
HR, beats⋅min−1 73 ± 10 71 ± 10 72 ± 10 76 ± 8*
MAP, mmHg 79 ± 11 56 ± 7‡ 63 ± 9 78 ± 9*
EDV, ml 234 ± 50 211 ± 57† 215 ± 52 259 ± 47†
ESV ml 124 ± 48 100 ± 49† 104 ± 48 141 ± 45†
LV Ped, mmHg 12 ± 3 5 ± 4‡ 7 ± 3 16 ± 4†
LV Pes, mmHg 83 ± 13 62 ± 8‡ 71 ± 8 82 ± 10*
Ea, mmHg⋅ml−1 0.67 ± 0.14 0.54 ± 0.09† 0.59 ± 0.12 0.58 ± 0.15
Ees, mmHg⋅ml−1 0.36 ± 0.13 0.39 ± 0.16 0.39 ± 0.15 0.31 ± 0.11*
LV ejection fraction, % 49 ± 11 55 ± 13† 54 ± 13 47 ± 10*
SVV, % 12.4 ± 3.3 25.7 ± 8.6† 19.8 ± 5.9 8.3 ± 3.9*
LV dP/dtmax, mmHg⋅s− 1
993 ± 184 845 ± 218† 927 ± 195 1007 ± 49
Femoral dP/dmax, mmHg⋅s− 1
297 ± 53 238 ± 63† 267 ± 63 279 ± 48
Radial dP/dtmax, mmHg⋅s− 1
422 ± 178 313 ± 164† 376 ± 135 405 ± 111
Data are presented as mean ± SD
LVleft ventricle,COcardiac output,SVstroke volume,HRheart rate,MAPmean arterial pressure,EDVleft ventricular end-diastolic volume,ESVleft ventricular end-systolic volume,LV Pedleft ventricular end-diastolic pressure,LV Pesleft ventricular end-systolic pressure,Eesend-systolic elastance,Eaeffective arterial elastance, SVVstroke volume variation, dP/dtmaxpeak rate of pressure
[image:5.595.58.541.454.690.2]changes in LV and arterial dP/dtmax was good (R2= 0.56 and 0.45 for femoral and radial dP/dtmax; P< 0.0001, respectively, Additional file 1: Figure S1), arterial dP/dtmaxwas lower than LV dP/dtmaxin all cases (radial dP/dtmax values were greater than femoral dP/dtmax values) (Additional file1: Figure S2). Percentage changes in dP/dtmaxand Ees had good concordance, especially LV and femoral dP/dtmax during afterload and contractility variations (Fig. 5). Adjusting LV and arterial dP/dtmaxto EDV barely improved this trend in capability (Add-itional file1: Figure S3).
Influence of cardiac factors on LV and arterial dP/dtmax
[image:6.595.56.543.100.336.2]In the linear mixed model analysis, the main determin-ant of dP/dtmaxvariables was contractility (Ees) (Table4). If holding other estimates constant, for an increase of 0.1 mmHg⋅ml−1 in Ees, an absolute increase in LV dP/ dtmax of 167.5 mmHg⋅s−1, in femoral dP/dtmax of 32.6 mmHg⋅s−1and in radial dP/dtmaxof 38.3 mmHg⋅s−1can be expected. Other factors, such as heart rate or EDV, also influenced dP/dtmax, but to a much lesser degree. Cardiac afterload, when assessed using Ea, only had a statistically significant effect on femoral dP/dtmax.
Table 3Hemodynamic variables during contractility changes
Esmolol Dobutamine
Variables Before After Before After
CO, L⋅min−1 8.87 ± 1.88 5.15 ± 1.09‡ 8.16 ± 2.01 11.23 ± 3.25‡
SV, ml 116 ± 13 75 ± 11‡ 111 ± 17 131 ± 22‡
HR, beats⋅min−1 76 ± 10 69 ± 9† 73 ± 10 85 ± 15†
MAP, mmHg 73 ± 13 50 ± 4‡ 71 ± 8 83 ± 10‡
EDV, ml 209 ± 33 200 ± 27 210 ± 28 208 ± 29
ESV ml 93 ± 28 125 ± 22† 97 ± 23 74 ± 28‡
LV Ped, mmHg 15 ± 4 13 ± 3* 14 ± 4 15 ± 4
LV Pes, mmHg 76 ± 15 53 ± 8† 73 ± 11 85 ± 12‡
Ea, mmHg⋅ml−1 0.53 ± 0.13 0.55 ± 0.12 0.54 ± 0.13 0.55 ± 0.15
Ees, mmHg⋅ml−1 0.37 ± 0.10 0.23 ± 0.06‡ 0.33 ± 0.07 0.50 ± 0.11‡
LV ejection fraction, % 56 ± 7 38 ± 5‡ 38 ± 5 53 ± 7‡
SVV, % 9.4 ± 4.4 17.1 ± 3.6 10.1 ± 3.8 8.9 ± 4.2*
LV dP/dtmax, mmHg⋅s−1 1067 ± 220 485 ± 58‡ 927 ± 174 1701 ± 384‡
Femoral dP/dmax, mmHg⋅s−1 292 ± 57 171 ± 44‡ 287 ± 56 392 ± 70‡
Radial dP/dtmax, mmHg⋅s−1 401 ± 142 204 ± 66‡ 391 ± 151 565 ± 192‡
Data are presented as mean ± SD
LVleft ventricle,COcardiac output,SVstroke volume,HRheart rate,MAPmean arterial pressure,EDVleft ventricular end-diastolic volume,ESVleft ventricular end-systolic volume,LV Pedleft ventricular end-diastolic pressure,LV Pesleft ventricular end-systolic pressure,Eesend-systolic elastance,Eaeffective arterial elastance, SVVstroke volume variation,dP/dtmaxpeak rate of pressure
*P< 0.05,†P≤0.001,‡P≤0.0001 vs“before”stage
[image:6.595.58.538.540.695.2]Fig. 3Evolution of left ventricular (LV) and arterial (femoral and radial) maximal rate of rise in pressure (dP/dtmax) during different experimental conditions. Individual changes in different dP/dtmaxvariables during each experimental stage. Black circles with bars represent the mean value and the standard deviation of changes in each experimental condition. Colored circles represent individual changes in each animal
[image:7.595.58.541.89.456.2] [image:7.595.59.540.506.699.2]Arterial factors influencing femoral and radial dP/dtmax
We also analyzed the impact of arterial system properties (Ea, TVR and Cart) on arterial dP/dtmax. Both TVR and Cartaffected peripheral dP/dtmax: when TVR and Cart de-creased, arterial dP/dtmax increased. However, the impact of Cart was markedly greater than TVR. Therefore, al-though changes in arterial load, as quantified by Ea and TVR, will produce opposite effects on dP/dtmax, the over-all result will eventuover-ally depend on the balance between
the relative magnitude of these two factors. For example, a 10% increase in Cart will decrease radial dP/dtmax by 9 mmHg⋅s−1, whereas a similar relative increase in TVR will reduce radial dP/dtmaxby only 0.03 mmHg⋅s−1(Table4).
Influence of preload dependency on LV and arterial dP/ dtmax
[image:8.595.58.541.87.556.2]the preload dependency, the lower the arterial and LV dP/dtmax. For example, an increase in SVV from 5% to 15% (if keeping other determinants constant) was associ-ated with a decrease in LV dP/dtmaxof 74.6 mmHg⋅s−1, in femoral dP/dtmax of 66 mmHg⋅s−1 and in radial dP/ dtmaxof 84 mmHg⋅s−1.
Discussion
Our study demonstrated that LV contractility, referenced to LV Ees, can be reasonably well-estimated and con-tinuously tracked using the analysis of the peripheral ar-terial pressure waveform. Although other factors influenced femoral and radial dP/dtmax, the main deter-minant of changes in peripheral dP/dtmaxwas LV Ees.
Adequate assessment of the LV inotropic state is an im-portant component of the hemodynamic evaluation of critically ill patients [1]. LV systolic impairment is not only associated with primary cardiac affections, such as cardio-genic shock or chronic heart failure, but it has been in-creasingly acknowledged as a key phenomenon in the hemodynamic disorders described in septic shock and in perioperative cardiac complications in patients undergo-ing major cardiac and noncardiac surgery [2,20,21].
Ideally, the optimal index for evaluating LV contractil-ity should be sensitive to changes in inotropism and in-sensitive to loading conditions. However, assessing LV contractility while theoretically isolating the heart from loading conditions can be challenging, especially in crit-ically ill patients, where modifications of these factors are particularly evident due to the intrinsic evolution of the pathological process and the frequent use of vaso-active therapy that can affect both preload and afterload conditions [6, 22]. Although LV Ees is considered a load-independent marker for defining myocardial con-tractility [23, 24], its measure is mostly relegated to
research studies because of the inherent invasiveness and technical difficulties in its measure. In clinical prac-tice, LV systolic function is usually evaluated by calculat-ing EFLV using standard echocardiography. However, EFLVhas limitations as an index of intrinsic contractility, mostly related to its strong dependency on loading con-ditions and the assumptions about LV geometry [5, 25], which makes its interpretation difficult in the critically ill [6]. Unfortunately, even newer echocardiographic or thermodilution-derived indexes used to assess LV sys-tolic function carry the same limitations or can be only used intermittently [26–29].
[image:9.595.56.541.100.253.2]Left ventricular dP/dtmax has been traditionally used as a reliable marker of myocardial performance [8, 30]. Under normal conditions, the maximal rate of LV pres-sure is usually developed during isovolumetric contraction [30], so theoretically LV dP/dtmaxshould be relatively in-sensitive to afterload. In our study, LV dP/dttmaxwas not related to afterload changes according to the lack of influ-ence of Ea. Previous studies have demonstrated that LV dP/dtmaxremains independent of afterload within physio-logical levels of blood pressure, but it could be affected by large reductions in afterload [30–33]. On the other hand, because the arterial dP/dtmax occurs during the ejection phase just after the opening of the aortic valve, it is then exposed to the influence of the arterial system [10]. Fur-thermore, as the arterial pressure is recorded further away from the LV, the impact of arterial factors such as reflected pressure waves is more evident. Moreover, as dP/dtmax re-flects the need for the pressure to grow in a given time at a constant diastolic pressure, the higher the systolic pres-sure to achieve, the potentially higher the dP/dtmax. There-fore, the differences in the absolute magnitude observed between LV dP/dtmaxand peripheral dP/dtmax should be interpreted under this perspective: the outflow of blood
Table 4Estimated values of fixed effects on left ventricular and peripheral dP/dtmaxaccording to a linear mixed model analysis
LV dP/dtmax Femoral dP/dtmax Radial dP/dtmax
Cardiac factors
Ees, mmHg ml−1 1674.7 (1394.9–1954.3)‡ 326.2 (236.8–415.5)‡ 382.9 (205.6–560.3)‡
Ea, mmHg ml−1 5.6 (−116.3–127.5) 59.9 (28.2–91.6)† −47.5 (−113.2–18.1)
LV EDV, mL 1.2 (0.4–2.0)* 0.4 (0.2–0.7)† 0.7 (0.2–1.2)†
Heart rate, bpm 21.3 (17.7–24.9)‡ 3.3 (2.1–4.5)‡ 8.2 (6.1–10.3)‡
Arterial factors
TVR, dyn cm s−5 −0.1 (−0.2–−0.1)‡ −0.3 (−0.4–−0.2)‡
Cart, ml mmHg−1 −69.5 (−89.7–−49.3)‡ −90.9 (−112.2–−69.6)‡
Preload-dependency
SVV, % −7.46 (−12.52–−2.40)† −6.62 (−8.07–−5.18)‡ −8.42 (−9.83–−7.01)‡
Estimates are presented as estimated values (95% confidence interval). Estimates reflect the average change in the dependent variable per unit increase of the fixed effect
LVleft ventricle,Eesleft ventricular end-systolic elastance,Eaeffective arterial elastance,EDVend-diastolic volume,TVRtotal vascular resistance,Cartarterial
flow by definition reduces the absolute value of dP/dtmax measured at any arterial site, and the central-to-peripheral dP/dtmaxgradient represents the tapering effect of the ar-terial system, buffering the intraventricular pressure into a more compliant system [9,10], while a greater radial dP/ dtmaxmay represent the impact of a lower compliance and the earlier wave reflections on the systolic part of the ar-terial pressure waveform [34]. However, despite the effect of the arterial system properties on the dP/dtmax, its con-tribution was significantly lower when compared with the prominent impact of contractility changes. Moreover, our data suggest that femoral dP/dtmaxmay be used even in patients with vasoplegia or treated with vasoactive agents.
The sensitivity of LV dp/dtmaxto changes in preload has been extensively described [30–32,35]. In our study, the im-pact of EDV was small but especially relevant during isolated modifications in preload, which it is in agreement with previ-ous experimental and clinical studies [30–32,35,36]. How-ever, when considering the effects of preload, adjusting LV and arterial dP/dtmaxto EDV, the trending capability of both LV and arterial dP/dtmaxdid not improve significantly, which reinforces the limited influence of preload on dP/dtmax changes. We also confirmed that LV and arterial dP/dtmax were affected by preload-dependency status [9]. As SVV is a compound variable depending on the preload status and the cardiac function [37], its influence should be interpreted by the combined interaction of these factors.
The present study indicates that the main determinant of changes in both LV and arterial dP/dtmax throughout the study was LV contractility. Our results are consistent with previous studies comparing arterial dP/dtmax with other surrogates of LV contractility [9–11]. However, most of the previous studies compared the arterial dP/dtmax with LV dP/dtmaxor used an in vitro experimental prepar-ation. In our study, we compared LV and peripheral dP/ dtmaxin vivo with the gold-standard index of LV contract-ility while studying a wide range of hemodynamic condi-tions, compromising two-way changes in preload, afterload and contractility. Moreover, we also identified and quantified the potential influence of several cardiac and arterial factors, so the continuous estimation of the actual LV contractility could be further improved consid-ering the effect of the most prominent factors.
Clinical usefulness and limitations
Arterial catheterization and arterial pressure monitoring are part of the usual care in both critically ill patients with hemodynamic instability and patients undergoing high-risk surgery. Complementary information on LV contractility, as provided by real-time monitoring of ar-terial dP/dtmax, may add valuable information on the dy-namic cardiac function assessment of these patients over time and on treatments. Moreover, the combined data derived from the analysis of the arterial pressure, such as
preload dependency and cardiac output, in combination with the continuous assessment of contractility by arter-ial dP/dtmax, could add a comprehensive evaluation of the hemodynamic status and may help to improve future resuscitation algorithms.
A few limitations should be considered when inter-preting our results. First, LV and arterial dP/dtmaxshould be interpreted with caution in patients with aortic valvu-lar disease or the presence of LV tract obstruction. Aor-tic stenosis or dynamic LV tract obstruction, for example, creates a significant pressure gradient over the aortic valve, and thus a large difference between LV dP/ dtmax and arterial dP/dtmax. Second, peripheral-to-cen-tral decoupling in arterial pressure, as described during septic shock [38], may alter the relationship between LV and arterial dP/dtmax, so our results may differ in septic shock conditions. Third, our experimental protocol in-volved many different hemodynamic conditions, and these modifications were sequentially generated or could be not fully represented, as during bleeding stage, where the hemodynamic changes were partially compensated. Fourth, although we have carefully checked the arterial pressure signal quality, we used fluid-filled catheters for assessing arterial dP/dtmax instead of pressure-tipped catheters, which are known to be exposed to overdamp-ing/underdamping phenomena. Finally, our study was performed on healthy pigs submitted to anesthesia with known cardiovascular effects, so our results should be interpreted with caution when extrapolating to human cardiovascular physiology.
Conclusion
Although arterial dP/dtmaxis a complex function subject to central and peripheral factors, both radial and par-ticularly femoral dP/dtmax allowed reasonably good tracking of LV contractility changes during different loading and inotropic conditions across all domains of vasomotor tone, contractility and volume status. There-fore, real-time assessment of LV contractility may be evaluated in clinical practice by monitoring peripheral arterial dP/dtmax.
Additional file
Additional file 1:Figure S1.Relationship between left ventricular and peripheral (femoral and radial) dP/dtmax.Figure S2.Bland-Altman analysis (corrected for multiple measurements per subject) between left ventricular and peripheral (femoral and radial) dP/dtmax.Figure S3.Concordance on percentage changes in left ventricular, femoral and radial dP/dtmax and percentage changes in end-systolic elastance (Ees) during the different experimental stages. (DOCX 726 kb)
Abbreviations
elastance; EFLV: Left ventricular ejection fraction; ESV: Left ventricular end-systolic volume; ICU: Intensive care unit; IVC: Inferior vena cava; LV: Left ventricle; MAP: Mean arterial pressure; Pes: Left ventricular end-systolic pres-sure; PV: Pressure-volume; SV: Stroke volume; SVV: Stroke volume variation; TVR: Total vascular resistance; V0: Left ventricular unstressed volume
Acknowledgements
We are grateful to all laboratory staff of the Edwards Research Center for their help in this work and to Cristhian Potes, Phd, of Edwards Lifesciences for his valuable comments.
Funding
Edwards Lifesciences provided the software, hardware and animals for the study.
Availability of data and materials
The data that support the findings of this study are available from the corresponding author upon reasonable request.
Authors’contributions
Study conception: MIMG, MRP and MC. Study design: MIMG, ZJ and MRP. Conduct of experimental research: MIMG, ZJ, FH and CH. Analysis and interpretation of the data: MIMG, ZJ, MRP and FH. Drafting of the manuscript: MIMG, ZJ, JJS and FH. All authors reviewed it, contributed significantly to its critical review, and approved the final version of the manuscript. All authors ensure the accuracy or integrity of the results of this study and will be accountable for any question related with this work.
Ethics approval
The study was approved for the use of swine by the Institutional Animal Care and Use Committee (IACUC) at the Edwards Research Center, and all experimentation was performed in accordance with the USDA Animal Welfare Act regulations (AWArs), and the Guide for the Care and Use of Laboratory Animals (ILAR, NAP, Washington, DC, 2010, 8th edition). The Test Facility is accredited by the Association for the Assessment and Accreditation of Laboratory Animal Care, International (AAALACi) and registered with the United States Department of Agriculture to conduct research with laboratory animals.
Consent for publication Not applicable.
Competing interests
MIMG is a consultant to Edwards Lifesciences and received honoraria and/or travel expenses from Deltex Medical. MRP is a consultant to Edwards LifeSciences, LiDCO Ltd., and Cheetah. MC has received honoraria and/or travel expenses from Edwards Lifesciences, LiDCO, Cheetah, Bmeye, Masimo and Deltex Medical. CH is a consultant to Edwards Lifesciences. ZJ, JJS and FH are Edwards Lifesciences employees.
Publisher’s Note
Springer Nature remains neutral with regard to jurisdictional claims in published maps and institutional affiliations.
Author details 1
Unidad de Cuidados Intensivos, Hospital Universitario SAS de Jerez, C/ Circunvalación, s/n, 11407 Jerez de la Frontera, Spain.2Edwards Lifesciences, Irvine, California, USA.3Orlando Regional Medical Center, Orlando Health, Florida, USA.4Department Anaesthesia and Intensive Care Units, Humanitas Research Hospital, Humanitas University, Milan, Italy.5Department of Critical Care Medicine, University of Pittsburgh School of Medicine, Pittsburgh, USA.
Received: 9 August 2018 Accepted: 12 November 2018
References
1. Cecconi M, De Backer D, Antonelli M, Beale R, Bakker J, Hofer C, et al. Consensus on circulatory shock and hemodynamic monitoring. Task force of the European Society of Intensive Care Medicine. Intensive Care Med. 2014;40(12):1795–815.
2. Vieillard-Baron A. Septic cardiomyopathy. Ann Intensive Care. 2011;1(1):6.
3. Suga H, Sagawa K. Instantaneous pressure-volume relationships and their ratio in the excised, supported canine left ventricle. Circ Res. 1974; 35(1):117–26.
4. Sagawa K. The end-systolic pressure-volume relation of the ventricle: definition, modifications and clinical use. Circulation. 1981;63(6):1223–7. 5. Robotham JL, Takata M, Berman M, Harasawa Y. Ejection fraction revisited.
Anesthesiology. 1991;74(1):172–83.
6. Boissier F, Razazi K, Seemann A, Bedet A, Thille AW, de Prost N, et al. Left ventricular systolic dysfunction during septic shock: the role of loading conditions. Intensive Care Med. 2017;43(5):633–42.
7. Geyer H, Caracciolo G, Abe H, Wilansky S, Carerj S, Gentile F, et al. Assessment of myocardial mechanics using speckle tracking echocardiography: fundamentals and clinical applications. J Am Soc Echocardiogr. 2010;23(4):351–69 quiz 453-5.
8. Wallace AG, Skinner NS Jr, Mitchell JH. Hemodynamic determinants of the maximal rate of rise of left ventricular pressure. Am J Phys. 1963;205:30–6. 9. Morimont P, Lambermont B, Desaive T, Janssen N, Chase G, D'Orio V.
Arterial dP/dtmax accurately reflects left ventricular contractility during shock when adequate vascular filling is achieved. BMC Cardiovasc Disord. 2012;12:13.
10. Tartiere JM, Logeart D, Beauvais F, Chavelas C, Kesri L, Tabet JY, et al. Non-invasive radial pulse wave assessment for the evaluation of left ventricular systolic performance in heart failure. Eur J Heart Fail. 2007;9(5):477–83. 11. De Hert SG, Robert D, Cromheecke S, Michard F, Nijs J, Rodrigus IE.
Evaluation of left ventricular function in anesthetized patients using femoral artery dP/dt(max). J Cardiothorac Vasc Anesth. 2006;20(3):325–30. 12. Group NCRRGW. Animal research: reporting in vivo experiments: the ARRIVE
guidelines. J Physiol. 2010;588(Pt 14):2519–21.
13. Kass DA, Yamazaki T, Burkhoff D, Maughan WL, Sagawa K. Determination of left ventricular end-systolic pressure-volume relationships by the conductance (volume) catheter technique. Circulation. 1986;73(3):586–95. 14. Baan J, van der Velde ET, de Bruin HG, Smeenk GJ, Koops J, van Dijk AD, et
al. Continuous measurement of left ventricular volume in animals and humans by conductance catheter. Circulation. 1984;70(5):812–23. 15. Sunagawa K, Sagawa K, Maughan WL. Ventricular interaction with the
loading system. Ann Biomed Eng. 1984;12(2):163–89.
16. Westerhof N, Lankhaar JW, Westerhof BE. The arterial Windkessel. Med Biol Eng Comput. 2009;47(2):131–41.
17. Chemla D, Hebert JL, Coirault C, Zamani K, Suard I, Colin P, et al. Total arterial compliance estimated by stroke volume-to-aortic pulse pressure ratio in humans. Am J Phys. 1998;274(2 Pt 2):H500–5.
18. Fitzmaurice GM, Laird NM, Ware JH. Modeling the covariance. Applied longitudinal analyss. 2nd ed. Hoboken: Wiley; 2011. p. 165–88. 19. Brown H, Prescott R. Repeated measures data. Applied mixed models in.
medicine. 2nd ed. Chichester; Hoboken: Wiley; 2006. p. 215–70. 20. Mebazaa A, Pitsis AA, Rudiger A, Toller W, Longrois D, Ricksten SE, et al.
Clinical review: practical recommendations on the management of perioperative heart failure in cardiac surgery. Crit Care. 2010;14(2):201. 21. Devereaux PJ, Goldman L, Cook DJ, Gilbert K, Leslie K, Guyatt GH.
Perioperative cardiac events in patients undergoing noncardiac surgery: a review of the magnitude of the problem, the pathophysiology of the events and methods to estimate and communicate risk. CMAJ. 2005;173(6): 627–34.
22. Guinot PG, Longrois D, Kamel S, Lorne E, Dupont H. Ventriculo-arterial coupling analysis predicts the hemodynamic response to norepinephrine in hypotensive postoperative patients: a prospective observational study. Crit Care Med. 2018;46(1):e17–e25.
23. Sagawa K. The ventricular pressure-volume diagram revisited. Circ Res. 1978; 43(5):677–87.
24. Suga H, Sagawa K, Shoukas AA. Load independence of the instantaneous pressure-volume ratio of the canine left ventricle and effects of epinephrine and heart rate on the ratio. Circ Res. 1973;32(3):314–22.
25. Cikes M, Solomon SD. Beyond ejection fraction: an integrative approach for assessment of cardiac structure and function in heart failure. Eur Heart J. 2016;37(21):1642–50.
26. Burns AT, La Gerche A, D'Hooge J, MacIsaac AI, Prior DL. Left ventricular strain and strain rate: characterization of the effect of load in human subjects. Eur J Echocardiogr. 2010;11(3):283–9.
28. Trepte CJ, Eichhorn V, Haas SA, Richter HP, Goepfert MS, Kubitz JC, et al. Thermodilution-derived indices for assessment of left and right ventricular cardiac function in normal and impaired cardiac function. Crit Care Med. 2011;39(9):2106–12.
29. Inuzuka R, Kuwata S, Kurishima C, Liang F, Sughimoto K, Senzaki H. Influence of cardiac function and loading conditions on the myocardial performance index - theoretical analysis based on a mathematical model. Circ J. 2016;80(1):148–56.
30. Quinones MA, Gaasch WH, Alexander JK. Influence of acute changes in preload, afterload, contractile state and heart rate on ejection and isovolumic indices of myocardial contractility in man. Circulation. 1976;53(2): 293–302.
31. Kass DA, Maughan WL, Guo ZM, Kono A, Sunagawa K, Sagawa K. Comparative influence of load versus inotropic states on indexes of ventricular contractility: experimental and theoretical analysis based on pressure-volume relationships. Circulation. 1987;76(6):1422–36. 32. Little WC. The left ventricular dP/dtmax-end-diastolic volume relation in
closed-chest dogs. Circ Res. 1985;56(6):808–15.
33. Van den Bergh A, Flameng W, Herijgers P. Parameters of ventricular contractility in mice: influence of load and sensitivity to changes in inotropic state. Pflugers Arch. 2008;455(6):987–94.
34. Nichols WW, O'Rourke M. Contours of pressure and flow waves in arteries. In: Nichols WW, O’Rourke M, editors. McDonald’s blood flow in arteries: theoretical, experimental and clinical principles. 5th ed. London: Oxford University Press; 2005. p. 165–91.
35. Borow KM, Neumann A, Marcus RH, Sareli P, Lang RM. Effects of simultaneous alterations in preload and afterload on measurements of left ventricular contractility in patients with dilated cardiomyopathy:
comparisons of ejection phase, isovolumetric and end-systolic force-velocity indexes. J Am Coll Cardiol. 1992;20(4):787–95.
36. Blaudszun G, Licker MJ, Morel DR. Preload-adjusted left ventricular dP/ dtmax: a sensitive, continuous, load-independent contractility index. Exp Physiol. 2013;98(10):1446–56.
37. Pinsky MR. Heart lung interactions during mechanical ventilation. Curr Opin Crit Care. 2012;18(3):256–60.