Effect of mill type on the size reduction and phase transformation
of gamma alumina
S.R. Chauruka
a, A. Hassanpour
a,n, R. Brydson
a, K.J. Roberts
a, M. Ghadiri
a, H. Stitt
b aSchool of Chemical and Process Engineering, University of Leeds, Leeds LS2 9JT, UK bJohnson Matthey Catalysts, P.O Box 1 Belasis Avenue, Billingham, Cleveland TS23 1LB, UK
H I G H L I G H T S
We study the effect of stress modes from three mills on structure of gamma-alumina.
Extent of size reduction and mechanochemical effects are analysed.
Jet milling is effective in size reduction and does not initiate mechanochemistry.
Shear-induced phase transformation is observed in planetary ball mill.
Transformation is by slip on alternate close packed oxygen layers from ccp to hcp.
a r t i c l e i n f o
Article history:
Received 21 January 2015 Received in revised form 28 May 2015
Accepted 1 June 2015 Available online 12 June 2015
Keywords:
Gamma alumina Planetary ball milling XRD
Phase transformation
a b s t r a c t
The influence of stress modes and comminution conditions on the effectiveness of particle size reduction of a common catalyst support;
γ
-Alumina is examined through a comparative assessment of three different mill types. Air jet milling is found to be the most effective in reducing particle size from ad90of 37mm to 2.9mm compared to planetary ball milling (30.2mm) and single ball milling (10.5mm). XRD and TEM studies confirm that the planetary ball mill causes phase transformation to the less desiredα
-Alumina resulting in a notable decrease in surface area from 136.6 m2/g to 82.5 m2/g as measured by the BET method. This is consistent with the large shear stresses under high shear rates prevailing in the planetary ball mill when compared to the other mill types. These observations are consistent with a shear-induced phase transformation mechanism brought about by slip on alternate close packed oxygen layers from a cubic close packed to a hexagonal close packed structure.&2015 The Authors. Published by Elsevier Ltd. This is an open access article under the CC BY license (http://creativecommons.org/licenses/by/4.0/).
1. Introduction
Milling is a widely used industrial operation common for cases where size reduction of particles is required (Reid et al., 2008). It can also be known as grinding and involves the size reduction of particles smaller than 10 mm. There is a vast range of mill types available commercially and the choice of mill is based on a variety of factors, such as properties of the material to be milled, e.g. failure mode, and the required product particle size (Angelo and Subramanian, 2008). Fig. 1 shows an array of size reduction equipment available for different combinations of feed and pro-duct particle sizes (Neikov et al., 2009).
Ball mills, vibratory mills, rod mills and jet mills can be used to achieve particles less than 1 mm in diameter (Rosenqvist, 2004) but for ultrafine dry milling, e.g. particles (d90¼o10mm),
vibratory ball milling, planetary ball milling (Kano et al., 2001) and air jet milling (Midoux et al., 1999) are commonly used methods. In these mills particle size is reduced by impact, shear, attrition or compression or a combination of them (Balaz et al., 2013). The stresses may affect product attributes in different and often‘unexpected’ways through mechanochemical activation, so an understanding of the mill function on the product character-istics is highly desirable for optimising product functionality. The material investigated in this paper,
γ
-Al2O3, is a versatile material used in many applications, including catalysis for the petroleum and automotive industries (Oberlander, 1984; Wefers, 1990). It is widely used for catalytic applications due to its favourable proper-ties which include a high surface area and porous morphology for good dispersion of metal catalysts as well as thermal and chemical stability for use in different catalytic reactions (Trueba and Trasatti, 2005; Rozita et al., 2013). However, in order for theγ
-Al2O3to befit for use as a catalyst support, it has to be reduced in size by milling.γ
-Al2O3 is derived from the dehydration of Boehmite (γ
-AlOOH) as one of the transition aluminas according Contents lists available atScienceDirectjournal homepage:www.elsevier.com/locate/ces
Chemical Engineering Science
http://dx.doi.org/10.1016/j.ces.2015.06.004
0009-2509/&2015 The Authors. Published by Elsevier Ltd. This is an open access article under the CC BY license (http://creativecommons.org/licenses/by/4.0/).
nCorresponding author. Tel.:þ44 113 343 2405.
to the sequence given in Eq.(1)(Liu and Zhang, 2005).
Boehmite450⟹oCγAl2O3⟹ 750o
C
δAl2O3⟹
900o
C
θAl2O3 ⟹
1100o
C1200o
C
α Al2O3
ð1Þ
From Boehmite,
γ
-Al2O3 can be produced at temperatures of between 4501C and 7501C. This is followed at higher calcination temperatures by a series of transformations to theδ
andθ
phases, whilst at temperatures between 11001C and 12001Cα
-Al2O3 is formed as thefinal thermodynamically stable phase with a structure based on a hexagonally close-packed oxygen sub-lattice structure(Liu and Zhang, 2005). For maximum catalytic effectiveness, it is essential to maintain the desired physical and chemical properties of
γ
-Al2O3in the milled product, e.g. high specific surface area and the absence of any phase changes (Trueba and Trasatti, 2005). Mechan-ochemical activation can cause microstructural changes to materials (Sopicka-Lizer, 2010). The planetary ball mill has been reported to induce mechanochemical phase transformations and reactions, the conditions of high stresses during milling are envisaged to play a major role in such phase transformations (Šepelák et al., 2007).Zielin´ski et al. (1993)reported on the phase transformation from
γ
toα
Al2O3by the use of this mill (Zielin´ski et al., 1993).Kostic et al. (2000)also reported on the phase transformation fromγ
toα
by the use of a vibrating disc mill (Kostic et al., 2000). Additionally, evidence of phase transformation due to milling, similar to that achieved by thermal dehydration of boehmite, has been reported in various works (Duvel et al., 2011; Wang et al., 2005). However [image:2.595.86.249.178.370.2]Bodaghi et al. (2008) observed no phase change in
γ
-Al2O3 after 30 h of milling in the Fritsch Pulverisette 7 planetary ball mill but reported the occurrence of phase change ofγ
-Al2O3toα
-Al2O3only after the addition ofα
-Al2O3 seeds into the mill (Bodaghi et al., 2008). According toBodaghi et al. (2008)theα
-Al2O3seeds act by reducing the transition temperature and activation energy forα
-Al2O3to nucleate (Bodaghi et al., 2008). It is therefore still necessary to carry out an in depth investigation into the effect of size reduction mechanisms brought about by different stress modes such as shear, impact, and compression on the surface and morphology or structure of the material. This is an essential starting point to understanding the initiation of the mechanochemical phase trans-formation that occurs inγ
-Al2O3during milling. The present work aims at exploring the size reduction ofγ
-Al2O3 using three mill types; single ball mill, air jet mill and planetary ball mill. In a similar manner to previous studies (Zhou and Snyder, 1991; Knozinger andFig. 1.Size reduction equipment available for different combinations feed size and product particle size (Neikov et al., 2009).
[image:2.595.84.523.410.721.2]Ratnasamy, 1978), X-ray diffraction (XRD) and Transmission Electron Microscopy (TEM) have been used to characterise the milled powders. The former is used to analyse the bulk crystal structure and crystallite size of the material, whilst the latter is used to observe any changes in morphology and crystallinity of
γ
-Al2O3. Laser diffraction and Scanning Electron Microscopy (SEM) have also been used to analyse particle size reduction of the material whilst nitrogen gas adsorption has been used to analyse any changes in specific surface area. This work is underpinned by a need to under-stand the size reduction mechanisms and their correlation with the milling conditions in order to achieve a better and consistent control and optimisation of the milling process, hence improving process efficiency and cost effectiveness due to the elimination of the trial and error work needed to improve product functionality.2. Materials and methods
The sample used for experiments is a commercially available
γ
-Al2O3 powder: a 99.99% pureγ
-Al2O3 derived from synthetic boehmite.Single ball milling (SBM) was carried out using a Retsch MM200 vibratory single ball mill. An 11 ml stainless steel milling jar with a 12 mm diameter spherical stainless steel ball is used for single ball milling for durations of up to 1200 min at a milling frequency of 30 Hz. In single ball milling (Fig. 2a), short duration collisions dominate and the energy generated by the mill is determined by the chosen milling frequency. This can be shown by the contact force distribution reported byKwan et al. (2005)
where the impact forces are the most dominant (Kwan et al., 2005). Size reduction is mainly by impact in the SBM although shear and attrition is also present during milling.
Jet milling (JM) was carried out using a Hosokawa Alpine 50AS spiral jet mill. The stress mode that effects size reduction in the air jet mill (Fig. 2b) is mainly impact, by way of particle–particle and particle–wall collisions. The collision energy is created by the high speedflow of compressed air (Neikov et al., 2009). Compressed air injection and grinding pressures of 6 bar and 4 bar have been used respectively and a maximum of 20 passes is used to achieve the desired size reduction.
Planetary ball milling (PBM) was carried out using a Fritsch Pulverisette 7 planetary ball mill. The planetary ball mill (Fig. 2c), is a high energy mill (Angelo and Subramanian, 2008), where shearing and compression are more prevalent than high velocity collisions. Two 45 ml zirconia (ZrO2) milling jars have been used with zirconia grinding balls of 15 mm diameter and the ball to powder ratio used in the experiments was 10:1 by weight. A milling speed of 700 revolutions min1 has been used for all planetary ball mill experiments with milling times ranging from 5 min to 300 min.
Characterisation is carried out on the as-received (A-R)
γ
-Al2O3 sample and after milling on the SBM, PBM and JM samples using laser diffraction, SEM, BET nitrogen gas adsorption, X-ray diffrac-tion and TEM. Laser diffracdiffrac-tion, using a Malvern Mastersizer 2000, has been carried out for particle size analysis, using water as carrier medium. The samples were dispersed using in-built ultra-sound and measured at an average obscuration of 12%.SEM analysis is carried out using a Carl Zeiss EVO MA15 scanning electron microscope at 20 kV in backscattered imaging mode. Carbon tabs were coated with powder samples and placed on SEM metal stubs. Sample stubs were sputter-coated with a conductive layer of gold before analysis to prevent charging. SEM quantitative analysis was carried out using Gatan Digital Micro-graph Particle Analysis Software (Gatan, 2014). Average particle sizes were calculated from the derived size distributions of a minimum of 500 particles. The coefficient of variation was also
derived by dividing the average particle size with the standard deviation of the size distributions.
As high surface area needs to be maintained for good catalyst support function, BET surface area measurements were carried out to analyse any changes in specific surface area in the different mills. This was done using BET nitrogen gas adsorption with the Micromeritics Tristar 3000. Samples were degassed at 4001C for a total of 4 h prior to analysis. BET particle sizes were estimated from specific surface area (SSA) by use ofdparticle(nm)¼6/(
ρn
SSA) wheredparticleis the particle size in nm,ρ
is the density in gm3 and SSA in m2g1is the specific surface area derived from BET (Rozita et al., 2013).XRD using the Bruker D8 Advance with monochromatic CuK
α
radiation (λ
¼0.154 nm) and a 2θ
range of 10–901, was employed for crystal phase analysis. Further XRD analysis was carried out by estimating the crystallite size using Scherrer's equation,dcrystallite (nm)¼(0.9λ
)/(Bcosθ
) (Cullity and Stock, 2001) where B is the full width half maximum (in radians) of the XRD peak at angle 2θ
andλ
is the X-ray wavelength. Xpert Highscore software (Panalytical, 2014) was used for all XRD analysis including the deriving of proportions of transitional aluminas in the samples. XRD average crystallite sizes were estimated by selecting 7 peaks corresponding to the dominant alumina phase (γ
peaks for A-R, SBM and JM samples andα
peaks for PBM sample) and using Scherrer's equation (Cullity and Stock, 2001).TEM using the FEI CM200field emission transmission electron microscope, operated at 200 kV, was used to characterise the crystallite morphology of
γ
-Al2O3 samples. Further quantitative analysis of primary particle size and shape was also carried out using Gatan Digital Micrograph. TEM average particle sizes were calculated quantitatively by sizing 30 particles from TEM images.3. Results
3.1. Particle size analysis using laser diffraction
3.1.1.
γ
-Al2O3particles before and after dry milling in the JM Samples ofγ
-Al2O3were fed through the JM for a total of 20 passes. Samples were collected for particle size analysis after 5, 10 and 15 passes.Fig. 3shows the particle size distribution (PSD) and cumulative PSD of the particles. As shown inTable 1, there was a significant size reduction between the as-received (A-R) samples and the sample after 20 passes also shown by the measured characteristic sizes of the particles where the A-R sample had ad90 of 49.10mm and the 20 pass sample had ad90of 2.89mm.The cumulative PSD inFig. 3b also showed an initially fast rate of size reduction between the A-R sample and the 5 pass sample which then reduced for subsequent passes; the 5 pass, 10 pass and 15 pass samples all showed a more continuous reduction in larger particles. Finally, the 20 pass sample showed a marked reduction in larger particles within the sample as the bimodal distribution in
Fig. 3a showed only a small peak for particles larger than 6mm. Particles larger than 6mm in the 20 pass sample highlight the importance of manipulating the feed rate of the sample into the mill as this can aid in reducing the number of non-milled particles after running a sample. Further milling was not carried out as the desired particle size was achieved (d90¼o10mm) after 20 passes through the JM.
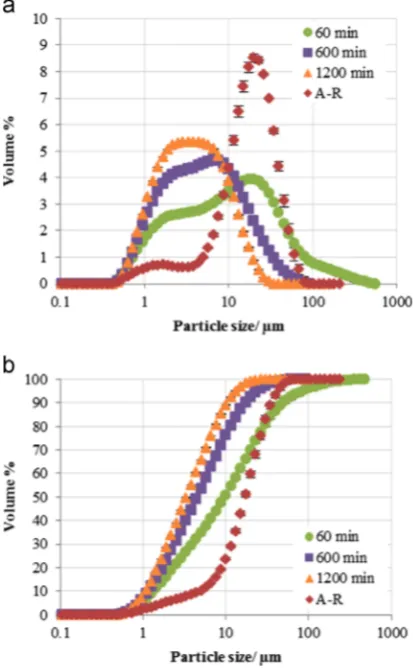
evident by the movement of the tail of the PSD graphs to smaller sizes with increased milling time.
The cumulative PSD also shows a significant size reduction between 60 min and 600 min of milling but a less significant difference between 600 and 1200 min.
Interestingly the PSD after 60 min milling showed larger particles than in the A-R sample. This is presumably due to adhesion offine particles with high surface energy on the surfaces of larger agglomerates. Further milling up to 600 and 1200 min ensures the breakage of these larger particles without any sig-nificant difference in the particle size reduction achieved.
3.1.3.
γ
-Al2O3particles before and after dry milling in the PBM Fig. 5shows the PSD of samples ofγ
-Al2O3milled using the PBM at 700 rpm. The characteristic sizes at different mill times are shown inTable 3. The results inTable 3andFig. 5show an initial significant decrease in particle size between the A-R sample and the sample after 10 min of milling; further milling up to 300 mindoes not result in a significant decrease in particle size. A small increase in the volume of particles within the sample which is larger than the initial feed size is noted as milling time is increased. This is also observed in the 60 min single ball milled samples.
3.1.4. Comparison of dry milling using different mills
Fig. 6shows a comparison of (a) the PSD and (b) the cumulative PSD of
γ
-Al2O3particles as-received (A-R) and after milling in the PBM for 300 min, SBM for 1200 min and JM for 20 passes.The PSDs in Fig. 6a show that the greatest size reduction of particles was achieved with the JM, albeit this gave a bimodal distribution with a majority of fine particles accompanied by smaller distribution of larger particles. For the ball milled samples, the SBM samples had smaller particle sizes than the PBM samples. However the PBM samples showed the greatest amount offines in all the milled samples, evident in the cumulative curves shown in
[image:4.595.64.275.57.379.2]Fig. 6b. The characteristic sizes can be shown in Table 4.
Fig. 3.PSD of jet milledγ-Al2O3samples showing (a) the PSD distribution and
[image:4.595.333.540.59.395.2](b) the cumulative PSD after 5, 10, 15 and 20 passes through the jet mill.
Table 1
Characteristic sizes (d10,d50andd90) of the A-R sample and samples milled by the jet mill for 5, 10, 15 and 20 passes.
Sample Particle size (lm)
D10 D50 D90
A-R 6.2 21.4 49.1
5 pass 0.9 3.6 16.2
10 pass 0.9 4.7 12.3
15 pass 0.7 1.8 10.7
20 pass 0.6 1.2 2.9
Fig. 4.PSD of single ball milledγ-Al2O3samples showing (a) the PSD distribution
[image:4.595.43.292.447.531.2]and (b) the cumulative PSD after 60, 600 and 1200 min of milling.
Table 2
Characteristic sizes (d10,d50andd90) of the A-R sample and samples milled by the single ball mill for 60, 600 and 1200 min.
Sample Particle size (lm)
D10 D50 D90
A-R 6.2 21.4 49.1
60 min 1.6 10.7 52.5
600 min 1.4 5.4 20.0
[image:4.595.311.564.461.538.2]Considering thed90particle sizes of the PBM, SBM, JM and A-R samples, the JM method appears more suitable for dry milling of
γ
-Al2O3particles.The particles from the JM samples show a steady decline in average particle sizes with further milling as observed inFig. 3and show no increase in particle size after a certain period of milling as that observed with the SBM and PBM in Figs. 4 and 5. The compressed air used for milling with the JM appears to aid in keeping the particles fairly dispersed as breakage occurs in the milling chamber. The short residence time in the milling chamber also reduces the possible number of contacts particles can have. This results in consistent particle size reduction. The PSD results for SBM samples (Fig. 4) and PBM samples (Fig. 5) show only a small reduction in size with increased milling time. This is between 600 and 1200 min for SBM (Fig. 4) and 15 and 300 min for PBM (Fig. 5). This is due to particles reducing in size to a critical value where the equilibrium state of milling is achieved. In this
[image:5.595.318.533.57.359.2]state, whilst particles are reduced in size by the milling energy supplied, at this critical size, the fines produced and broken agglomerates begin to form larger agglomerates joined by weak van der Waals forces and eventually form aggregates joined by stronger chemical bonds (Balaz et al., 2013). This results in a reduced effectiveness of the milling process in terms of achieving size reduction. This can also result in the assembly of agglomerates larger than the initial maximum feed size as observed in both SBM and PBM. The mechanism of size reduction in the SBM and PBM is however different; the SBM is mainly by impact whilst the PBM is mainly by both shear and impact. The shearing in the PBM continuously producesfines for all milling times, the agglomerates continue to grow as they are compacted onto the walls of the mill by the shearing and impact effect and this compaction onto the walls of the mill, results in strongly bonded agglomerates. This greatly reduces the effectiveness of the mill. The SBM, in turn, can initially producefines when large agglomerates are broken at the initiation of milling as observed after 60 mins. This can result in larger agglomerates being formed by weak bonds betweenfines and larger broken particles, but prolonged size reduction by
Fig. 5.PSD of planetary ball milledγ-Al2O3samples showing (a) the PSD
[image:5.595.52.267.57.398.2]distribu-tion and (b) the cumulative PSD after 10, 15, 30 and 300 mins of milling.
Table 3
Characteristic sizes (d10,d50andd90) of the A-R sample and samples milled by the planetary ball mill for 10, 15, 30 and 300 min.
Sample Particle size (lm)
D10 D50 D90
A-R 6.2 21.4 49.1
10 min 1.0 11.5 45.7
15 min 1.0 11.5 42.8
30 min 0.8 10.0 32.4
300 min 0.7 8.7 30.2
Fig. 6.Size analysis results for γ-Al2O3 particles showing (a) PSD and
[image:5.595.303.553.446.523.2](b) cumulative PSD of as-received (A-R) samples and after milling in the single ball mill (SBM) for 1200 min, planetary ball mill (PBM) for 300 min and jet mill (JM) for 20 passes.
Table 4
Characteristic sizes (d10,d50andd90) of the A-R sample and samples milled by the SBM, PBM and JM.
Sample Particle size (lm)
D10 D50 D90
A-R 6.2 21.4 49.1
PBM 0.7 8.7 30.2
SBM 1.9 4.1 11.5
[image:5.595.34.284.464.549.2]impact, results in breakage of these weakly bonded agglomerates and better size reduction than the PBM. Further milling was not carried out after 20 passes in the JM as the desired particle size of a d90less than 10mm had been achieved. Conditions of PBM after 300 min, SBM after 1200 min and JM after 20 passes were used for further comparative analysis of the three mills.
3.2. Characterisation of particle morphology using SEM analysis
Fig. 7shows SEM images for samples before and after milling in the SBM for 1200 min, PBM for 300 min and JM for a total of 20 passes. As laser diffraction measures particle size at random orientation, SEM analysis was used to analyse the maximum projected area and shape of the particles.Fig. 7a shows spherical agglomerates with smooth surfaces for A-R particles. After milling, the agglomerate shapes appeared less spherical and more random in terms of their shapes. The agglomerate surfaces also appeared rougher as shown in Fig. 7b–d. An accumulation of very fine particles on the surfaces of the agglomerates in the PBM samples is shown in Fig. 7c. This can reduce the efficiency of milling as broken particle reassemble to form large particles and this is also observed in the laser diffraction results in Fig. 5 where an equilibrium state of milling is observed.Fig. 7d for JM samples, when compared toFig. 7a–c at similar magnification, shows much finer material. A rough number-based quantitative analysis of SEM micrographs was carried out for analysis of average particle sizes and large particles and is shown inTable 5.
This was carried out for verification offines and larger particles observed in laser diffraction results. With an appreciation of the difference in the principles of the two sizing techniques, a similar trend to laser diffraction of size reduction of A-R-PBM-SBM -JM (from largest to smallest particles) was observed. The smallest particles were observed in the JM samples with majority of particles less than 3mm as shown inFig. 7d. SEM micrographs of
PBM samples showed a wide variation in the particle sizes and this is due to the large amount offines observed in the SEM images of the sample. Apart fromfines, the PBM sample also had particles larger than those observed in the A-R sample (106mm observed from laser diffraction). This was also correlated with the formation of agglomerates larger than the A-R sample during PBM milling observed in laser diffraction results.
3.3. Characterisation of surface area using BET
BET surface area measurements were carried out for A-R, SBM after 1200 min, JM after 20 passes and PBM after 300 min. According toTable 6, samples from the JM and SBM show a small increase in surface area when compared with the A-R sample. However there is a significant decrease in specific surface area for the PBM sample from 136.6 m2/g observed in the A-R sample to 82.6 m2/g. Furthermore, the size reduction of
γ
-Al [image:6.595.123.484.59.355.2] [image:6.595.311.563.425.477.2]2O3can be seen to result in a reduction in pore size and pore volume for all mills. Further analysis on the PBM samples was carried out by BET surface area measurements for the A-R sample and PBM samples milled for 60, 180 and 300 min as shown inFig. 8. The results show a reduction in specific surface area with milling: from 136.6 m2/g in the A-R sample to 119.8 m2/g after 60 mins, 76 m2/g after 180 min andfinally 82.6 m2/g in the 300 min milled PBM sample.
Fig. 7.SEM imaging ofγ-Al2O3particles showing (a) A-R sample, (b) SBM sample after 1200 min of milling, (c) PBM sample after 300 min of milling and (d) JM sample after
20 passes through the jet mill.
Table 5
SEM number-based quantitative particle size analysis for PBM 300 min, SBM 1200 min, JM 20 passes and A-R samples.
Sample A-R PBM SBM JM
Number-based Avg. Particle size (lm) 11.4 5.2 5.1 3.8
Coefficient of variation 0.9 3.7 1.4 1.0
The reduction in surface area in the PBM reflects a change in the structure of the sample during milling and will be further considered in the next section.
3.4. Characterisation of particle morphology by XRD analysis
Fig. 9shows the XRD patterns of the A-R
γ
-Al2O3sample and samples milled in dry state using SBM for 1200 min, PBM for 300 min and JM for 20 passes together with reference patterns forγ
-Al2O3andα
-Al2O3obtained from ICDD Database.Corresponding crystal sizes of these samples estimated from XRD patterns are presented inTable 7.
XRD analysis of all samples in Fig. 9shows similar diffracto-grams in the A-R, JM and SBM samples. These samples match well with ICDD referencefile 00-010-0425 for
γ
-Al2O3suggesting that the milling processes do not affect the crystal structure of the material. In contrast, the diffractogram of the PBM samples however show the majority of peaks matching to ICDD reference pattern 00-005-0712 forα
-Al2O3and some small peaks indicating a small amount of remainingγ
-Al2O3in the sample. This shows that dry planetary ball milling results in a change in the crystal structure of the material and induces a phase transformation from theγ
- to theα
-alumina phase correlating with the reduction in the surface area observed in the BET surface area measurements shown inFig. 8. Additional peaks not corresponding toα
- orγ
-Al2O3match to zirconia (ZrO2). This suggests contamination from the milling jar and milling media. [image:7.595.31.284.225.434.2]The crystallite sizes of the A-R and JM samples varied from 8 nm to 12 nm whilst the SBM
γ
-Al2O3 samples showed a significant increase in crystallite size from 8 nm to 14 nm showing growth ofγ
-Al2O3 during single ball milling. For PBM, the estimated size of the transformedα
-Al2O3 crystallites ranged between 20 nm and 30 nm indicating an increase in the crystallite size due to phase transformation and correlating with the results observed byKostic et al. (2000).Fig. 10shows the XRD diffracto-grams for samples dry milled in the PBM for 30, 60, 180 and 300 min. As milling time increased, the intensity of theα
-Al2O3 peaks was observed to increase. This shows that the transforma-tion fromγ
toα
occurs progressively over time during millingTable 6
BET surface area measurements for A-R, PBM, JM and SBM samples showing specific surface area, pore volume and pore size.
Variable Sample
A-R SBM JM PBM
BET surface area (m2
/g) 136.6 144.1 147.5 82.6
Pore volume (cm3
/g) 0.5 0.4 0.3 0.2
[image:7.595.31.284.225.430.2]Pore size(nm) 13.9 12.1 8.3 8.1
Fig. 8.BET surface area measurements for PBM samples after 0, 60, 180 and 300 min of milling showing specific surface area.
Fig. 9. XRD patterns of Al2O3showingα-Al2O3ICDD reference pattern
00-005-0712,γ-Al2O3ICDD reference pattern 00-010-0425, as-receivedγ-Al2O3andγ-Al2O3
[image:7.595.305.553.386.716.2]after milling in PBM (300 min), SBM (1200 min) and JM (20 passes).
Table 7
Crystallite sizes estimated from XRD patterns for as-received and after milling in PBM (300 min), SBM (1200 min) and JM (20 passes).
γ dcrystallite(nm) α dcrystallite(nm)
hkl A-R JM SBM hkl PBM
111 10.2 7.5 15.3 012 30.3 222 12.3 11.8 13.4 024 19.8 400 9.7 8.8 19.3 113 23.9
Fig. 10.XRD patterns of Al2O3showingα-Al2O3ICDD reference pattern
00-005-0712,γ-Al2O3ICDD reference pattern 00-010-0425, as-receivedγ-Al2O3andγ-Al2O3
[image:7.595.51.269.476.716.2]rather than being an instantaneous change. The proportions of
γ
-Al2O3 andα
-Al2O3 in the samples derived from XRD diffracto-grams are given inTable 8. Interestingly, theδ
andθ
states of alumina were never observed at any milling time.As the samples inFig. 10were milled without the addition of
α
-Al2O3 before milling, the results differ from the observations of Bodaghi et al. (2008), and show that with the appropriate milling conditions,α
-Al2O3can be produced mechanochemically without any seeding (Kostic et al., 2000). ZrO2 contamination was also observed to increase as milling progressed as the intensity of the ZrO2peak increased with prolonged milling times.3.5. Characterisation of particle morphology by TEM analysis
Fig. 11shows TEM brightfield images of: (a) the as-received
γ
-Al2O3and in (b), (c) and (d) the samples after dry milling in the JM [image:8.595.73.555.280.727.2]for a total of 20 passes, SBM for 300 mins and PBM for 1200 min, respectively. In all cases it is clear that these secondary particles are composed of agglomerates of nanometre-sized single crystal primary particles. A rough quantitative analysis of the average particle sizes and shapes was carried out and is shown inTable 9. The crystallite morphologies observed in the A-R sample appear plate-like with facetted edges; note elongated needle shapes are also observed depending on the orientation of the plate-like crystallites on the TEM supportfilm. The JM sample was similar in size and morphology to the A-R sample as shown in
Table 9. The SBM sample (Fig. 11c) however shows a mixture of plate-like facetted crystallites and less elongated, more rounded crystallites. The sizes of the plate-like crystallites in the SBM sample have an average size of 17.2 nm whilst the more rounded crystallites had an average size of 22.2 nm. The aspect ratio of the SBM samples (Table 9) is smaller than that observed in the A-R and JM samples. This suggests fracturing of elongated plates during SBM, which results in more equiaxed particles. Overall the primary
Table 8
Percentage ofγ-Al2O3andα-Al2O3phases in PBM milled samples at 60, 180 and
300 min based on area under matched peaks by the use of Xpert Highscore software (Panalytical, 2014).
Sample Phase composition
%γ-Al2O3 %α-Al2O3
60 min 59 41
180 min 46 54
300 min 6 94
Fig. 11.TEM micrographs illustrating the morphology of theγ-Al2O3 particles by brightfield TEM showing (a) A-R, (b) JM after 20 passes, (c) SBM after 1200 min milling, (d) (i) PBM after 300 min milling and (d)(ii) inset of single crystal after 300 min milling in PBM.
Table 9
Average particle sizes, coefficients of variation and aspect ratios from TEM images of JM, PBM, SBM and A-R samples.
Sample A-R JM SBM PBM
Avg. particle size (nm) 16.9 16.6 19.7 22.0
Coefficient of variation 0.5 0.2 0.2 0.2
crystals in the SBM samples appear slightly larger than those in the A-R and JM samples, providing evidence for coarsening of
γ
-Al2O3 particles with milling. This can be observed in Fig. 11c. However, the PBM samples, which from XRD had transformed toα
-Al2O3, showed more octahedral-shaped crystallites with an average size of 22.0 nm and a coefficient of variation of 0.24 as shown inFig. 11d (ii) andTable 9.4. Discussion of particle size and particle morphology results
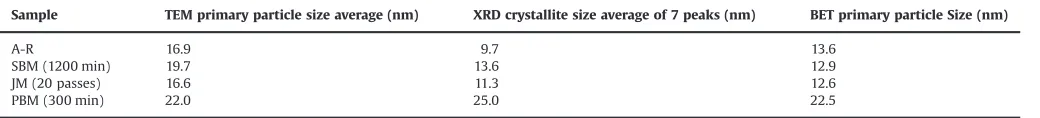
Further analysis was carried out by a comparison of particle or crystallite sizes for A-R, JM (20 passes), PBM (300 min) and SBM (1200 min), derived from BET, TEM and XRD as shown inTable 10. In general, for all samples there is reasonable agreement, qualitatively, between the sizes derived using the 3 techniques as the principles of measurement of the methods are different. The primary particles are single crystal in nature, as suggested in TEM bright field images. It is important to note that the
γ
-Al2O3 crystallite sizes (Table 10) estimated from XRD using the Scherrer's equation are smaller than those observed by TEM owing to presence of a core–shell structure withinγ
-Al2O3primary particles with a surface disordered shell surrounding a more ordered crystalline core as observed byRozita et al. (2013). Crystallite sizes for the JM samples were marginally smaller than the A-R sample suggesting grain size refinement. From XRD and TEM crystallite size averages, SBM samples showed larger crystallites. The PBM samples showed the largest crystallite sizes averaging ca. 25 nm and these match primary crystal sizes for Boehmite-derivedα
-Al2O3(Kim et al., 2007); here we also note that the TEM and XRD crystallite size data are closer in value, presumably due to the phase transformation to theα
-Al2O3crystal structure, which does not exhibit a disordered structure at the surface of the particles. The formation of largerα
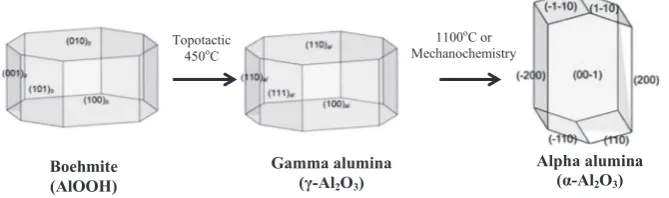
-Al2O3crystallites by a crystallographic rearrangement of the oxygen anion lattice from a cubic close packed to a hexagonal close packed structure that is stoichiome-trically balanced with less vacancies results in a reduction in specific surface area (Table 6). The dehydration of Boehmite to formγ
-Al2O3is a topotactic transformation resulting in a similar crystal arrangement (Fig. 12).Further dehydration results in less well-defined transition states (δ
andθ
phases), andα
-Al2O3is the final stable phase. However, mechanochemistry processes during milling appear to result in a transformation fromγ
-Al2O3 toα
-Al2O3 without any observation of the intermediateδ
andθ
transition states (Fig. 10). This transformation with an absence ofδ
andθ
transitional Al2O3 phases was also observed by Tonejc et al. (1994) who observedχ
andκ
transitional states instead. During all experiments, the temperature was measured using a laboratory thermometer. The highest recorded temperature during milling in the PBM was 801C suggesting that temperature rise alone cannot account for the phase transformation as tempera-tures of 11001C to 12001C are required to achieve phase trans-formation fromγ
-Al2O3toα
-Al2O3. Milling in the JM did not result in any significant temperature increase and the highest recorded temperature in the SBM was 301C. Local transient temperature peaks would be of more interest. Bulk temperature measurements are meaningless, and at best indicate only the rate of energydissipation as heat. In order to get peak temperature distribution, modelling work is required as currently no in situ measurement device (to our current knowledge) has such resolution.
The results suggest that a different mechanism to that of dehydration occurs during milling. It is observed that size reduc-tion by impact in the SBM and JM does not initiate phase change. However, the effect of shearing that is present in the PBM may be the main initiator of phase change by a shear-induced nucleation approach documented by Bagwell et al. (2001). In a shear mechanism, atoms in the region of transformation shift a short distance into a new crystal arrangement (Bagwell et al., 2001). In this case,
γ
-Al2O3exists as a cubic close-packed defective oxygen spinel structure with aluminium cations in interstitial positions in either octahedral or tetrahedral sites (or both) and vacancies. The defective structure ofγ
-Al2O3coupled with tri-axial stresses from the PBM can result in the movement of oxygen atoms by slip on close packed planes from the cubic close packed to the hexagonal close packed structure (Bagwell et al., 2001). It can therefore be suggested that the mode of mechanical energy supplied; impact, shear, attrition, as well as the amount of localised energy success-fully transferred from the mill to the powder during milling determines whether mechanochemistry will occur. From the pore volume and pore size results inTable 6, the PBM and JM samples show a more significant reduction in pore size and pore volume than the A-R and SBM samples. The surface area of the JM sample however remains high as compared to that of PBM. This suggests that the localised or contact energy supplied by both the PBM and JM may be higher than that supplied by the SBM which results in increased microstructural changes. The difference in stress mode, i.e. impact for JM and shear for PBM, may however, result in a different outcome, which in this case, is shear-induced phase transformation in the PBM and minimal grain size refinement in the JM. The impact energy in the JM (a high impact energy mill) has no effect on initiating phase change inγ
-Al2O3. It is more favourable as it promotes grain size refinement and an increase in surface area. A presence of limited shear stresses in the SBM (vibration milling) results in a small increase in crystallite size without transformation. The growth of crystals to a critical size is required for shear-induced phase transformation as stated byBagwell et al. (2001) and observed by Dynys and Halloran (1979). Therefore, growth of crystals in SBM is due to the shear stress supply by the mill which only affects crystal morphology but is not enough to overcome the energy barrier for phase transformation. The PBM however supplies the adequate amount of shear stress which favours shear nucleation of
α
-Al2O3 fromγ
-Al2O3.5. Conclusions
[image:9.595.33.553.81.140.2]Jet milling is a more suitable size reduction method for dry milling of
γ
-Al2O3powders when compared with planetary ball milling and single ball milling, as it effectively reduces size with minimal effect on the morphology of the material. Dry planetary ball milling results in a phase change fromγ
toα
-Al2O3 as observed by XRD patterns and octahedral crystal shapes in TEM. A significant loss of surface area from 136.6 m2/g to 82.6 m2/g isTable 10
Primary particle sizes as observed using TEM and estimated from XRD and BET.
Sample TEM primary particle size average (nm) XRD crystallite size average of 7 peaks (nm) BET primary particle Size (nm)
A-R 16.9 9.7 13.6
SBM (1200 min) 19.7 13.6 12.9
JM (20 passes) 16.6 11.3 12.6
evident in the planetary ball mill samples, rendering the planetary ball mill as less suitable for size reduction of catalyst supports. The observation of transformation in planetary ball milled samples can be attributed to high shear stresses in the mill that result in shear nucleation and formation of
α
-Al2O3. Contamination of samples with ZrO2also occurs during planetary ball milling and is observed to increase with time. The results favour a shear nucleation mechanism of phase transformation where the formation ofα
-Al2O3occurs by slip on close packed oxygen planes and results in a change from the cubic close packed to hexagonally close packed structure.Acknowledgements
Thefinancial support of Johnson Matthey Plc and EPSRC, UK (grant no. 11220198) for a Ph.D. for thefirst author is gratefully acknowledged. The authors are thankful to Dr J. Villoria, Dr J. Rodriguez, Dr D. Ozkaya, Dr A. Wagland, Dr M. Marigo and Dr J. Dalton for helpful comments during meetings and project coordination.
References
Angelo, P.C., Subramanian, R., 2008. Powder Metallurgy: Science, Technology and Applications. PHI Learning, New Delhi, pp. 22–23.
Bagwell, R.B., Messing, G.L., Howell, P.R., 2001. The formation ofα-Al2O3fromθ
-Al2O3: The relevance of a critical size and diffusional nucleation or
synchro-shear. J. Mater. Sci. 6, 1833–1841.
Balaz, P., Achimovicova, M., Balaz, M., Billik, P., Cherkezova-Zheleva, Z., Criado, J.M., Delogu, F., Dutkova, E., Gaffet, E., Gotor, F.J., Kumar, R., Mitov, I., Rojac, T., Senna, M., Streletskii, A., Wieczorek-Ciurowa, K., 2013. Hallmarks of mechanochem-istry: from nanoparticles to technology. Chem. Soc. Rev. 42, 7571–7637.
Bodaghi, M., Mirhabibi, R., Zolfonun, H., Tahriri, M., Karimi, M., 2008. Investigation of phase transition of-alumina via mechanical milling method. Phase Transit. 8, 571–580.
Cullity, B.D., Stock, S.R., 2001. Elements of X-Ray Diffraction. Prentice-Hall Inc., pp. 167–171.
Duvel, A., Romanova, E., Sharifi, M., Freude, D., Wark, M., Heitjans, P., Wilkening, M., 2011. Mechanically induced phase transformation ofγ-Al2O3 intoα-Al2O3.
Access to structurally disordered γ-Al2O3 with a controllable amount of
pentacoordinated Al sites. J. Phys. Chem. C 115, 22770–22780.
Dynys, F.W., Halloran, J.W., 1979. Alpha alumina formation in alum derived gamma alumina. J. Am. Ceram. Soc. 65, 442–448.
Gatan, 2014. Digital Micrograph Offline. Accessed from the World Wide Web; 6 September 2014.〈http://www.gatan.com/resources/scripting/demo/〉.
Kano, J., Mio, H., Saito, F., Miyazaki, M., 2001. Correlation of grinding rate of gibbsite with impact energy in tumbling mill with mono-size balls. Miner. Eng. 14, 1213–1223.
Kim, S.M., Lee, Y.J., Jun, K.W., Park, J.Y., Potdar, H.S., 2007. Synthesis of thermo-stable high surface area alumina powder from sol–gel derived boehmite. Mater. Chem. Phys. 104, 56–61.
Knozinger, H., Ratnasamy, P., 1978. Catalytic aluminas: surface models and characterization of surface sites. Catal. Rev.: Sci. Eng. 17, 31–70.
Kostic, E., Kiss, S.J., Zec, S., Boskovic, S., 2000. Transition ofγ-Al2O3intoα-Al2O3
during vibro milling. Powder Technol. 107, 48–53.
Kwan, C.C., Mio, H., Chen, Y.Q., Ding, Y.L., Saito, F., Papadopoulos, D., Bentham, A.C., Ghadiri, M., 2005. Analysis of the milling rate of pharmaceutical powders using the distinct element method (DEM). Chem. Eng. Sci. 60, 1441–1448.
Liu, S., Zhang, L., 2005. Phase transformation of mechanically milled nano-sizedγ -alumina. J. Am. Ceram. Soc. 88, 2559–2563.
Midoux, N., Hosek, P., Pailleres, L., Authelin, J.R., 1999. Micronization of pharma-ceutical substances in a spiral jet mill. Powder Technol. 104 (2), 113–120.
Neikov, O.D., Naboychenko, S., Mourachova, I.B., Gopienko, V.G., Frishberg, D.V., Lotsko, D.V., 2009. Handbook of Non-ferrous Metal Powders: Technologies and Applications. Elsevier.
Oberlander, K., 1984. Applied Industrial Catalysis. Academic Press, New York p. 63. Panalytical B.V., 2014. Highscore with Plus Option. Accessed from the World Wide Web; 3 September 2014. 〈http://www.panalytical.com/Xray-diffraction-soft ware/HighScore-with-Plus-option.htm〉.
Reid, C.B., Forrester, J.S., Goodshaw, H.J., Kisi, E.H., Suaning, G.J., 2008. A study in the mechanical milling of alumina powder. Ceram. Int. 34, 1551–1556.
Rosenqvist, T., 2004. Principles of Extractive Metallurgy. Tapir Academic Press, Trondheim Norway p. 506.
Rozita, Y., Brydson, R., Comyn, T.P., Scott, A., Hammond, C., Brown, A., Chauruka, S., Hassanpour, A., Young, N.P., Kirkland, A.I., Sawada, H., Smith, R.I., 2013. A study of commercial nanoparticulate-Al2O3 catalyst supports. ChemCatChem 5,
2695–2706.
Šepelák, V., Indris, S., Heitjans, P., Becker, K.D., 2007. Direct determination of the cation disorder in nanoscale spinels by NMR, XPS, and Mössbauer spectroscopy. J. Alloy. Compd. 434, 776–778.
Sopicka-Lizer, M., 2010. High-Energy Ball Milling: Mechanochemical Processing of Nanopowders. Elsevier, pp. 1–13.
Tonejc, A., Tonejc, A.M., Bagovid, D., Kosanovid, C., 1994. Comparison of the transformation sequence fromγ-ALOOH (boehmite) toα-Al2O3(corundum)
induced by heating and by ball milling. Mater. Sci. Eng. 182, 1227–1231.
Trueba, M., Trasatti, S.P., 2005.γ-Alumina as a support for catalysts: a review of fundamental aspects. Eur. J. Inorg. Chem. 2005, 3393–3403.
Wefers, K., 1990. Alumina Chemicals: Science and Technology Handbook. The American Ceramic Society, Westerville, Ohio p. 13.
Wang, Y., Suryanarayana, C., An, L., 2005. Phase transformation ofγ-Al2O3during
high-energy ball milling. J. Am. Ceram. Soc. 88, 780–783.
Zielin´ski, P.A., Schulz, R., Kaliaguine, S., Van Neste, A., 1993. Structural transforma-tion of alumina by high-energy ball milling. J. Mater. Res. 8, 2985–2992.
Zhou, R.S., Snyder, R.L., 1991. Structures and transformation mechanisms of theη,γ andθtransition aluminas. Acta Crystallogr. Sect. B 47, 617–630.
1100oC or Mechanochemistry Topotactic
450oC
Boehmite (AlOOH)
Gamma alumina (γ-Al2O3)
[image:10.595.137.472.64.163.2]Alpha alumina (α-Al2O3)