White Rose Research Online URL for this paper: http://eprints.whiterose.ac.uk/90517/
Version: Accepted Version
Article:
Mason, J, Bownes, P, Carey, B et al. (1 more author) (2015) Comparison of focal boost high dose rate prostate brachytherapy optimisation methods. Radiotherapy and Oncology, 117 (3). pp. 521-524. ISSN 0167-8140
https://doi.org/10.1016/j.radonc.2015.09.021
© 2015, Elsevier. Licensed under the Creative Commons Attribution-NonCommercial-NoDerivatives 4.0 International http://creativecommons.org/licenses/by-nc-nd/4.0/
[email protected] https://eprints.whiterose.ac.uk/
Reuse
Unless indicated otherwise, fulltext items are protected by copyright with all rights reserved. The copyright exception in section 29 of the Copyright, Designs and Patents Act 1988 allows the making of a single copy solely for the purpose of non-commercial research or private study within the limits of fair dealing. The publisher or other rights-holder may allow further reproduction and re-use of this version - refer to the White Rose Research Online record for this item. Where records identify the publisher as the copyright holder, users can verify any specific terms of use on the publisher’s website.
Takedown
If you consider content in White Rose Research Online to be in breach of UK law, please notify us by
Comparison of focal boost high dose rate prostate brachytherapy
optimisation methods
Josh Masona, Peter Bownesa, Brendan Careya, Ann Henrya
a - Leeds Cancer Centre, Leeds, UK
Corresponding author:
Josh Mason
Department of Medical Physics
St James's University Hospital
Leeds LS9 7TF
United Kingdom
44 113 20 67905
Running title:
HDR prostate focal boost optimisation
Keywords:
Multi-parametric MRI; prostate brachytherapy; focal boost, sector
optimisation
This manuscript is nine pages including title page, summary and references.
Summary
For HDR prostate brachytherapy treatments of 15Gy to the whole gland plus
focal boost, optimisation to either tumour plus margin (F-PTV) or involved
sectors was compared. For 15 patients median F-PTV D90 and V150 were
21.0Gy and 77.2% for F-PTV optimisation and 19.8Gy and 75.6% for sector
Introduction
In radiotherapy for prostate cancer, it is common practice to prescribe one
dose level to the whole prostate, as prostate cancer is known to be a
multi-focal disease. Tumour control probability may be improved with a multi-focal
boost treatment where the whole gland is treated to the standard dose
prescription and a focal boost dose is given to the dominant intra-prostatic
lesion (DIL) [1,2] or other CTV sub-volume as described in GEC-ESTRO
recommendations [3]. Focal boost treatments in high dose rate (HDR)
prostate brachytherapy [4-7] typically use multi-parametric-MRI (mp-MRI)
for tumour delineation; this is then fused to images acquired after needle
insertion for treatment planning. Targeting of the focal boost dose is
therefore impacted by uncertainties in tumour delineation and image fusion.
Two approaches to mitigating these uncertainties are (i) applying a margin
to the delineated tumour or (ii) dividing the prostate into sectors and
boosting the sectors involved in the tumour. In this study dose optimisation
is compared for the two approaches.
Many patients have several months of hormone therapy before HDR
prostate brachytherapy and this can reduce prostate size and tumour
conspicuity. Ideally treatment planning MRI scans are acquired after
hormone therapy however pre-hormone therapy scans may be used if MRI
capacity is limited. In the latter case due to prostate volume changes
boosting based on involved prostate sectors may be the preferred approach
to reducing image fusion uncertainties. In this study pre- and post-hormone
therapy MRI scans are compared to determine whether or not the same
prostate sectors are identified as being involved before and after hormone
therapy.
Method
16 patients included in an mp-MRI guided focal boost prostate HDR
brachytherapy pilot study [6] were retrospectively analysed for this
investigation. The patients were aged 57 - 77 years, with biopsy proven
Gleason 7 - 9. All patients received 2 - 5 months (mean 3 months) hormone
therapy before treatment with a single fraction of 15Gy to the whole
prostate planned using intra-operative trans-rectal ultrasound (TRUS),
including focal boost to the visible tumour (detailed below), followed by
37.5Gy in 15 fractions of external beam to the prostate and seminal vesicles
[8].
Pre-hormone therapy staging mp-MRI scans were performed 3 - 6 months
(mean 4 months) before brachytherapy and pre-treatment mp-MRI scans in
the week before brachytherapy. The mp-MRI sequences are detailed in the
supplementary material and included T2-weighted (T2W) MRI, diffusion
weighted MRI (DWI) and dynamic-contrast enhanced MRI (DCE-MRI)
(DCE-MRI was included in the pre-treatment scans but not the staging
scans). Focal gross tumour volume (F-GTV) targets for focal boost were
delineated on the MRI data by a consultant radiologist. This was done at the
time of brachytherapy treatment for the pre-treatment MRI scans, with the
delineated F-GTV fused to TRUS to perform focal boost treatments.
F-GTVs were based on the combination of all suspicious areas on the
mp-MRI sequences with multiple separate F-GTVs per patient if appropriate.
For the focal boost treatments a 4.5mm margin in all directions (constrained
to avoid the urethra and remain inside the prostate capsule) was applied to
the F-GTV to generate an F-PTV, on the TRUS images, to allow for tumour
delineation and image registration uncertainties [6]. Staging scans were
delineated more than one year after the last patient treatment for this
retrospective planning study. For consistency of MRI scan parameters, only
staging scans performed at the same centre as pre-treatment scans were
analysed, which restricted this part of the study to 10 patients. For both sets
of MRI data, the prostate volume was determined to assess the effects of
hormone therapy. 12 prostate sectors were defined by first dividing into
three base, mid-gland and apex segments, and then dividing each of these
into four sectors: right anterior, left anterior, right posterior and left
posterior. The sectors intersected by the F-GTV/F-PTVs were manually
Treatment plans were generated using DVH-based inverse optimisation in
Oncentra Prostate™ v4.0 [9], with minor manual adjustments to dwell times
applied if necessary to meet plan objectives and constraints: prostate V100 >
95%, PTV V100 > 95%, urethra D10 <17.5 Gy and rectum D2cm3 < 11.8 Gy,
Vrect,100 = 0 (PTV = prostate + 3mm, 0mm posteriorly, 100% dose = 15Gy).
2mm spaced dwell positions were activated throughout the PTV. Three
optimisation strategies were compared for each patient.
- Standard plans with optimisation objectives set to give 100% dose to
the whole prostate.
- F-PTV boost plans with optimisation objectives set to give 150%
dose to as much of the F-PTV as possible while giving 100% dose to
the remainder of the prostate and maintaining the plan objectives and
constraints listed above.
- Sector boost plans with optimisation objectives set to give 150%
dose to as much as possible of the prostate sectors intersected by the
F-PTV, while giving 100% dose to the other sectors and maintaining
the plan objectives and constraints listed above.
All treatment plans were based on the pre-treatment mp-MRI data fused to
planning TRUS. Plans used the same needle positions except that up to two
additional needles were inserted to target the F-GTV if required for focal
boost plans. Note that the involved sectors boosted in sector boost plans
were determined from the TRUS F-PTVs to allow direct comparison of
optimisation to the F-PTV boost plans. If implementing sector boost in
clinical practice it would not be necessary to generate F-PTVs so that the
tumour delineation and image fusion steps would not be required.
Results
One patient had no visible tumour in the pre-treatment MRI scan so was
excluded from the optimisation study. Of the remaining fifteen patients, five
had bi-lateral disease and ten had uni-lateral disease. Table 1 summarises
the DVH values achieved in the optimisation study. The per-patient median
F-PTV-based and 9.8 cm3 (2.2 cm3- 14.2 cm3) in sector-based focal boost
plans. Median prostate conformal index [10] values were 0.62, 0.62 and
0.61 in standard, F-PTV boost and sector boost plans respectively. Median
PTV conformal index [10] values were 0.87, 0.85 and 0.84 in standard,
F-PTV boost and sector boost plans respectively. The number of involved
sectors per patient were one (one patient), two (five patients), three (three
patients), four (four patients), five (one patient) and six (one patient). In
almost all cases the involved sectors were adjacent. Across all patients 47
sectors were boosted, with 37 posterior and 10 anterior, and 6, 23 and 18 in
apex, mid-gland and base segments respectively. Suppl Figure 1 (in
supplementary material) shows an isodose comparison for one patient in the
study. Higher doses and better coverage was achieved for posterior sectors
compared to anterior sectors due to the position of the urethra. The median
D90 and V150 were 18.4 Gy and 53.3% for anterior sectors and 21.0 Gy
and 80.6% for posterior sectors.
For the 10 patients for whom staging and pre-treatment scan tumour
delineations were compared, the median prostate volume was 30.4 cm3 in
the staging scan and 21.8 cm3 in the pre-treatment scan, corresponding to a
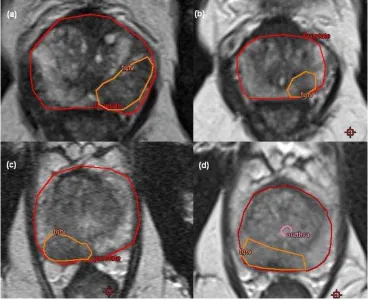
median reduction in volume of 28% (range 4% - 54%). Tumour delineation
examples are shown in Figure 1. For five patients the involved sectors were
identical in staging and pre-treatment scans. For four patients the involved
sectors overlapped but did not exactly match - in three cases this was due to
delineation variation as the tumour was less conspicuous in the
pre-treatment scan and in one case this was due to changes in prostate
morphology along with a large reduction in prostate volume (over 50%).
For one patient there was no visible tumour on the pre-treatment MRI but
tumour was delineated on the pre-hormone therapy staging MRI.
Discussion
This study has compared two different strategies for accounting for
uncertainties in tumour delineation and image fusion in focal boost
F-PTV, and giving a focal boost to the involved prostate sectors. Optimising
to the involved sectors rather than F-PTVs was possible without
compromising prostate and PTV coverage, and without exceeding OAR
tolerances. Sector boost plans were similar to F-PTV boost plans, although
with slightly lower boost dose to the F-PTV itself. There are no published
studies of sector based focal boost planning in HDR prostate brachytherapy.
A systematic review by Bauman et al. [11] of treatments boosting an
imaging defined F-GTV found that brachytherapy studies achieved
130-155% boost doses. In this study the median F-GTV D90 in F-PTV boosted
plans was 162% but in the sector boosted plans the F-GTV D90, at 149%,
was still comparable to those studies, suggesting that the sector boost
approach is an acceptable compromise even though it is less tightly targeted
that the F-PTV boost approach. Because the involved sectors represent a
higher proportion of the prostate volume than F-PTVs, the overall volume
of the prostate that receives a boost dose is higher in sector boost plans with
no detrimental impact on OAR dose. Sector boost doses were higher for
posterior sectors than for anterior sectors – generally the anterior sectors are
closer to the urethra and smaller than the posterior sectors. Similar results
are also seen for F-PTVs, with lower boost doses achieved for F-PTVs
located closer to the urethra. The study has used a standardized approach to
selecting sectors for boosting but in clinical practice a judgment would need
to be made on an individual patient basis using the size and location of the
tumour, the amount of shrinkage due to hormone therapy, and the
uncertainty in mapping sector positions from MRI to TRUS, to determine
whether sectors adjacent to the involved sectors should be included in the
boosted volume.
If access to MRI is limited staging MRI scans may be used for focal boost
treatment planning but this increases the difficulty of image fusion if
patients have received hormone therapy between the staging MRI scan and
treatment, due to changes in prostate morphology and volume. In this study
all 10 patients for whom staging scans were available had received several
resulted in reductions in prostate volume as well as changes in the relative
sizes of central gland and peripheral zone [12]. Differences in tumour
delineation occur even when the same images are delineated on separate
occasions and hormone therapy will reduce the contrast between normal and
cancerous prostate tissue. It is therefore not surprising that there were
differences in the sectors selected as involved in the tumour between staging
and pre-treatment scans. Similar results were reported in a study by
Groenendaal et al [13] comparing tumour delineation before and after
hormone therapy, who found that a longer duration of hormone therapy was
associated with reduced tumour conspicuity but that tumours were still
identified in 18 out of 21 cases after >3months hormone therapy. These
differences between pre-treatment and staging scans underline the
importance of using mp-MRI to improve confidence in tumour delineation.
A limitation of this study is that DCE-MRI was not routinely used on
staging scans at the time these patients were scanned which may contribute
to the differences observed compared to pre-treatment scans.
Sector boosting does not adversely affect plan optimisation results
compared to F-PTV boosting, and provides an alternative approach to
delineating and fusing tumours that may be preferable if staging scans are
REFERENCES
[1] Karavitakis M, Ahmed HU, Abel PD, Hazell S Winkler MH. Tumor focality in prostate cancer: implications for focal therapy. Nat Rev Clin Oncol 2011;8:48-55.
[2] Dearnaley DP, Sydes MR, Graham JD, et al. Escalated-dose versus standard-dose conformal radiotherapy in prostate cancer: first results from the MRC RT01 randomised controlled trial. Lancet Oncol 2007;8:475-487.
[3] Hoskin PJ, Colombo A, Henry A, et al. GEC/ESTRO
recommendations on high dose rate afterloading brachytherapy for localised prostate cancer: An update. Radiother Oncol
2013;107:325-332
[4] Dankulchai P, Alonzi R, Lowe GJ, Burnley J, Padhani AR Hoskin PJ. Optimal source distribution for focal boosts using high dose rate (HDR) brachytherapy alone in prostate cancer. Radiother Oncol 2014;113:121-125.
[5] Kim Y, Hsu I, Chow J, et al. Class solution in inverse planned HDR prostate brachytherapy for dose escalation of DIL defined by
combined MRI/MRSI. Radiother Oncol 2008;88:148-155. [6] Mason J, Al-Qaisieh B, Bownes P, et al. Multi-parametric
MRI-guided focal tumor boost using HDR prostate brachytherapy: A feasibility study. Brachytherapy 2014;13:137-145.
[7] Pouliot J, Kim Y, Lessard E Hsu I. Inverse planning for HDR prostate brachytherapy used to boost dominant intraprostatic lesions defined by magnetic resonance spectroscopy imaging. Int J Radiat Oncol Biol Phys 2004;59:1196-1207.
[8] Morton G, Loblaw A, Cheung P, et al. Is single fraction 15Gy the preferred high dose-rate brachytherapy boost dose for prostate cancer? Radiother Oncol 2011;100:463-467.
[9] Oncentra Prostate Reference Manual 190.037ENG-05: Nucletron. [10] Baltas D, Kolotas C, Geramani K, et al. A conformal index (COIN)
to evaluate implant quality and dose specification in brachytherapy. Int J Radiat Oncol Biol Phys 1998;40:515-524.
[11] Bauman G, Haider M, Van der Heide UA Ménard C. Boosting imaging defined dominant prostatic tumors: A systematic review. Radiother Oncol 2013;107:274-281.
[12] Padhani AR, MacVicar AD, Gapinski CJ, et al. Effects of Androgen Deprivation on Prostatic Morphology and Vascular Permeability Evaluated with MR Imaging. Radiology 2001;218:365
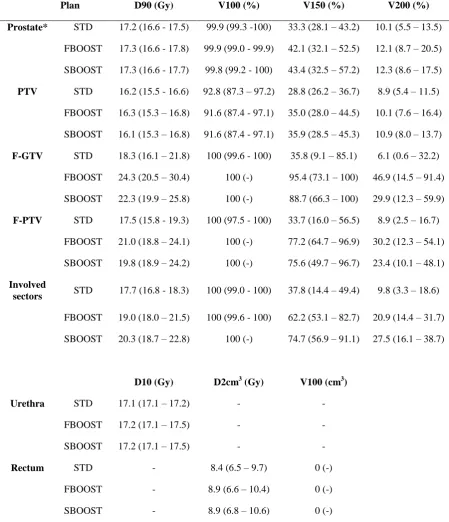
Table 1 Median DVH values for the 15 patients in the optimisation study. For F-GTV,
F-PTV and sectors, the values shown are the median (range) of the combined values
(for both F-GTVs/F-PTVS or all sectors) for each patient
Plan D90 (Gy) V100 (%) V150 (%) V200 (%)
Prostate* STD 17.2 (16.6 - 17.5) 99.9 (99.3 -100) 33.3 (28.1 – 43.2) 10.1 (5.5 – 13.5)
FBOOST 17.3 (16.6 - 17.8) 99.9 (99.0 - 99.9) 42.1 (32.1 – 52.5) 12.1 (8.7 – 20.5)
SBOOST 17.3 (16.6 - 17.7) 99.8 (99.2 - 100) 43.4 (32.5 – 57.2) 12.3 (8.6 – 17.5)
PTV STD 16.2 (15.5 - 16.6) 92.8 (87.3 – 97.2) 28.8 (26.2 – 36.7) 8.9 (5.4 – 11.5)
FBOOST 16.3 (15.3 – 16.8) 91.6 (87.4 - 97.1) 35.0 (28.0 – 44.5) 10.1 (7.6 – 16.4)
SBOOST 16.1 (15.3 – 16.8) 91.6 (87.4 - 97.1) 35.9 (28.5 – 45.3) 10.9 (8.0 – 13.7)
F-GTV STD 18.3 (16.1 – 21.8) 100 (99.6 - 100) 35.8 (9.1 – 85.1) 6.1 (0.6 – 32.2)
FBOOST 24.3 (20.5 – 30.4) 100 (-) 95.4 (73.1 – 100) 46.9 (14.5 – 91.4)
SBOOST 22.3 (19.9 – 25.8) 100 (-) 88.7 (66.3 – 100) 29.9 (12.3 – 59.9)
F-PTV STD 17.5 (15.8 - 19.3) 100 (97.5 - 100) 33.7 (16.0 – 56.5) 8.9 (2.5 – 16.7)
FBOOST 21.0 (18.8 – 24.1) 100 (-) 77.2 (64.7 – 96.9) 30.2 (12.3 – 54.1)
SBOOST 19.8 (18.9 – 24.2) 100 (-) 75.6 (49.7 – 96.7) 23.4 (10.1 – 48.1)
Involved
sectors STD 17.7 (16.8 - 18.3) 100 (99.0 - 100) 37.8 (14.4 – 49.4) 9.8 (3.3 – 18.6)
FBOOST 19.0 (18.0 – 21.5) 100 (99.6 - 100) 62.2 (53.1 – 82.7) 20.9 (14.4 – 31.7)
SBOOST 20.3 (18.7 – 22.8) 100 (-) 74.7 (56.9 – 91.1) 27.5 (16.1 – 38.7)
D10 (Gy) D2cm3 (Gy) V100 (cm3)
Urethra STD 17.1 (17.1 – 17.2) - -
FBOOST 17.2 (17.1 – 17.5) - -
SBOOST 17.2 (17.1 – 17.5) - -
Rectum STD - 8.4 (6.5 – 9.7) 0 (-)
FBOOST - 8.9 (6.6 – 10.4) 0 (-)
SBOOST - 8.9 (6.8 – 10.6) 0 (-)
STD – standard plan delivering 15Gy to the whole prostate
FBOOST –plan delivering 15Gy to the whole prostate and escalating dose to the F-PTV(s)
SBOOST –plan delivering 15Gy to the whole prostate and escalating dose to the involved
sector(s)
Figure 1: Staging and pre-treatment MRI . (a) and (b) are from staging and
pre-treatment MRI s respectively for the same patient illustrating prostate
and tumour shrinkage. (c) and (d) are from staging and pre-treatment MRIs
respectively for a different patient and illustrate that tumour can be more
difficult to distinguish in the pre-treatment MRI (post hormone therapy).
Note in all cases the delineated tumour volumes were based on mp-MRI
data, not just on the T2 weighted images shown.
Suppl Figure 1 Comparison of isodoses for a patient with F-PTV in the right
anterior and right posterior mid-gland sectors. (a) no boost plan (b) F-PTV
boost plan (c) sector boost plan.
MRI acquisition
Scans were performed on an Avanto (Siemens AG, Munich, Germany) 1.5T
scanner, using phased-array pelvic and spine coils for signal reception. All
MRI images were acquired in transverse-oblique planes such that
slice-by-slice the posterior edge of the prostate remains in as consistent a position as
possible. This is designed to assist matching of prostate position in MRI to
TRUS image registration for treatment planning. T2W MRI used a
turbo-spin echo (SE) sequence with repetition time (TR) 4970ms, echo time (TE)
87ms, echo train length 13, 0.7mm pixel size, slice thickness 2.5mm (no
slice gap) (3mm slice thickness for the staging scans), 28 slices, field of
view (FOV) 220mm. DWI MRI used a single shot SE-echo planar imaging
(EPI) sequence with TR 3000ms, TE 77ms, 1.4mm pixel size, slice
thickness 4.5mm (0.5mm gap), 14 slices, FOV 220mm, b-values 0, 150,
500, 750 s/mm2. Apparent diffusion coefficient (ADC) maps generated by
the scanner from all b-values were used for subsequent analysis. DCE MRI
(included in the pre-treatment MRI scans only) used a 3D spoiled gradient
echo sequence with TR 4.4ms, TE 1.2ms, flip angle 21°, 2x2x5mm pixel
size, FOV 320mm and 20 slices (6 additional slices were acquired
superiorly to reduce in-flow effects). 200 acquisitions were acquired with 2s
time resolution. A bolus injection of 0.1mmol/kg Dotarem® (Guerbet
Group, Villepinte, France) was administered at 3ml/s after 10s scan time. A
patient specific arterial input function (AIF) was measured in the iliac
artery, and pixel maps of the volume transfer constant Ktrans were generated