Short communication
Thermal imaging of solid oxide cells operating under electrolysis
conditions
D.J. Cumming
*, R.H. Elder
Department of Chemical and Biological Engineering, University of Sheffield, Mappin Street, Sheffield, S1 3JD, UK
h i g h l i g h t s
Highly sensitive technique for remote temperature measurement of an SOC.
Very little temperature variation across the diameter of the cell during operation.
Observed switch from endo (electrolysis) to exo (joule heating) thermic regimes.
Changes in electroethermal activity is directly observed during operation.
a r t i c l e i n f o
Article history:
Received 11 November 2014 Received in revised form 13 January 2015 Accepted 18 January 2015 Available online 19 January 2015
Keywords: SOEC Electrolysis Thermal Imaging Thermoneutral
a b s t r a c t
Solid oxide fuel cells remain at the forefront of research into electrochemical energy conversion tech-nology. More recent interest has focused on operating in electrolyser mode to convert steam or carbon dioxide into hydrogen or carbon monoxide, respectively. The mechanism of these reactions is not fully understood, particularly when operated in co-electrolysis mode using both steam and CO2. This contribution reports the use of a thermal camera to directly observe changes in the cell temperature during operation, providing a remote, non-contact and highly sensitive method for monitoring an operational cell.
©2015 The Authors. Published by Elsevier B.V. This is an open access article under the CC BY license (http://creativecommons.org/licenses/by/4.0/).
1. Introduction
Fossil fuels continue to increase in price as worldwide demand increases, existing reserves are depleted, and new reserves become more difficult to exploit. Increased non-renewable fossil fuel extraction and combustion also contributes to climate change due to the elevated carbon dioxide levels in the atmosphere. Capture and recycling of carbon dioxide for conversion into synthesis gas (a mixture of carbon monoxide and hydrogen) followed by additional processing to liquid hydrocarbon fuels achieves two goals. Firstly, carbon dioxide is re-used or removed from the atmosphere and secondly, liquid hydrocarbons have a very high energy density compared with other storage mediums, such as batteries, super-capacitors or compressed hydrogen. High-temperature electro-chemical reduction of CO2and H20 in a Solid Oxide Cell (SOC) is an
attractive option for carbon dioxide utilisation and syngas pro-duction due to high efficiency and fuelflexibility.
SOCs are electrochemical devices that can be operated revers-ibly between fuel cell mode and electrolysis mode. In fuel cell mode, reactants, such as hydrogen, are oxidised to generate electric power. In electrolysis mode, the cell is supplied with energy to reduce reactants such as steam or CO2to H2and CO. Electrolysis
products can then be used as precursors to liquid fuels, raw feed-stock for thefine chemical industry[1]and may also be a route to efficient large-scale energy storage particularly suited to remote or intermittent renewable sources[2].
High-temperature steam electrolysis for hydrogen production has been investigated for a number of years[3]. More recently, co-electrolysis of steam and carbon dioxide for the production of syngas has been shown to be technologically promising and potentially economically viable [4e11]. Direct carbon dioxide electrolysis for the utilisation of CO2to form carbon monoxide is
also possible[12]. High temperature electrolysis allows for reduced
*Corresponding author.
E-mail address:d.cumming@sheffield.ac.uk(D.J. Cumming).
Contents lists available atScienceDirect
Journal of Power Sources
j o u r n a l h o m e p a g e : w w w . e l s e v i e r . c o m/ l o ca t e / j p o w s o u r
http://dx.doi.org/10.1016/j.jpowsour.2015.01.109
electrical demand compared with low temperature electrolysis as with increasing temperature the free energy of the dissociation reaction decreases and an additional part of the overall energy required is provided by the elevated temperature; these factors allow high operational efficiencies in a SOEC.
Understanding the processes in an operating SOC is critical to further development of more efficient and more durable devices. Significant development of the SOFC has taken place over the last four decades. Materials and operational strategies have been opti-mised and degradation rates and manufacturing routes have been improved to a point where the SOFC is on the brink of commercial exploitation. Operation in electrolysis mode is more complex. There are two key thermal processes: self-heating due to the resistance of current flow through the cell, and the endothermic electrolysis reaction(s). A balance exists between the two, depending on the current passing through the cell. The change from predominantly endothermic conditions at low current density to increased resis-tive heating at higher current density has been verified experi-mentally with direct thermocouple measurements[13].
Several thermal imaging studies have examined the spatial temperature variation of SOCs operating in fuel cell mode[14,15]. Other studies have used imaging to examine the effect of hydro-carbon fuels on electrode processes in SOFCs[16e20]. To the best of our knowledge there are no reports of thermal imaging of solid oxide cells during electrolysis. In this paper we demonstratein-situ
thermal imaging to directly detect the cell temperature changes during operation under varying electrolysis conditions. As a proof on concept, it shows that temperature changes can be obtained remotely during electrochemical measurements.
2. Experimental
Electrolyte supported SOCs (Nextcell B, Fuel Cell Materials) were used in all experiments. Cells are composed of a 150
m
m proprietary Sc-doped zirconia electrolyte layer with ~50m
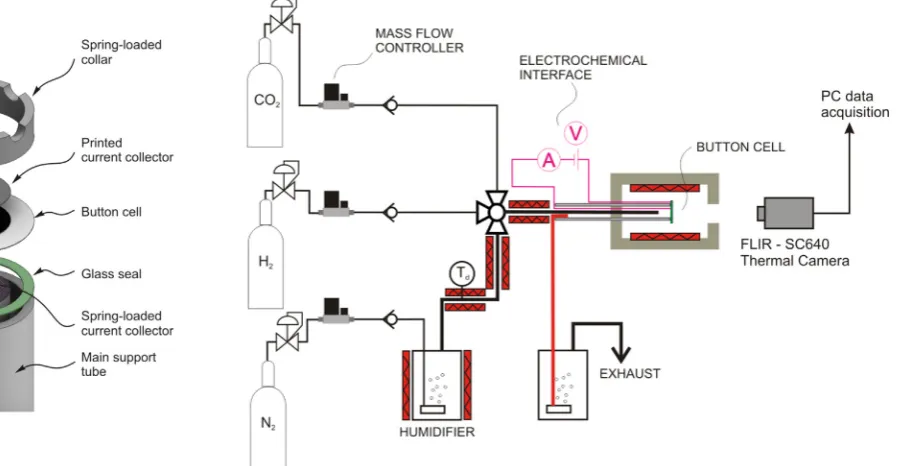
m thick electrodes of Ni-GDC/Ni-YSZ and LSM-YSZ/LSM for the fuel and air-sides respectively.Sample cells are mounted on a commercial button-cell test rig
(Probostat, NorECs), with the air-side electrode facing the thermal camera (seeFig. 1). For an unobstructed view of the entire cell during operation a 70Age30Pd current collection layer (Gwent Electronic Materials) is printed onto the air-side electrode using a semi-automatic screen printer (Model 247, DEK). The layer isfired in-situ during the cell sealing process directly prior to cell testing. Two methods are used to provide current collection on the fuel-side electrode:
A small, spring loaded Pt mesh (NorECs) contacts the fuel-side electrode;
A 70Age30Pd current collection layer is printed on the fuel-side electrode in a similar way to the air-side electrode.
The cell is sealed onto the end of a working alumina tube using a proprietary glass seal (Keraglas STK01, Kerafol) and held in place with a spring loaded collar. An R-type thermocouple is positioned within 1 mm of the edge of the cell in an isothermal position in the furnace. The test-rig assembly is mounted in a horizontal furnace and suitable thermal insulation placed around the furnace open-ings. A baffle system allows for a direct line of sight to the cell whilst maintaining temperature in the furnace. Defined gas compositions are supplied to the cell using massflow controllers. The nitrogen carrier gas stream passes through a temperature controlled water bath to generate the desired steam content for electrolysis. The humidity in the nitrogen stream is monitored using a dew point sensor (HMT330, Vaisala) before mixing with the CO2 and H2
streams. Good mixing of the gasses is ensured through use of a coil and 1 m length of tubing before entering the Probostat system. All of the lines downstream of the water bath are heated to 90C to prevent condensation.
Electrochemical characterisation was performed using a potentiostat (Model 1287, Solartron) and frequency response ana-lyser (Model 1250, Solartron) in combination, operated using Corrware and Zplot software (Scribner and Associates). All cells were tested and imaged at 825C.
[image:2.595.89.541.491.724.2]Thermal imaging was performed using a camera containing a 640480 pixel focal plane array, uncooled microbolometer with a
sensitivity of 60 mK and a spectral range of 7.5e13
m
m (Model SC640, FLIR). A 40 mm lens with a 24field of view and a working distance of ~300 mm was used, resulting in a pixel resolution of ~300m
m. The camera was mounted on a photographic tripod and focused manually. Images were recorded at a rate of 30 Hz and averaged to reduce noise. To observe temperature changes during operation, images and currentevoltage characteristics were recor-ded simultaneously (but not synchronously). The thermal image data was analysed using proprietary software (Thermacam Researcher, FLIR) allowing the changes in cell temperature to be monitored with time and current density. To further reduce noise a circular bounding area was monitored that covered the entire air electrode; the average temperature was then extracted from the pixels within the area.3. Results and discussion
3.1. Initial assessment of cell thermal processes
Thermal processes in an operating SOC are complex, with cell temperatures being influenced by both internal and external mechanisms. Factors external to the cell include the convective heat transfer from the gasesflowing in both the fuel and air com-partments, thermal radiation between the furnace walls and the cell, and contributions from the forward and reverse water gas shift reaction for fuel atmospheres containing CO2and H2. Within the
cell itself, heat is generated by the reversible and irreversible electrochemical processes occurring inside the electrodes and the electrolyte. Reversible heat generation is caused by entropy transfer at the electrode/electrolyte interfaces[21,22]. In fuel cell mode, entropy is decreased at the air-side (cathode) and increased at the fuel-side (anode); in electrolysis mode this is reversed. There are also heat terms associated with electrochemical losses such as electrode activation losses and ohmic losses. Heat is generated due to ohmic losses, predominantly due to the ionic resistance of the electrolyte.
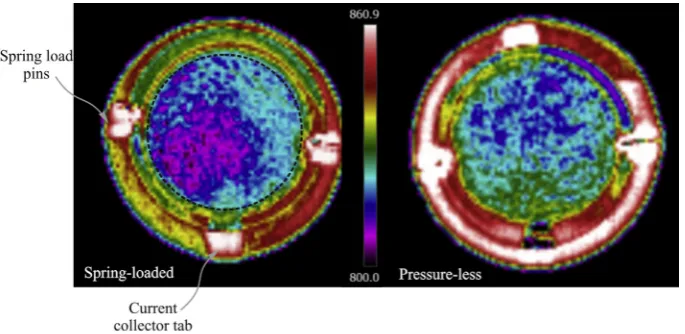
By imaging the cell perpendicular to the cell layers, all of the thermal processes associated with the anode, cathode and elec-trolyte are viewed, making it difficult to deconvolute the contri-butions from individual processes. A typical thermal image of the air side of a cell at 825C with gasflow to the fuel compartment and the cell at open circuit is shown inFig. 2. There is thermal variation across the cell but this is not thought to be due to heat loss due to the convective heat removal in the gasflow as the image
remains the same with the gasflow turned on or off. However, when a pressureless current collector configuration was used on both sides of the cell, the temperature difference across the cell was significantly reduced, seeFig. 2(right). It was not anticipated that the current collector mesh would form such a significant heat sink. Despite this effect, there was no detectable difference in the relative temperature change during cell operation between a‘hot’and‘cold’
region of the cell, as shown inFig. 3. The apparent temperature variation could also be a result of variation in sample surface roughness which could cause a change in the effective emissivity. Without knowing the exact emissivity value of the electrode sur-face at every point, variations would manifest as apparent tem-perature variation. The electrochemical performance of the pressure-less configuration was relatively poor and so the remaining electrochemical and thermographic data were recorded using the spring-loaded configuration. The cell temperature changes were analysed using the average temperature from pixels within the dotted circle marked inFig. 2.
Fig. 4shows the background temperaturefluctuation extracted from a series of images over a 200 s measurement period. During the measurement there was a constant total fuel-sideflow rate of 60 sccm. Temperaturefluctuations of up to±0.3C were routinely
[image:3.595.314.558.319.498.2]Fig. 2.Thermal image of a cell when using a spring loaded mesh current collector (left) and an pressure-less thick-film current collector (right). The active cell area used for analysis is shown by the dashed circle.
[image:3.595.133.476.552.719.2]observed. These variations are thought to be from a number of sources external to the cell such as convection within the furnace or heat from the furnace control processes. Fluctuations such as those described above occurred randomly and the so measurements of background temperature could not be used to correct data recorded during cell operation. However, the magnitude of the background temperature variation is small enough not to impact on the changes observed under operating conditions presented below.
3.2. Fuel cell testing
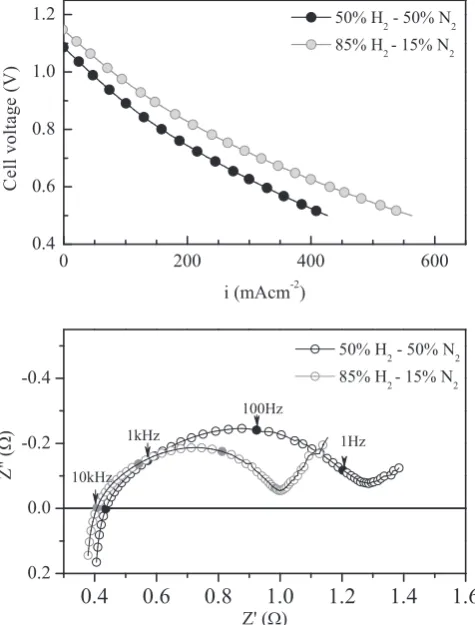
Fig. 5shows theieV characteristics (top) and the open circuit impedance response (bottom) of a typical cell operating in fuel cell mode. The standard cell test configuration used without thermal imaging employs a spring loaded mesh on both sides of the cell. There is a small increase in the ohmic resistance (~0.2
U
cm 2) between the standard, pressured mesh configuration and that with a printed air-side current collector used in these experiments. This is likely due to the less optimal current collection through the printed current collector. Overall, the cell performance is relatively high for an electrolyte-supported design.Fig. 6confirms that changes in cell temperature can be recorded during anieV measurement sweep. The temperature increases by up to 2.5C as the current is increased through the cell. The changes in temperature are well above the fluctuations seen in the back-ground data (Fig. 4). No spatial variation across the cell active area was observed, i.e. the centre and edge of the cell changed tem-perature by the same amount during a test.
The results for a cell operating in fuel cell mode are similar to those previously published in terms of absolute temperature rise. There was no observable radial temperature variation as seen in the study of Brett et al.[14]. Cells tested in this study had a significantly thinner electrolyte (150 compared with 350
m
m) and this is one of the reasons for the lack of observed radial temperature variation.Fig. 6also shows the comparison between fuel cell operation using different hydrogen concentrations. Differences between the two curves are minimal but, as shown inFig. 5, the cell operating on higher hydrogen concentration can sustain a higher current density and this is reflected in the longer time to reach peak temperature. Interestingly, the peak temperature of both test atmospheres is the same. This is believed to be coincidental because the temperature should continue to increase with increased currentflowing though
the cell. Variation in thermal conductivity of the different atmo-spheres may also play a role but additional experiments are still required to determine the significant effect of atmosphere and fuel utilisation.
3.3. Electrolysis testing
[image:4.595.35.281.59.255.2]Fig. 7shows the electrochemical characteristics when the cell was operated in electrolysis mode. The three atmospheres tested
[image:4.595.308.546.67.380.2] [image:4.595.302.550.425.613.2]Fig. 4.Background temperature variation in cell air-side surface temperature during a typical measurement period.
Fig. 5.Electrochemical behaviour of a typical cell operating in fuel cell mode: ieV curve (top) and impedance response (bottom).
were chosen to be sufficiently different to allow temperature var-iations to be distinguished. Steam electrolysis, co-electrolysis of steam and CO2and electrolysis of CO2were tested. Hydrogen was
present in all three atmospheres to ensure a reducing environment. Due to difficulties with condensation at high steam content in the current experimental apparatus, the experiments were restricted to relatively low amounts of steam (~15 mol%) compared with cells typically tested in the literature[11].Fig. 8shows the temperature changes for two separate co-electrolysis experiments. Due to rela-tively small changes in temperature, the thermal background can offset one curve compared with another; hence the slight differ-ence between run 1 and 2 shown inFig. 9. Despite the offset, there is still a clearly visible switch between net endothermic and exothermic operation.Fig. 9shows clear differences between the three electrolysis atmospheres as well as the switch from endo-thermic to exoendo-thermic behaviour. Although the relative tempera-ture change was significantly lower than in fuel cell mode, the effect was clearly observable and reproducible. This are thefirst examples of direct thermal observation of an operational solid electrolysis cell.
Each electrolysis profile is quite distinct: steam electrolysis
shows very little endothermic temperature change followed by a temperature spike at high current density; co-electrolysis shows a very clear switch between the endothermic and exothermic re-gimes; electrolysis of a predominantly CO2atmosphere exhibits a
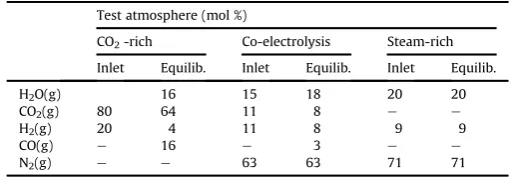
pronounced endothermic region and the temperature of the cell did not rise until much higher current was passed compared with either steam or co-electrolysis.Table 1shows the inlet concentra-tion and the thermodynamic equilibrium concentraconcentra-tions in each scenario. Little quantitative information can be gained from the comparison of these atmosphere because the relative partial pressure of reactants and the utilisation is different in each case. However, they serve as a demonstration of the potential of the techniques and the sensitivity to variation in gas composition.
[image:5.595.312.559.64.262.2]These observations represent the combined thermal processes of the entire cell, however, the qualitative shape of the temperature curves is in agreement with earlier electrolysis work[13]where the temperature depression was directly measured using thermocou-ples in a stack. Cell response during electrolysis is more complex than the fuel cell case due to the endothermic electrolysis reaction. There are numerous numerical modelling studies published for fuel cell operation. Many of the existing numerical models for fuel cell predict temperature changes in the cell and stack during operation. Very few of the models have been validated because of the difficulty of experimentally determining the changes in a cell. Lawlor[23]recently reviewed many of the fuel cell models where thermal imaging could play a role in gathering the necessary experimental data to validate these models. Although the elec-trolysis models are less mature and the thermal processes are potentially more complex, for reasons described above, thermal
[image:5.595.46.290.65.245.2]Fig. 7.Electrochemical behaviour of a cell operating in electrolysis mode under different fuel-side compositions (inlet compositions shown).
[image:5.595.46.291.527.717.2]Fig. 8.Temperature changes due to cell operation observed during two separate ieV sweeps for the co-electrolysis reaction.
Fig. 9. Comparison between the temperature variation in electrolysis mode for steam-rich, carbon dioxide-rich and co-electrolysis atmospheres.
Table 1
Inlet and equilibrium gas compositions for each atmosphere tested.
Test atmosphere (mol %)
CO2-rich Co-electrolysis Steam-rich
Inlet Equilib. Inlet Equilib. Inlet Equilib.
H2O(g) 16 15 18 20 20
CO2(g) 80 64 11 8 e e
H2(g) 20 4 11 8 9 9
CO(g) e 16 e 3 e e
[image:5.595.308.564.654.743.2]imaging can also play a role in generating the data to validate future models.
4. Conclusions
In-situ thermal imaging during electrolysis testing has been shown to allow the thermal processes occurring in a cell to be monitored directly. Keyfindings from this work are:
There was little spatial variation across the diameter of the cell during operation, as would be expected for a defect-free cell, although the current collectors proved to be a large heat sink in these experiments.
The switch between endothermic and exothermic operation can be observed during linear currentevoltage sweeps and corre-lates well with similar effects observed using thermocouples. This allows for a non-contact method for determining the point at which a cell is operating under thermoneutral conditions.
Differences in the fuel atmosphere and electrochemical perfor-mance can be observed directly during operation. Although in this work the experiments do not provide quantitatively com-parable data it does prove the viability of the technique and, to the best of our knowledge, is the only example of direct thermal observation of high temperature electrolysis.
Future work will aim to improve the technique to allow linking of the cell temperature to the potential and current. Direct tem-perature measurement using small thermocouples will allow direct correlation of the imaging results. Direct measurement in combi-nation with IR measurement would also allow the empirical determination of the emissivity of each cell component material.
In addition to the electrochemical monitoring, there is the po-tential to develop the technique to use it as a diagnostic tool for in-situ failure analysis. Cell defects such as layer delamination and inhomogeneity would be visible and growth of defects could be monitored.
Acknowledgements
This work was carried out as part of the“4CU”programme grant, aimed at sustainable conversion of carbon dioxide into fuels, led by
The University of Sheffield and carried out in collaboration with The University of Manchester, Queens University Belfast and University College London. The authors acknowledge gratefully the Engi-neering and Physical Sciences Research Council (EPSRC) for sup-porting this workfinancially (Grant No EP/K001329/1). The authors also gratefully acknowledge the EPSRC Engineering Instrument Pool for the loan of the thermal camera.
References
[1] K.M.K. Yu, I. Curcic, J. Gabriel, S.C.E. Tsang, Chemsuschem 1 (2008) 893e899. [2] C. Graves, S.D. Ebbesen, M. Mogensen, K.S. Lackner, Renew. Sustain. Energy
Rev. 15 (2011) 1e23.
[3] W. Doenitz, R. Schmidberger, E. Steinheil, R. Streicher, Int. J. Hydrog. Energy 5 (1980) 55e63.
[4] J.E. O'Brien, M. McKellar, C.M. Stoots, J.S. Herring, G.L. Hawkes, in: AIChE Annual Meeting 2007, Salt Lake City, USA, 2007.
[5] S.D. Ebbesen, C. Graves, M. Mogensen, Int. J. Green. Energy 6 (2009) 646e660. [6] C.M. Stoots, J.E. O'Brien, J.S. Herring, J.J. Hartvigsen, J. Fuel Cell. Sci. Technol. 6
(2009).
[7] Z. Zhan, W. Kobsiriphat, J.R. Wilson, M. Pillai, I. Kim, S.A. Barnett, Energy Fuels 23 (2009) 3089e3096.
[8] S.D. Ebbesen, M. Mogensen, Electrochem. Solid State Lett. 13 (2010) D106eD108.
[9] C.M. Stoots, J.E. O'Brien, K.G. Condie, J.J. Hartvigsen, Int. J. Hydrog. Energy 35 (2010) 4861e4870.
[10] S.D. Ebbesen, J. Hogh, K.A. Nielsen, J.U. Nielsen, M. Mogensen, Int. J. Hydrog. Energy 36 (2011) 7363e7373.
[11] C. Graves, S.D. Ebbesen, M. Mogensen, Solid State Ionics 192 (2011) 398e403. [12] S.D. Ebbesen, M. Mogensen, J. Power Sources 193 (2009) 349e358. [13] C. Stoots, J. O'Brien, J. Hartvigsen, Int. J. Hydrog. Energy 34 (2009) 4208e4215. [14] D.J.L. Brett, P. Aguiar, R. Clague, A.J. Marquis, S. Schoettl, R. Simpson,
N.P. Brandon, J. Power Sources 166 (2007) 112e119.
[15] G. Ju, K. Reifsnider, X.Y. Huang, J. Fuel Cell. Sci. Technol. 5 (2008).
[16] M.B. Pomfret, D.A. Steinhurst, J.C. Owrutsky, J. Power Sources 233 (2013) 331e340.
[17] M.B. Pomfret, D.A. Steinhurst, J.C. Owrutsky, Solid Oxide Fuel Cells 12 (Sofc Xii) 35 (2011) 1563e1570.
[18] M.B. Pomfret, D.A. Steinhurst, J.C. Owrutsky, Energy Fuels 25 (2011) 2633e2642.
[19] B.C. Eigenbrodt, M.B. Pomfret, D.A. Steinhurst, J.C. Owrutsky, R.A. Walker, J. Phys. Chem. C 115 (2011) 2895e2903.
[20] M.B. Pomfret, D.A. Steinhurst, D.A. Kidwell, J.C. Owrutsky, J. Power Sources 195 (2010) 257e262.
[21] K.J. Daun, S.B. Beale, F. Liu, G.J. Smallwood, J. Power Sources 157 (2006) 302e310.
[22] S.A. Hajimolana, M.A. Hussain, W.M.A.W. Daud, M. Soroush, A. Shamiri, Renew. Sustain. Energy Rev. 15 (2011) 1893e1917.