This is a repository copy of Patriotic values for public goods: transnational trade-offs for biodiversity and ecosystem services?.
White Rose Research Online URL for this paper: http://eprints.whiterose.ac.uk/84068/
Version: Accepted Version
Article:
Dallimer, M, Jacobsen, JB, Lundhede, TH et al. (3 more authors) (2015) Patriotic values for public goods: transnational trade-offs for biodiversity and ecosystem services? Bioscience, 65 (1). 33 - 42. ISSN 0006-3568
https://doi.org/10.1093/biosci/biu187
eprints@whiterose.ac.uk https://eprints.whiterose.ac.uk/ Reuse
Unless indicated otherwise, fulltext items are protected by copyright with all rights reserved. The copyright exception in section 29 of the Copyright, Designs and Patents Act 1988 allows the making of a single copy solely for the purpose of non-commercial research or private study within the limits of fair dealing. The publisher or other rights-holder may allow further reproduction and re-use of this version - refer to the White Rose Research Online record for this item. Where records identify the publisher as the copyright holder, users can verify any specific terms of use on the publisher’s website.
Takedown
If you consider content in White Rose Research Online to be in breach of UK law, please notify us by
1 This is a pre-copyedited, author-produced PDF of an article accepted for publication in
1
BioScience following peer review. 2
3
The version of record (Dallimer M, Jacobsen JB, Lundhede TH, Takkis K, Giergiczny M, 4
Thorsen BJ. (2015) Patriotic values for public goods: transnational trade-offs for biodiversity 5
and ecosystem services BioScience, 65, 33-42) is available online at: 6 http://bioscience.oxfordjournals.org/content/65/1/33.full?keytype=ref&ijkey=s0C5qhUpYDs 7 mwLy 8 9
Patriotic values for public goods: are there transnational trade-offs for
10
biodiversity and ecosystem services?
11 12
Martin Dallimer1,2, Jette Bredahl Jacobsen2, Thomas Hedemark Lundhede2, Krista Takkis3, 13
Marek Giergiczny4, Bo Jellesmark Thorsen2 14
15
1Sustainability Research Institute, School of Earth and Environment, University of Leeds,
16
Leeds, LS6 9JT, UK 17
2Department of Food and Resource Economics and Center for Macroecology, Evolution and
18
Climate, University of Copenhagen, Rolighedsvej 23, 1958 Copenhagen, Denmark 19
3Macroecology Workgroup, Institute of Ecology and Earth Sciences, University of Tartu, Lai
20
40, 51005, Tartu, Estonia 21
4Department of Economic Sciences, University of Warsaw, Dluga 44/50, 00-241 Warsaw,
22 Poland 23 24 Correspondence 25 26 Martin Dallimer, 27
Sustainability Research Institute, School of Earth and Environment, University of Leeds, 28
Leeds, LS2 9JT, UK 29 Tel: +447894085071 30 Email: m.dallimer@leeds.ac.uk 31 32
Running head: Patriotic values for ecosystem services 33
34
Keywords: biodiversity conservation, choice experiment, ecosystem services, non-market 35
valuation, semi-natural grassland, stated preference 36
2
Abstract
41
42
The natural environment is central to human well-being through its role in ecosystem service 43
(ES) provision. Managing ES often requires coordination across international borders. 44
Although this may deliver greater conservation gains than countries acting alone, we do not 45
know if the public supports such an international approach. Using the same questionnaire in 46
three countries, we quantified public preferences for ES in their home country and across 47
international borders. In all three countries, people were willing-to-pay for ES in general. 48
However, our results show there is a limit to the extent that environmental goods can be 49
considered “global”. ES with a use element (habitat conservation, landscape preservation) 50
attracted a “patriotic premium”, where people were willing-to-pay significantly more for 51
locally-delivered services. Supra-national management of ES needs to be balanced against the 52
preferences people have for services delivered in their home country. 53
54
3
Introduction
56
57
The natural environment is central to human well-being through its role in ecosystem service 58
provision (Sachs et al. 2009). There is therefore considerable interest in how best to manage 59
the natural world to enhance the delivery of a wide range of services (e.g., Kumar 2010, 60
UKNEA 2011). However, the effective preservation and enhancement of biodiversity and 61
ecosystem services can require intervention across varied socio-economic and political 62
borders, not least because ecosystems, the biodiversity they contain and the services they 63
deliver are often shared amongst such contexts. For example, long distance migratory species 64
can be responsible for functional links across distant regions (Bauer and Hoye 2014), and 65
thus require novel approaches to their management (e.g., Semmens et al. 2011), which can 66
include transnational organizations. In sub-Saharan Africa, for example, highly mobile 67
migrant pests move frequently across national borders (Dallimer et al. 2003, Cheke and 68
Tratalos 2007). Multinational agencies (e.g, the “Desert Locust Control Organisation – East 69
Africa”) coordinate management at a regional level to minimize the ecosystem disservices, in 70
the form of crop yield loss, caused by such pests. Elsewhere, supra-national bodies, such as 71
the European Union, determine policies and legislation for species and habitat management 72
that operate across many different nations (European Commission 1979, 1992, 2000). 73
Finally, many water catchments are transnational (Lopez-Hoffman et al. 2010) and are 74
managed as such. 75
76
Despite the widespread existence of trans- and supra-national bodies in ecosystem and 77
biodiversity management, we know little about the extent of public support for initiatives 78
which operate at international scales. This is important because with limited resources 79
4
understanding people’s preferences for different aspects of the natural world as one means to 81
prioritize actions for a number of reasons: (i) people have opinions about where to invest in 82
conservation (Jacobsen and Thorsen 2010); (ii) conservation is frequently funded by 83
governments who may wish to respond to the values expressed by the public; and (iii) 84
interventions are more likely to succeed if they align with public preferences. This raises 85
questions as to the extent to which biodiversity, environmental goods and services should be 86
delivered locally, as well as globally. Some services, such as recreation, landscape 87
appreciation or wild species diversity, may have a greater value to nearby populations who 88
are able to experience them and therefore benefit from their use, as well as non-use, values 89
(Atkinson et al. 2012). Others, such as carbon sequestered and storage through vegetation 90
restoration, although often quantified at a local scale, deliver their benefits globally (Bulte et 91
al. 2002). 92
93
Here we quantify the values that the public place on biodiversity and ecosystem services 94
delivered across international boundaries, as opposed to within their country of residence. We 95
base our study in the European Union (EU), where many policies pertaining to biodiversity 96
conservation and ecosystem service management (e.g. Birds, Habitats Directives, Common 97
Agricultural Policy and its agri-environment elements, commitments to reduce carbon 98
emissions) are formulated at a supra-national level. Although the available evidence suggests 99
that this approach can be relatively effective at the continental-scale at protecting, for 100
example, avian populations (Donald et al. 2007), there is little understanding of the extent to 101
which the general public in Europe support allocating funds for ecosystem service 102
management internationally as opposed to a more local approach. 103
104
5
Methods
106
A commonly used approach to assess public preferences for the natural world is to assign 107
monetary values to changes in ecosystems and the services they supply. Although sometimes 108
controversial amongst conservation biologists, monetary valuation facilitates making direct 109
comparison with other costs and benefits in decision-making processes and its use has 110
become widespread (Hanley and Barbier 2009, Kumar 2010). Here we use the stated 111
preference non-market valuation technique of the choice experiment (CE) to ask two 112
questions: do people value ecosystem services and biodiversity across international 113
boundaries and, if so, how do those values vary according to the scale at which the goods 114
themselves deliver benefits? To do this we choose a suite of services that vary in their scale 115
of delivery from global (enhanced carbon capture for climate change mitigation) through both 116
global and local (biodiversity conservation) to mainly local (the preservation of landscapes 117
that are culturally and aesthetically appreciated) (see Survey Design below). We hypothesize: 118
(i) there will be a preference for ecosystem services to be delivered locally, as opposed to 119
across international borders; and (ii) this preference will be weaker for more global public 120
goods. 121
122
Choice experiments draw on theories of economic value (Lancaster 1966) and the application 123
of random utility theory to choice (McFadden 1974). The methodology is based on 124
probabilistic choice where individuals are assumed to select a single alternative which 125
maximizes their utility from a set of available alternatives (Supplementary Material Appendix 126
S1). CEs involve presenting participants with a number of choice sets consisting of two or 127
more alternatives, each described by various levels of a set of attributes and a monetary cost 128
which would finance the changes in the attribute levels described in an alternative. This 129
6 for the different alternatives. The WTP for a marginal improvement in an attribute can then 131
be calculated as the ratio between the parameter of that attribute and the parameter of the 132
price attribute (See Supplementary Material for analytical details). Choice experiments are 133
commonly used to value changes in ecosystem services and biodiversity (Christie et al. 2006, 134
Jacobsen and Thorsen 2010, Morse-Jones et al. 2012, Dallimer et al. 2014) and offer a wide 135
range of information on trade-offs among the benefits provided by the different alternatives 136
(Adamowicz et al. 1998, Adamowicz et al. 1997). 137
138
Survey Design
139
The focus of the CE was to value changes in ecosystem services across international borders. 140
We used semi-natural grasslands in northern Europe, a study system for which such an 141
analysis is particularly pertinent not least because environmental policy delivered across 142
member states of the European Union has a long-standing international component (e.g., the 143
Birds and Habitats Directives, and the Natura 2000 network of protected areas; (European 144
Commission 1979, 1992, 2000). Semi-natural grasslands have historically been subject to 145
huge losses in extent and quality (Veen et al. 2009), and they are important for cultural and 146
aesthetic reasons (e.g, Sand-Jensen 2007), as well as being a key habitat for biodiversity 147
conservation in Europe. This was acknowledged by Mariann Fischer Boel, the EU 148
Commissioner for Agriculture and Rural Development in 2009, “…grasslands […] represent
149
a key element in Europe’s rich diversity of landscapes and the public appreciate the beauty of 150
Europe’s meadows” (Veen et al. 2009). Indeed, many grassland systems are included in the 151
continent’s register of “High Nature Value Farmland” that recognizes the central place that
152
traditional farming techniques play in maintaining culturally important and biodiverse 153
7 ecosystem services (European Commission 2008), grasslands are rarely the subject of non-155
market valuation exercises. 156
157
We selected attributes for the CE based on services which are delivered by semi-natural 158
grasslands, have an international dimension to their management and are likely to span 159
different scales of beneficiaries. Three such services are: the preservation of landscapes that 160
are culturally and aesthetically appreciated, biodiversity conservation and enhanced carbon 161
capture for climate change mitigation. 162
163
The EU promotes the preservation of landscapes through the European Landscape 164
Convention (Council of Europe 2000). Regions with a high coverage of semi-natural 165
grasslands often retain features associated with culturally important and aesthetically 166
attractive landscapes, such as traditional buildings, boundaries and field sizes (Sand-Jensen 167
2007; Veen et al. 2009; Knowles 2011). Traditional landscapes tend to have strong cultural 168
links to the region in which they are found (Jacobsen and Thorsen 2010) and their enjoyment 169
is thus largely a use value. We would expect beneficiaries to be mainly restricted to the 170
country in which a particular region is located. 171
172
The conservation of biodiversity and habitats within the EU is governed via instruments such 173
as the Habitats Directive (European Commission 1992) which all member states are expected 174
to implement. Biodiversity is considered central to supporting all ecosystem services 175
(Balvanera et al. 2006). However, there is ongoing debate as to whether biodiversity per se 176
can be considered a service in and of itself (Mace et al. 2012), though the protection of 177
biodiversity clearly has value to people (e.g., Christie et al. 2006, Morse-Jones et al. 2012, 178
8 diversity both as an intermediate service and as a final provisioning and cultural service 180
(UKNEA 2011). We include it as a final service because of its associated use and non-use 181
values for EU citizens (e.g., Bateman et al. 2013, UKNEA 2011). The benefits of the service 182
could therefore be experienced both locally, and potentially globally. 183
184
The EU has committed its member states to reducing carbon emissions by 20% below 1990 185
levels by 2020 (EEA 2010). Enhancing storage and uptake within vegetation and soils is one 186
potential pathway through which part of these targets could be met. Semi-natural grasslands 187
can be managed by manipulating fertilizer application, grazing levels and promoting the 188
presence of certain forbs to increase carbon uptake and storage in some situations (De Deyn 189
et al. 2011). The benefits delivered by this service (in terms of climate amelioration) would 190
be experienced globally. 191
192
We elected to use an increase in areas managed for biodiversity as an attribute rather than an 193
increase in species richness or the abundance of key species. This was to ensure our estimates 194
of WTP would not be affected by preferences for certain taxa (e.g., Jacobsen et al. 2008). The 195
landscape preservation attribute was also hectare-based, making it directly comparable to the 196
biodiversity conservation attribute. However, the units for the carbon capture attribute were 197
tC ha-1 yr-1. Although these units are perhaps more abstract than a third hectare based 198
attribute, the direct benefit to people from the carbon attribute is the tC captured rather than 199
the number of hectares over which the C is distributed. We therefore use the component that 200
carries the utility directly, even though this may restrict direct comparisons of value between 201
the different services. 202
9 Our study system was centered on northern Europe. Within this region we selected regions 204
which were comparable in terms of topography, area, habitat type and the number and extent 205
of designations under the EU Habitats Directive (Supplementary Material Appendix S1). We 206
also wished to cover a range of international cultural differences found in this region and 207
therefore included a western European nation (Denmark), a former communist country 208
(Poland) and a former constituent part of the Soviet Union (Estonia) (Fig. 1). By choosing 209
sites that were similar, we attempted to ensure the CE quantified trans-national effects on the 210
values people ascribe to the sites, rather than, for example, habitat preferences, marginal 211
effects related to how large our example regions were, pre-formed preferences for certain 212
locations or species (Bateman 2009, Jacobsen and Thorsen 2010, Jacobsen et al. 2008). 213
214
To estimate measures of economic benefit from changes in the environmental attributes listed 215
above, a cost attribute was included in the design specified as an increase to the 216
householder’s annual taxation bill needed to finance the management measures. Choices 217
would then show how much people are willing to trade-off improvements in an 218
environmental attribute for a decrease in their income. The levels of the cost attribute were 219
determined based on previous studies (Bartczak et al. 2008, Jacobsen and Thorsen 2010), and 220
were adjusted following focus groups and pilot tests. Each nationality was presented with 221
costs in their local currency, with amounts purchasing power parity calibrated to be 222
equivalent. 223
224
An optimal design for the CE was generated and we included Bayesian priors from a pilot 225
exercise to improve design efficiency (Ferrini and Scarpa 2007, Scarpa and Rose 2009). This 226
resulted in a CE consisting of 12 choice cards, divided into two blocks. Each respondent 227
10
example see Supplementary Material Appendix S2). These were three “policy-on” options 229
which included different combinations of the attributes (carbon capture, habitat conservation, 230
landscape preservation, region, and the annual tax cost) and a no cost status quo alternative in 231
which no changes would take place across all regions. The “policy-on” options included the 232
baseline of no change and two levels of change in carbon capture, habitat conservation and 233
landscape preservation, and six levels of cost (Table 1). 234
235
The questionnaire was initially developed in English and translated by native speakers into 236
the relevant local languages. We used focus groups and a pilot exercise to help finalize the 237
questionnaire in two different ways. Firstly, feedback from participants ensured that 238
translations were understandable to the general population and used appropriate wordings 239
that were relevant to national situations. Final versions of the questionnaire were therefore 240
produced only in Danish, Polish, Estonian and Russian (to account for the Russian speaking 241
population in Estonia) and are available from the authors. Secondly, the focus groups and 242
pilot exercises allowed us to test the structure and meaning of the CE and its associated 243
attitudinal and socio-demographic questions. 244
245
Commercial polling companies were used to deliver the survey to an online panel of 246
respondents in winter 2012. Around 3200 individuals were invited to take part in the survey 247
in each country. Data collection was finalized when at least 850 respondents (representative 248
of national population according to age, gender, education, employment) had completed the 249
questionnaire. Initially we were supplied with over 1200 responses from Poland, but we 250
wished to have an equivalent number of respondents in each country, a random sample was 251
selected from these to bring the sample size in line with those in Denmark and Estonia. Of the 252
11 (insufficient time to read through the survey) and 25 (1.0%) for which answers to the full set 254
of choice cards were not recorded. The status quo option was chosen for all choice cards by 255
138 (5.4%) respondents who also gave a motivation for this pattern of answers which was 256
consistent with protesting against the questionnaire itself or the payment vehicle used 257
(Supplementary Material Appendix S3). Although the proportion of protesters was small, 258
standard practice assumes they did not reveal their true preferences and should be excluded 259
from further analyses (Jacobsen and Thorsen 2010, Meyerhoff and Liebe 2008). Remaining 260
data from all countries were merged and analyzed together, resulting in a final sample size of 261
2367 (approx. 800 respondents/country answering 14202 choice cards). Analyses were 262
conducted in NLOGIT using a mixed logit specification with an error component model 263
(Greene and Hensher 2007, Scarpa Riccardo et al. 2005). Parameter estimates from the 264
simpler conditional logit model were of the same sign and magnitude as the mixed logit, so 265
we report only the results from the more complex model. We included a correction for scale 266
difference (Hensher et al. 1999) between nationalities. Details of the analytical approach and 267
theoretical background are given in Supplementary Material Appendix S1. 268
269
270
Results
271
272
Respondents of all nationalities expressed a positive and significant WTP for enhanced 273
ecosystem services (Table 2). Irrespective of where services were to be delivered, people 274
stated a WTP (±S.E.) for habitat conservation of €0.038±0.004 and for landscape 275
preservation of €0.028±0.004 per household per year for the management of one additional
276
ha. WTP for carbon capture was €0.019±0.002 per household per year for an extra tC ha-1.
277
12 There were significant preferences for where management actions should take place. 279
Respondents from the complete sample expressed the highest utility for actions in Denmark 280
(as contained within the ASC) of €0.078±0.010. The variable ASC is the ‘Alternative 281
Specific Constant’, which measures the WTP for taking any form of action. Given that 282
country variables are 0/1 dummies, in order for us to carry out the estimation and not over-283
specify our models we did not include one country, in this case Denmark. WTP amounts for 284
Denmark are thus confounded with the ASC. WTP measures for Poland and Estonia are 285
relative to the ASC. Thus, across all respondents, the WTP for management actions in Poland 286
was €0.007±0.004 lower than Denmark, and ecosystem services delivered in Estonia were on 287
average significantly less valued across respondents from the three countries, being 288
€0.022±0.006 lower than in Denmark. The overall utility for actions in Estonia was still 289
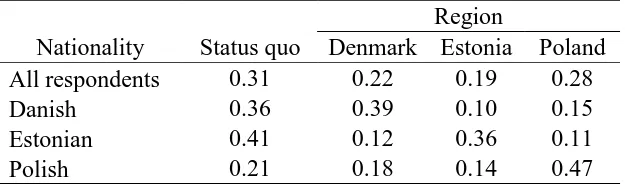
positive and significantly different from zero. This pattern reflects that all respondents were 290
more likely to choose alternatives based in their own country, and that Polish and Danish 291
respondents chose alternatives in Denmark and Poland respectively more often than they 292
chose provision in Estonia. Similarly, Estonians were largely indifferent in their choices 293
between Denmark and Poland (Table 3). 294
295
Although prices were purchasing power parity corrected, we would still expect there to be 296
significant differences between nationalities with respect to marginal utility of income. We 297
accounted for this by including two “nationality x price” interaction variables in the models. 298
As previously noted, because the country variables are 0/1 dummies, we can only include two 299
of them in the model. Thus the parameter estimate for “Price” refers to Danish respondents,
300
and the interaction terms for Poland and Estonia quantify the additional contribution to that 301
price parameter (e.g., for Poland -1.361 – 0.309). The marginal utility of income was 302
13 4; “Estonian x Price” and “Polish x Price” interactions). As WTP is calculated by dividing the 304
parameter estimate for the environmental attributes by that of price, the precise WTP 305
estimates vary by a fixed ratio between nationalities. For simplicity in the text, we report 306
WTP based on Danish price sensitivity (Table 4; “WTP in € for Danish respondents”).
307
308
We wished to separate out the effects of nationality and region to examine the more general 309
issue of how much extra people were willing to pay to have a service delivered in their own 310
country, rather than the exact same service provided elsewhere. We did this by including a 311
variable “own country” (which took the value one when management actions took place in
312
the respondent’s country of residence, and zero otherwise), which was interacted with the 313
environmental attributes. In addition we included interactions between this variable and the 314
region of provision, which were intended to capture latent and unobserved effects of the 315
respondent’s nationality on their preferences. The general pattern remained (Table 4; Fig. 2), 316
with WTP for habitat conservation, landscape preservation and carbon capture €0.034±0.007,
317
€0.018±0.006 and €0.011±0.003 respectively.
318
319
The own country region preferences were all significantly different from zero and positive 320
(Table 4), indicating that respondents were willing to pay more for any actions to take place 321
in the country they resided in (Fig. 2). This was especially marked for Estonians, who were 322
willing to pay an additional €0.114±0.015 for actions in Estonia. In contrast, Danes expressed 323
the lowest additional valuation for actions to take place in their own country of 324
€0.033±0.013.
325
326
Across all three countries, WTP for habitat conservation and landscape preservation within 327
respondents’ own country more than doubled the WTP estimate for the same actions
14
undertaken elsewhere. For example, the WTP for habitat conservation was €0.034±0.007,
329
while the additional WTP for habitat conservation in a respondents’ home country (as 330
captured by the own country x habitat conservation interaction) was €0.047±0.011, giving a 331
total WTP for habitat conservation of €0.081. The own country “patriotic premium” was
332
relatively largest for landscape preservation. The premium for carbon capture delivery in a 333
respondent’s own country was smallest, though still of significant size (Table 4; Fig. 2).
334
335
Thus far our results support our two main hypotheses, namely (i) there should be a preference 336
for ecosystem services to be delivered locally, as opposed to across international borders; and 337
(ii) this preference should be weaker for more global public goods. However, there are other 338
potential explanations for the patterns so far described. For instance, the preference for 339
services delivered in a respondents’ country of residence could be driven by regular outdoor 340
recreationalists being willing to pay higher amounts for locally delivered services for which 341
they gain use value. We accounted for this by including a variable for frequent (more than 342
one visit per month) recreational visitors to the countryside. Finally, although we used 343
purchasing power parity to match tax amounts presented to respondents from different 344
countries, we would expect respondents on relatively high incomes to exhibit a different 345
sensitivity to price compared to those on low incomes. We controlled for this by including an 346
interaction between price and high income respondents (those whose household incomes 347
were in the upper income brackets for their country of residence; Supplementary Material 348
Appendix S4). 349
350
Respondents reporting household incomes in the higher brackets for their country and regular 351
recreational users were less sensitive to price (Table 5; “high income x price” interaction
352
15 generally higher WTP (the “user x price” term), they were not willing to pay a greater 354
amount for any specific environmental attributes (parameter estimates for “user x habitat
355
conservation”, “user x landscape preservation”, “user x carbon capture” interactions all not
356
significantly different from zero). There was no impact on the magnitude or relative ranking 357
of the preferences for services to be delivered in the respondents own country (Table 5). 358
359
360
Discussion
361
362
Across three European countries, we found a significant WTP for enhancements to ecosystem 363
services provided by semi-natural grasslands, regardless of the location of delivery (Table 1). 364
Nevertheless, people were WTP significantly greater amounts for services located in their 365
country of residence (Tables 3, 4). The magnitude of this extra payment was linked to the 366
extent to which the good could be considered local or global. The additional WTP for 367
services with characteristics of a local public good (in our study, habitat conservation and 368
landscape preservation) to be delivered within the respondents’ country of residence was 369
much higher than that for the global public good of carbon capture. 370
371
Given that local goods are assumed to have a high use value, perhaps surprisingly we did not 372
find that regular recreational users of the countryside were willing-to-pay more for locally 373
delivered services (although they did have a higher WTP across all services and locations in 374
general). Non-use values can be experienced by people without engaging in specific activities 375
and behaviors. We may, for example, all derive utility from knowing that endangered species 376
are protected even though we may never see them (e.g., Morse-Jones 2012). Such values 377
16 they are non-rival and no-one can be excluded from receiving benefits. In contrast, use values 379
are accrued through active use, including activities such as wildlife watching and enjoying 380
aesthetically pleasing landscapes. As use values imply a cost for the user, in terms of money, 381
transport and time, people are likely to care about where and how they can be enjoyed. Thus, 382
the values of environmental public goods with large use components are likely to be less 383
global in nature. 384
385
By simultaneously considering both respondents from, and ecosystem service delivery 386
within, several countries we demonstrated a strong preference for local delivery, and the 387
value that people can attach to services provided outside their home country. Cultural 388
heritage, shared values and experiences can affect values for public goods (Ready and 389
Navrud 2006; Jacobsen and Thorsen 2010). Here, respondents in Denmark, Poland and 390
Estonia were willing to pay significantly different amounts for management to enhance 391
ecosystem services, suggesting that nationality and international borders were important 392
determinants of value. Nevertheless, political boundaries are not the same as market 393
boundaries when assessing WTP for environmental enhancements (Loomis and White 1996). 394
For example, residents in developed countries are willing to pay for the conservation of 395
species in the developing world (Morse-Jones et al. 2012) and the optimal coverage by 396
rainforest in Costa Rica is markedly higher when global (as well as local) beneficiaries are 397
included in calculations (Bulte et al. 2002). Similarly, nationality is not always a strong 398
determinant of value (Jin et al. 2010). 399
400
Since their popularization (MEA 2005), ecosystem services have gained considerable traction 401
amongst researchers and policy makers keen to incorporate values for the natural world in 402
17 role in both underpinning many services (Atkinson et al. 2012, Mace et al. 2012), there is a 404
danger that biodiversity conservation per se will be overlooked in the face of more obviously 405
beneficial and quantifiable services, such as climate mitigation. However, biodiversity plays 406
an important role in delivering cultural services (Mace et al. 2012), and is highly valued by 407
the general public (Christie et al. 2006, Morse-Jones et al. 2012, Dallimer et al. 2014). Across 408
the three countries in our study, when faced with a choice between management for 409
biodiversity conservation and two other services, respondents consistently placed higher 410
values on biodiversity, indicating that it should retain a prominent role in environmental 411
management and policy. 412
413
We acknowledge competing explanations for the pattern documented here, not least because 414
many other variables may be entirely confounded with region and nationality and could 415
therefore weaken the patterns we have quantified. For example, it is possible that the size of 416
the chosen regions was an important factor in respondents’ WTP for management actions
417
focused on particular locations. We addressed this by ensuring that the study regions were 418
closely matched in terms of their existing areas of semi-natural grassland. However, there 419
remained a substantial difference in the number of species considered to be under threat of 420
extinction between the study sites (47, 54 and 22 for Estonia, Poland and Denmark 421
respectively; Supplementary Material). The fact that Danes expressed the lowest additional 422
WTP for habitat conservation actions to take place in their own country could plausibly be 423
driven by the perception that actions in Denmark would contribute least to biodiversity 424
protection across the three countries. Similarly, although respondents were not presented with 425
the information, the relative rarity of the habitat and landscapes in each country may have 426
played a role. For example, if a habitat is thought to be rare in a certain country, then the 427
18 perceived to be common. In our study this would translate to respondents demonstrating a 429
preference for investment in habitat conservation in Denmark where semi-natural grasslands 430
are relatively scarce compared to either Poland or Estonia. A further plausible hypothesis 431
might be that people factor into their preference the relative costs across our three study 432
countries. In this case, Denmark, where prices and incomes are highest, would be perceived 433
to be the most costly country in which to undertake management actions, and thus 434
respondents may feel their WTP would need to be greater to deliver the same environmental 435
changes. In both cases within our CE, this would result in higher WTP estimates for actions 436
carried out in Denmark, or via a reduced preference for “own” country among Estonian and
437
Polish respondents. Although we do not see the latter, the WTP estimate for any action to 438
take place in Denmark (as captured by the ASC) was higher than those for Poland or Estonia 439
(Table 1). 440
441
Finally, preferences for public goods delivered across international borders may be 442
influenced by the varying levels of trust that exist both within and between people and 443
institutions of different nationalities (e.g., Zak and Knack 2001). For example, Estonians may 444
believe their own country, with its associated laws, compliance and governance structures, is 445
more likely to deliver enhanced ecosystem services than either Denmark or Poland (and vice 446
versa). Alternatively, they may feel more in control of implementation if management is 447
carried out locally (Hanley et al. 2003). 448
449
Conclusions
450
Current prioritization of conservation efforts tends to incorporate biophysical variables 451
together with information regarding the distribution of socio-economic costs of land 452
19 prioritization may well be the most efficient way to deliver maximum conservation gain 454
(Bladt et al. 2009, Kark et al. 2009). However, this takes no account of how benefits from 455
conservation management that accrue to the human population are distributed. 456
457
A supra-national approach to ecosystem management has some support among the general 458
population. However, the values that people express for ecosystem goods and services 459
delivered internationally need to be balanced against the substantially higher WTP for 460
services that are enhanced in their country of residence. Such a finding has important 461
implications for how environmental management and biodiversity conservation are 462
prioritized. The distinct preferences for locally delivered ecosystem services could imply a 463
lower acceptance of international cooperation on environmental issues, coupled with a greater 464
demand for investments in environmental programs in one’s own country. In particular,
465
goods with an obvious use value (e.g. biodiversity, aesthetically pleasing landscapes) cannot 466
be considered as truly global public goods. In our study system, as in many others, this raises 467
issues of trust between countries as the potential for free-riding is high. Ecosystem 468
management could proceed in Poland, financed solely by Polish taxes, but people in nearby 469
countries would also benefit. In many other cases, services are shared across international 470
boundaries (e.g., carbon sequestration, catchment level water quality, and migratory species) 471
and cooperative management would be required to maximize their value to residents of all 472
countries. 473
474
475
Acknowledgements
476
20 We thank all the participants in our surveys. Additional expert opinion on semi-natural
478
grasslands was provided by Zygmunt K cki, Aveliina Helm and Hans Henrik Bruun. Anna 479
Filyushkina provided the Russian translation of the questionnaire. M.D. was supported by an 480
EU-FP7 Marie Curie Fellowship (no. 273547). M.D., J.B.J., T.H.L. and B.J.T. thank the 481
Danish National Research Foundation for support through the Center for Macroecology, 482
Evolution and Climate. 483
484
485
Supplementary Material
486
487
Extended methodological and site details (Appendix S1), an example choice card in English 488
(Appendix S2), responses that were considered protest votes within the choice experiment 489
(Appendix S3) and income bands allocated to the high income variable for use in the analyses 490
of choice experiment data (Appendix S4) are available online. 491
492
493
References
494
Adamowicz W, Boxall P, Williams M, Louviere J. 1998. Stated preference approaches for 495
measuring passive use values: Choice experiments and contingent valuation. American 496
Journal of Agricultural Economics 80: 64-75. 497
498
Adamowicz W, Swait J, Boxall P, Louviere J, Williams M. 1997. Perceptions versus 499
objective measures of environmental quality in combined revealed and stated preference 500
models of environmental valuation. Journal of Environmental Economics and Management 501
32: 65-84. 502
503
Ando A, Camm J, Polasky S, Solow A. 1998. Species distributions, land values, and efficient 504
21 506
Atkinson G, Bateman IJ, Mourato S. 2012. Recent advances in the valuation of ecosystem 507
services and biodiversity. Oxford Review of Economic Policy 28: 22-47. 508
509
Balvanera P, Pfisterer AB, Buchmann N, He JS, Nakashizuka T, Raffaelli D, Schmid B. 510
2006. Quantifying the evidence for biodiversity effects on ecosystem functioning and 511
services. Ecology Letters 9: 1146-1156. 512
513
Bartczak A, Lindhjem H, Navrud S, Zandersen M, Zylicz T. 2008. Valuing forest recreation 514
on the national level in a transition economy: The case of Poland. Forest Policy and 515
Economics 10: 467-472. 516
517
Bateman IJ. 2009. Bringing the real world into economic analyses of land use value: 518
Incorporating spatial complexity. Land Use Policy 26: S30-S42. 519
520
Bateman IJ, et al. 2013. Bringing Ecosystem Services into Economic Decision-Making: Land 521
Use in the United Kingdom. Science 341: 45-50. 522
523
Bauer S, Hoye BJ. 2014. Migratory Animals Couple Biodiversity and Ecosystem Functioning 524
Worldwide. Science 344. 525
526
Bladt J, Strange N, Abildtrup J, Svenning JC, Skov F. 2009. Conservation efficiency of 527
geopolitical coordination in the EU. Journal for Nature Conservation 17: 72-86. 528
529
Bode M, Wilson KA, Brooks TM, Turner WR, Mittermeier RA, McBride MF, Underwood 530
EC, Possingham HP. 2008. Cost-effective global conservation spending is robust to 531
taxonomic group. Proceedings Of The National Academy Of Sciences Of The United States 532
Of America 105: 6498-6501. 533
534
Bulte E, van Soest DP, van Kooten GC, Schipper RA. 2002. Forest conservation in Costa 535
Rica when nonuse benefits are uncertain but rising. American Journal Of Agricultural 536
Economics 84: 150-160. 537
22 Cheke RA, Tratalos JA. 2007. Migration, patchiness, and population processes illustrated by 539
two migrant pests. Bioscience 57: 145-154. 540
541
Christie M, Hanley N, Warren J, Murphy K, Wright R, Hyde T. 2006. Valuing the diversity 542
of biodiversity. Ecological Economics 58: 304-317. 543
544
Council of Europe. 2000. The European Landscape Convention. Luxembourg: Office for 545
Official Publications of the European Communities. 546
547
Dallimer M, Jones PJ, Pemberton JM, Cheke RA. 2003. Lack of genetic and plumage 548
differentiation in the red-billed quelea Quelea quelea across a migratory divide in southern 549
Africa. Molecular Ecology 12: 345-353. 550
551
Dallimer M, Tinch D, Hanley N, Irvine KN, Rouquette JR, Warren PH, Maltby L, Gaston KJ, 552
Armsworth PR. 2014. Quantifying Preferences for the Natural World Using Monetary and 553
Nonmonetary Assessments of Value. Conservation Biology 28: 404-413. 554
555
De Deyn GB, Shiel RS, Ostle NJ, McNamara NP, Oakley S, Young I, Freeman C, Fenner N, 556
Quirk H, Bardgett RD. 2011. Additional carbon sequestration benefits of grassland diversity 557
restoration. Journal of Applied Ecology 48: 600-608. 558
559
Donald PF, Sanderson FJ, Burfield IJ, Bierman SM, Gregory RD, Waliczky Z. 2007. 560
International conservation policy delivers benefits for birds in Europe. Science 317: 810-813. 561
562
EEA. 2010. Tracking progress towards Kyoto and 2020 targets in Europe. Copenhagen: 563
European Environment Agency. 564
565
European Commission. 1979. Council Directive 79/409/EEC of 2 April 1979 on the 566
conservation of wild birds. Luxembourg: Office for Official Publications of the European 567
Communities. 568
569
—. 1992. Council Directive 92/43/EEC on the Conservation of natural habitats and of wild 570
fauna and flora. Luxembourg: Office for Official Publications of the European Communities. 571
23
—. 2000. Managing Natura 2000 sites: The provisions of Article 6 of the ‘Habitats’ Directive
573
92/43/EEC. Luxembourg: Office for Official Publications of the European Communities. 574
575
—. 2008. LIFE and Europe’s grasslands. Restoring a forgotten habitat;. Luxembourg: Office 576
for Official Publications of the European Communities. 577
578
Ferrini S, Scarpa R. 2007. Designs with a priori information for nonmarket valuation with 579
choice experiments: A Monte Carlo study. Journal of Environmental Economics and 580
Management 53: 342-363. 581
582
Greene WH, Hensher DA. 2007. Heteroscedastic control for random coefficients and error 583
components in mixed logit. Transportation Research Part E-Logistics and Transportation 584
Review 43: 610-623. 585
586
Hanley N, Barbier E. 2009. Pricing Nature: Cost-Benefit Analysis and Environmental Policy. 587
Cheltenham: Edward Elgar. 588
589
Hanley N, Schlapfer F, Spurgeon J. 2003. Aggregating the benefits of environmental 590
improvements: distance-decay functions for use and non-use values. Journal of 591
Environmental Management 68: 297-304. 592
593
Hensher D, Louviere J, Swait J. 1999. Combining sources of preference data. Journal of 594
Econometrics 89: 197-221. 595
596
Jacobsen JB, Thorsen BJ. 2010. Preferences for site and environmental functions when 597
selecting forthcoming national parks. Ecological Economics 69: 1532-1544. 598
599
Jacobsen JB, Boiesen JH, Thorsen BJ, Strange N. 2008. What's in a name? The use of 600
quantitative measures versus 'iconised' species when valuing biodiversity. Environmental & 601
Resource Economics 39: 247-263. 602
603
Jin JJ, Indab A, Nabangchang O, Truong DT, Harder D, Subade RF. 2010. Valuing marine 604
turtle conservation: A cross-country study in Asian cities. Ecological Economics 69: 2020-605
24 607
Kark S, Levin N, Grantham HS, Possingham HP. 2009. Between-country collaboration and 608
consideration of costs increase conservation planning efficiency in the Mediterranean Basin. 609
Proceedings Of The National Academy Of Sciences Of The United States Of America 106: 610
15368-15373. 611
612
Knowles B. 2011. Mountain hay meadows: hotspots of biodiversity and traditional culture. 613
London: Society of Biology. 614
615
Kumar P. 2010. The Economics of Ecosystems and Biodiversity: Ecological and Economic 616
Foundations. London and Washington: Earthscan. 617
618
Lancaster KJ. 1966. New approach to consumer theory. Journal of Political Economy 74: 619
132-157. 620
621
Loomis JB, White DS. 1996. Economic benefits of rare and endangered species: Summary 622
and meta-analysis. Ecological Economics 18: 197-206. 623
624
Lopez-Hoffman L, Varady RG, Flessa KW, Balvanera P. 2010. Ecosystem services across 625
borders: a framework for transboundary conservation policy. Frontiers In Ecology And The 626
Environment 8: 84-91. 627
628
Mace GM, Norris K, Fitter AH. 2012. Biodiversity and ecosystem services: a multilayered 629
relationship. Trends in Ecology & Evolution 27: 19-26. 630
631
McFadden D. 1974. Conditional logit analysis of qualitative choice behavior. Pages 105-142 632
in Zarembka P, ed. Frontiers in Econometrics. New York: Academic Press. 633
634
MEA. 2005. Ecosystems and Human Well-being: Biodiversity Synthesis. Washington, DC: 635
World Resources Institute. 636
637
Meyerhoff J, Liebe U. 2008. Do protest responses to a contingent valuation question and a 638
choice experiment differ? Environmental & Resource Economics 39: 433-446. 639
25 Morse-Jones S, Bateman IJ, Kontoleon A, Ferrini S, Burgess ND, Turner RK. 2012. Stated 641
preferences for tropical wildlife conservation amongst distant beneficiaries: Charisma, 642
endemism, scope and substitution effects. Ecological Economics 78: 9-18. 643
644
Ready R, Navrud S. 2006. International benefit transfer: Methods and validity tests. 645
Ecological Economics 60: 429-434. 646
647
Sachs JD, et al. 2009. Biodiversity conservation and the Millennium Development Goals. 648
Science 325: 1502-1503. 649
650
Sand-Jensen K. 2007. Naturen i Danmark: Det åbne land [Danish nature: The open 651
landscape] . Copenhagen, Gyldendal. 652
653
Scarpa R, Rose JM. 2008. Design efficiency for non-market valuation with choice modelling: 654
how to measure it, what to report and why. Australian Journal of Agricultural and Resource 655
Economics 52: 253-282. 656
657
Scarpa R, Ferrini S, Willis K. 2005. Performance of Error Component Models for Status-Quo 658
Effects in Choice Experiments. Pages 247-273 in Scarpa R, Alberini A, eds. Applications of 659
Simulation Methods in Environmental and Resource Economics, vol. 6 Springer Netherlands. 660
661
Semmens DJ, Diffendorfer JE, Lopez-Hoffman L, Shapiro CD. 2011. Accounting for the 662
ecosystem services of migratory species: Quantifying migration support and spatial subsidies. 663
Ecological Economics 70: 2236-2242. 664
665
UKNEA. 2011. The UK National Ecosystem Assessment: Technical Report. Cambridge: 666
UNEP-WCMC. 667
668
Veen P, Jefferson R, de Smidt J, van der Straaten J, eds. 2009. Grasslands in Europe of High 669
Nature Value Zeist: KNNV Publishing. 670
671
Zak PJ, Knack S. 2001. Trust and growth. Economic Journal 111: 295-321. 672
26
Tables
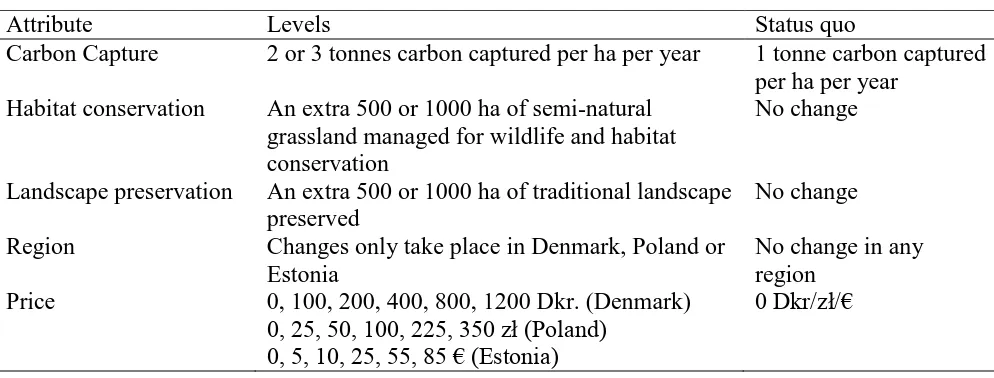
[image:27.595.69.566.136.325.2]674 675
Table 1. Attributes and levels presented in the choice experiment to determine willingness to 676
pay for ecosystem services delivered across international borders in the European Union. 677
678
Attribute Levels Status quo
Carbon Capture 2 or 3 tonnes carbon captured per ha per year 1 tonne carbon captured per ha per year
Habitat conservation An extra 500 or 1000 ha of semi-natural grassland managed for wildlife and habitat conservation
No change
Landscape preservation An extra 500 or 1000 ha of traditional landscape preserved
No change
Region Changes only take place in Denmark, Poland or Estonia
No change in any region
Price 0, 100, 200, 400, 800, 1200 Dkr. (Denmark)
0, 25, 50, 100, 225, 350 zł (Poland) 0, 5, 10, 25, 55, 85 € (Estonia)
0 Dkr/zł/€
27 Table 2. Parameter and willingness to pay estimates for a random parameter error component logit model for the main effects model, based on 14202 680
observations from 2367 respondents ( 2 = 9102.99, Pseudo R2 = 0.231, Log-likelihood = -15137.15). Simulations are based on 1000 Halton draws. The 681
ASC is confounded with the benchmark region of Denmark, and the estimates for Estonia and Poland are additional to it. WTP is reported in € per 682
household per year for management interventions to take place over 1 ha. For carbon WTP is per tC captured on that hectare. ***, ** and * indicate 683
significance at the 0.01, 0.05 and 0.1 levels respectively. 684
685
Variable Parameter (SE) Standard deviation (SE) WTP in € (SE)
ASC 0.869 (0.118)*** 0.078 (0.011)***
Estonia -0.246 (0.062)*** 1.783 (0.063)*** -0.022 (0.006)***
Poland -0.082 (0.047) 1.393 (0.054)*** -0.007 (0.004)*
Habitat conservation 0.427 (0.049)*** 0.855 (0.073)*** 0.038 (0.004)*** Landscape preservation 0.313 (0.045)*** 0.497 (0.089)*** 0.028 (0.004)*** Carbon capture 0.210 (0.022)*** 0.182 (0.053)*** 0.019 (0.002)***
Price -1.507 (0.029)***
28 689
Table 3. Frequency with which alternatives involving the named regions were selected by respondents of each nationality. Status quo indicates that the 690
no change option was selected. 691
692
Region
Nationality Status quo Denmark Estonia Poland All respondents 0.31 0.22 0.19 0.28
Danish 0.36 0.39 0.10 0.15
Estonian 0.41 0.12 0.36 0.11
Polish 0.21 0.18 0.14 0.47
29 Table 4. Parameter and willingness to pay estimates for a random parameter error component logit model for the own country model, based on 14202 696
observations from 2367 respondents ( 2 = 11066.51, Pseudo R2 = 0.281, Log-likelihood = -14154.9). WTP estimates are presented for each nationality,
697
calculated from the appropriate price parameter. ***, ** and * indicate significance at the 0.01, 0.05 and 0.1 levels respectively. The WTP for each 698
attribute and country is calculated using the preference parameter for the attribute divided by the country’s marginal utility of income, e.g. -1.361 for 699
Denmark and -1.670 (-1.361- 0.309) for Poland. WTPs are given in € using the conversion rate of 7.4 Dkr/€. 700
701
Variable Parameter (SE) Standard deviations
(SE)
WTP in € (SE) for
Danish respondents
WTP in € (SE) for
Estonian respondents
WTP in € (SE) for
Polish respondents
ASC1 0.588 (0.128)*** 0.058 (0.012)*** 0.054 (0.011)*** 0.048 (0.010)***
Estonia2 -0.370 (0.073)*** 1.024 (0.061)*** -0.037 (0.007)*** -0.034 (0.007)*** -0.030 (0.006)*** Poland2 -0.122 (0.074) 0.842 (0.051)*** -0.012 (0.007)*** -0.011 (0.007)*** -0.010 (0.006)*** Habitat conservation 0.342 (0.071)*** 0.734 (0.071)*** 0.034 (0.007)*** 0.031 (0.007)*** 0.028 (0.006)*** Landscape preservation 0.183 (0.065)*** 0.590 (0.074)*** 0.018 (0.006)*** 0.017 (0.006)*** 0.015 (0.005)*** Carbon capture 0.111 (0.031)*** 0.126 (0.061)* 0.011 (0.003)*** 0.010 (0.003)*** 0.009 (0.003)*** Own country x Habitat conservation 0.478 (0.111)*** 0.047 (0.011)*** 0.044 (0.010)*** 0.039 (0.009)*** Own country x Landscape preservation 0.412 (0.102)*** 0.041 (0.010)*** 0.038 (0.009)*** 0.033 (0.009)*** Own country x Carbon capture 0.161 (0.047)*** 0.016 (0.005)*** 0.015 (0.004)*** 0.013 (0.004)***
Own country x Denmark 0.332 (0.134)** 0.033 (0.013)** - -
Own country x Estonia 1.245 (0.162)*** - 0.114 (0.015)*** -
Own country x Poland 0.970 (0.105)*** - - 0.079 (0.009)***
Estonian x Price3 -0.115 (0.063) -
Polish x Price3 -0.309(0.077)*** -
Price -1.361 (0.047)*** -
30 Table 5. Parameter and willingness to pay estimates for a random parameter error component logit model for the frequent user model, based on 12498 706
observations from 2083 respondents ( 2 = 9743.25, Pseudo R2 = 0.281, Log-likelihood = -12454.3). We do not present WTP as price parameters differ
707
significantly across many different sub-groups. ***, ** and * indicate significance at the 0.01, 0.05 and 0.1 levels respectively. 708
Variable Parameter (SE) Standard deviations (SE)
ASC1 0.637 (0.135)***
Estonia2 -0.384 (0.078)*** 1.028 (0.065)***
Poland2 0.126 (0.081) 0.081 (0.054)***
Habitat conservation 0.331 (0.085)*** 0.712 (0.077)*** Landscape preservation 0.096 (0.081) 0.575 (0.081)*** Carbon capture 0.146 (0.039)*** 0.141 (0.063)* Own country x Habitat conservation 0.518 (0.120)***
Own country x Landscape preservation 0.415 (0.111)*** Own country x Carbon capture 0.145 (0.051)***
Own country x Denmark 0.376 (0.145)*** Own country x Estonia 1.293 (0.175)*** Own country x Poland 0.978 (0.113)*** Estonian x Price3 -0.136 (0.067)* Polish x Price3 -0.326 (0.083)*** User x Habitat conservation3 0.020 (0.086) User x Landscape preservation3 0.129 (0.080) User x Carbon capture3 -0.036 (0.040)
User x Price3 0.181 (0.051)***
High income x Price3 0.171 (0.051)***
Price -1.528 (0.065)***
709
1 ASC takes the value 1 for the alternative, and is therefore confounded with the reference level of management action in Denmark.
710
2 As compared to management action in Denmark
711
3Additional to “price”
31
Figure Legends
714 715
Figure 1. Northern Europe showing the location of the study regions within Denmark (DK), Poland 716
(PL) and Estonia (EE). For site descriptions as presented to respondents, see Supplementary 717
Material Appendix S1. 718
719
720
Figure 2. Willingness to pay (WTP; € per household per year) for management action over 1000 ha 721
for the own country interactions model (Table 4). The light grey bars indicate the amount 722
participants were willing to pay for actions carried out in their country of residence in addition to 723
the WTP estimate (in dark grey) for actions not taking place in their country of residence. Error bars 724
are standard errors. 725