The impact of the London bombings on the wellbeing of
young Muslims
Arne Risa Hole and Anita Ratcliffe
ISSN 1749-8368
The impact of the London bombings on the wellbeing of
young Muslims
∗
Arne Risa Hole
†University of Sheffield
Anita Ratcliffe
‡University of Sheffield
Abstract
This paper uses the timing of the London bombings, occurring midway through a nationally representative survey of English adolescents, to identify the impact of an exogenous shock to racism on the wellbeing of young Muslims. We extend Lechner (2011) to apply the method of difference-in-differences to ordered response data. Difference-in-differences using non-Muslim adolescents as controls, and a before-after comparison across Muslims alone, both show a decline in the wellbeing of Muslim teenage girls after the bombings, particularly for those facing high levels of deprivation and segregation. No corresponding effects are found among Muslim teenage boys.
Keywords: Racism, Wellbeing, Difference-in-differences, Ordered Response Models
JEL codes: I10, I31, J15
∗We thank Ana Nuevo-Chiquero, Bert Van Landeghem and seminar participants at The University of Sheffield for helpful comments and suggestions. We take full responsibility for any errors. We use the Longitudinal Survey of Young People England (LSYPE), produced by the Department for Education (DfE) and supplied by the Secure Data Service at the UK Data Archive. The data are Crown Copyright and reproduced with the permission of the controller of HMSO and Queen’s Printer for Scotland. The use of these data does not imply the endorsement of the data owner or the UK Data Service at the UK Data Archive in relation to the interpretation or analysis of the data. This work uses research datasets which may not exactly reproduce National Statistics aggregates.
†University of Sheffield, Department of Economics, 9 Mappin Street, Sheffield, S1 4DT. E-mail:
a.r.hole@sheffield.ac.uk
‡University of Sheffield, Department of Economics, 9 Mappin Street, Sheffield, S1 4DT. E-mail:
1
Introduction
A large literature spanning disciplines such as public health, epidemiology, psychology and sociology
analyses racial disparities adult physical and mental health, with racism mooted as a key explanation
in generating these differences (see inter alia Paradies, 2006; Pascoe and Smart Richman, 2009;
Williams and Mohammed, 2009, for reviews). Economists, on the other hand, largely consider the
impact of racial discrimination on labour market outcomes (for a review see Lang and Lehmann, 2012). While opportunities for economic success are undoubtedly important in shaping quality
of life, social and economic outcomes are one dimension of wellbeing, with subjective appraisals
of wellbeing providing another, at times different, perspective on life circumstances. For example,
Stevenson and Wolfers (2012) show that trends in the happiness of minorities relative to whites need
not coincide with trends in labour market outcomes. Analysing subjective wellbeing may therefore
provide complementary evidence on welfare. Indeed, these data now increasingly feature in public
policy, with the UK Office for National Statistics gauging self-reported health and wellbeing, in
addition to traditional measures of living standards, since 2011.
The impact of racism on child development and wellbeing has received relatively less attention.
An existing literature generally finds a detrimental effect of self-reported racism on psychological wellbeing although weaknesses exist in measuring racism and in establishing causality (see Priest
et al., 2013). A clearer understanding of whether racism per se shapes childhood outcomes, and
the extent of its influence, is important given the scope for racism to generate inequalities in
contemporaneous outcomes across children from different backgrounds. It also matters because a
growing body of evidence emphasizes the importance of childhood circumstances in shaping later
outcomes (Conti and Heckman, 2012). Poor psychological health in childhood, in particular, may
damage labour market and relationship prospects in adulthood (Smith and Smith, 2010; Goodman
et al., 2011). Hence, understanding the effects of exposure to racism during formative years may
also shed light on racial disparities in adults.
This paper uses the London bombings as an exogenous shock to racism to study the impact of
racism on adolescent wellbeing. The initial bombings occurred on the 7th July 2005 (henceforth
7/7) and targeted the London transport network with devastating consequences. A further set of
attacks took place on the 21st July 2005 though these bombs failed to detonate. In the aftermath of
these events, special attention was paid to the fact that three of the four 7/7 bombers were British
born with Pakistani heritage, with some elements of the press presenting a negative portrayal of
these minorities (EUMC, 2005). In spite of key Muslim organisations condemning the bombings,
many Muslims - and Asians more generally - became victims of a backlash. For example, in the four
weeks after the attacks, faith-hate crimes increased by 600 per cent compared to the previous year (Greater London Authority, 2006). Hanes and Machin (2014) examine trends in hate crimes over
a longer period, and find that an initial spike in hate crimes against Asians and Arabs diminishes
widespread changes in attitudes towards Muslim minorities. For example, a 12 percentage point
rise in those believing “more religious prejudice exists today compared with 5 years ago” is observed
in The Citizenship Survey immediately after the bombings, with those identifying Muslims as the
victims of prejudice doubling from 25% to 50% (DCLG, 2006).
Our research makes several contributions to the existing literature. Firstly, we exploit the timing
of the London bombings, occurring midway through a large scale nationally representative survey
of adolescents, to estimate the causal effect of racism on the happiness and depression of young
Muslims. To our knowledge, our study is the first to use plausibly exogenous variation in racism
in order to examine its effect on the wellbeing of adolescents. We use the method of difference-in-differences, with non-Muslim adolescents as controls, and a before-after comparison across Muslims
alone, to determine the impact of the bombings, with both approaches producing similar results.
Secondly, in order to implement the method of difference-in-differences in the context of an ordered
choice model, we extend the methodology proposed in Lechner (2011) for the estimation of treatment
effects in a difference-in-differences setting with binary choice models. There is a growing need for
estimators that can handle subjective wellbeing data in this setting in light of the increasing role
given to these data in measures of societal wellbeing, and the extensive role of the method of
difference-in-differences in policy evaluation. Finally, we use restricted-access location and school
data to consider potential heterogeneity in the treatment effect according to neighbourhood and school-level poverty and ethnic segregation.
To preview our results, we find evidence of a decline in the wellbeing of Muslims teenage girls after
the bombings, particularly where girls live in (attend) relatively poor or ethnically segregated areas
(schools). In contrast, we find little evidence that the bombings influence the wellbeing of Muslim
teenage boys. From a methodological viewpoint, our results suggest that OLS performs relatively
well if the goal is to estimate changes in the conditional mean of the outcome variable. However,
in respecting the ordinal nature of subjective wellbeing measures, ordered probit methods have
the advantage of showing whether particular sections of the wellbeing distribution are particularly
responsive to racism. We find clearest evidence that the bombings influenced the lower end of the happiness distribution although there is some suggestion of an impact across the entire distribution.
2
Literature
2.1
Pathways linking racism and health
Racism encompasses prejudice (i.e. differential beliefs about others) and discrimination (i.e.
dif-ferential treatment of others). Minority groups may experience institutionalised racism, suffering
from poorer access to goods and services, or face personalised racism and experience suspicion,
stressor, and hypothesises that stressful events lead to negative affective states that ultimately
af-fect physiological functioning (Williams and Mohammed, 2009). Specifically, psychological stress
activates two endocrine response systems; the hypothalamic-pituitary-adrenocortical axis and the
sympathetic-adrenal-medullary system, with prolonged or repeated activation of these systems
el-evating the risk of physical and psychiatric disorders (see Cohen et al., 2007). Certain stressors
are deemed to have particularly adverse health effects, for example, stressors that are negative,
uncontrollable and unpredictable (Thoits, 2010; Pascoe and Smart Richman, 2009), with exposure
to racism arguably falling into these categories. In addition to any direct influence on health, stress
may also trigger health-damaging coping responses, such as smoking or limited exercising (Cohen et al., 2007).
A person need not experience racism directly in order to be adversely affected by the prevalence
of racism in society. Fear of experiencing racism may in itself increase stress or encourage stress
inducing behaviours, such as heightened vigilance (Carter, 2007). Family members suffering from
racism may also be deleterious if it raises concerns over the likelihood of personally experiencing
racism, leads to concerns for the wellbeing of significant others, or triggers negative coping responses
in those experiencing racism. In particular, parental experiences and/or fear of racism may be
detri-mental to child development and wellbeing given the propensity for parental psychological distress
to influence parental styles, emotional support and the family environment (Sander and McCarty, 2005). Finally, negative stereotypes and media-portrayals of minorities may be internalised, with
minorities losing a sense of pride in themselves (Jones, 2000).
2.2
Related literature
The existing literature investigating the effects of racism on young adults typically focuses on
personalised experiences of racism among African-American teenagers. However, in reviewing this
literature, Priest et al. (2013) find that 121 different measures of racism are employed across 123
studies. Moreover, identifying racist experiences and later reporting these in surveys may be linked
to individual-level characteristics, such as coping style, that may also explain the outcome of interest
(Lauderdale, 2006). More recently, researchers have explored the link between parental experiences
of racism and child outcomes, albeit facing similar issues regarding the measurement, and causal impact, of racism (Caughy et al., 2004; Kelly et al., 2013; Tran, 2014).
Given the scope for omitted variables and endogenous control variables (Yinger, 1998), economists
have recently turned their attention to terrorist activity to identify the causal impact of racism on
the outcomes of ethnic minorities. By focusing on changes in the prevalence of racism in society,
these studies also circumvent the issue of which instruments are available to measure racism in
sur-vey data. The majority of these studies examine labour market outcomes after 9/11 (see inter alia.
D´avila and Mora, 2005; Kaushal et al., 2007; Aslund and Rooth, 2005; Braakmann, 2009) but there
market outcomes (see inter alia. Hanes and Machin, 2014; Braakmann, 2010; Rabby and Rodgers,
2010; Ratcliffe and von Hinke Kessler Scholder, 2015).
Few papers use terrorist activities to examine the effect of an increase in racism on the health
and wellbeing of adults or children. Two notable exceptions examining adult outcomes are Johnston
and Lordan (2012) and Romanov et al. (2012). The latter investigate the impact of terrorism on
the wellbeing of Jewish and Arab Israelis exploiting detailed data on the timing and location of
terrorist attacks. They find little evidence that terrorist activity influences the life satisfaction of
Jews, unless these attacks occur in their city of residence, when a decrease in wellbeing is observed.
In contrast, terrorist activity - particularly where civilian casualties are involved - has a detrimental effect on the life satisfaction of Arabs regardless of the location of terror attacks. These findings are
consistent with increasing levels of hostility after terrorist acts. Johnston and Lordan (2012) use
a difference-in-differences methodology to examine changes in mental and physical health among
Pakistani and Bangladeshi Muslims living in England relative to non-Muslim Indians over a 5-year
period pre and post 9/11. Interestingly, they find evidence of a deterioration in the physical health
of Muslims but little evidence of an increase in psychological distress.
The only study to consider the effects of terrorist activity on child outcomes is Lauderdale
(2006), who focusses on maternal experiences of racism during pregnancy. She compares the birth
weight of children born to Arab mothers in California pre and post 9/11 relative to non-Hispanic whites, and finds a significant increase in low-birth-weight babies for Arab mothers.
3
Data and methodology
3.1
Data
We use data from the Longitudinal Survey of Young People in England (LSYPE), which is a large
panel survey interviewing young persons attending school in England. LSYPE follows a two-stage
sampling design, sampling schools and then students within those schools; with schools in deprived
areas and pupils from Indian, Pakistani, Bangladeshi, Black African, Black Caribbean and Mixed backgrounds over-sampled. All adolescents are first interviewed in 2004 in Year 9 (aged 13-14), with
annual interviews thereafter until 2010.1 LSYPE initially surveyed 15 770 individuals in 2004 (with
complete individual and household-level interviews for 13 914 individuals), achieving a sample of 13
539 individuals in the following year (with 11 952 complete interviews). Interviews are conducted
in the home, where detailed information is collected from the respondent and relevant household
adults on the attitudes, experiences and behaviours of the respondent, and the family environment.
In 2005, respondents (self-complete) the General Health Questionnaire (GHQ), which is
screen-ing instrument originally designed to assess mental distress in those aged 16+ (Goldberg., 1972)
though evidence suggests it can be successfully used on adolescents (French and Tait, 2004). The
version in the LSYPE contains 12 items covering issues ranging from sleep loss to feelings of
self-worth. While answers to GHQ items are typically aggregated to produce a mental distress score
(see for example Metcalfe et al., 2011), the ability of respondents in the LSYPE to select a ‘Don’t
know’ option for each GHQ item makes this approach less attractive. Since ‘Don’t know’ responses
comprise anywhere between 2-11% of supplied responses to any given GHQ item, we can only
con-struct GHQ scores for 78% of respondents. GHQ items have previously been analysed in isolation
in Wolfers (2003) and we take advantage of the fact that two GHQ items focus on affect: ‘Have you
recently been feeling reasonably happy, all things considered?’ with options ‘More so than usual’,
‘About the same as usual’, ‘Less so than usual’, ‘Much less than usual’, ‘Don’t know’ and ‘Have you recently been feeling unhappy and depressed?’ with options‘Not at all’, ‘No more than usual’,
‘Rather more than usual’, ‘Much more than usual’, ‘Don’t know’. Although items are evaluated
relative to a ‘usual state’, the evidence suggests respondents view their ‘usual state’ as one without
symptoms (Goldberg., 1972). We therefore create a happiness score, with higher values indicating
increasing happiness, and a depression score with higher values indicating greater suffering. We
consider both measures because, as noted in Headey and Wooden (2004), wellbeing and illbeing
are not opposite ends of the same spectrum, and factors affecting wellbeing may differ from those
influencing illbeing. ‘Don’t know’ responses respectively comprise 5% and 3% of answers to the
happiness and depression items and we exclude these in our analysis.2
A key feature of the 2005 survey is that the fieldwork spans the six month period between 18th
April - 18th September, with 94% of interviews taking place between 1st May - 31st August. Thus
the London bombings occur midway through the survey period, and as interview month and year
are publicly available, we are able to obtain a reasonably clean separation of the pre and post
treatment period. Our pre-treatment period therefore spans 1st May - 30th June and our
post-treatment period spans 1st July - 31st July. We exclude April, August and September because
relatively few interviews occur in April and September (especially for treated individuals), and
because September coincides with the start of a new school year. August is also excluded in spite
of a reasonable sample size because the month of August falls entirely into the summer holiday period, where teenagers may be engaged in very different activities. Our identification strategy
relies on randomly allocated interview dates in the LSYPE and below we show that there is very
little difference in the composition of people interviewed pre and post treatment.
In addition to collecting information on ethnicity, LSYPE also asks about religious affiliation.
The existing literature on the effect of extremist Islamic terrorism on the outcomes of minorities
constructs the treated population on the basis of religion, ethnicity or both. After the London
bombings, many non-Muslim Asians were the victims of hate crime,3 which may be consistent with
2Our results are unchanged if we merge ‘Don’t know’ responses with‘About the same as usual’. This is perhaps
not surprising since‘Don’t know’ responses are no more likely among the treated group relative to the control group post treatment for these GHQ items. We also obtain qualitatively similar results if we focus on the GHQ index despite concerns about sample selection.
3
mistaken identity or widespread negative effects of the bombings. On the other hand, media coverage
may have been important in shaping attitudes towards minorities, as well as internalised racism,
and a vast amount of this coverage focused on Muslims, and in particular, Asian Muslims. Our main
analyses therefore focuses on the impact of the bombings on Muslims but we also consider the impact
of the bombings on Asians as well as on Asian Muslims. Some studies exclude Indians altogether on
the basis that it is not clear whether Indians are treated (Braakmann, 2010; Kaushal et al., 2007)
while other studies use non-Muslim Indians as a control group (Johnston and Lordan, 2012). We use
non-Muslims as our control group in our main analyses, which means that we compare the change in
outcomes among Muslims, who are almost exclusively non-white,4 to the change in outcomes among non-Muslim whites and minorities. While we could restrict our control group to non-Muslim ethnic
minorities or non-Muslim Indians, Figures 1 and 2 indicate that pre-treatment trends in happiness
and depression are very similar between Muslims and non-Muslims while Figures A1 and A2 in the
Appendix show signs of dissimilar trends. Figure 1 shows relatively constant differences in happiness
among treated and control groups in May and June, with Muslim teenagers happier on average than
non-Muslims teens. From July onwards, this difference diminishes, largely driven through a decline
in the happiness of Muslim teenagers. Conversely, there is little indication of changes in depressive
symptoms among Muslims relative to non-Muslims after the bombings. These figures, however, do
not control for any differences in the characteristics of Muslims and non-Muslims.
After cleaning our data and imposing restrictions on the interview month, our sample
com-prises 1182 Muslims and 8130 non-Muslims, with 36% of Muslims and 27% of non-Muslims
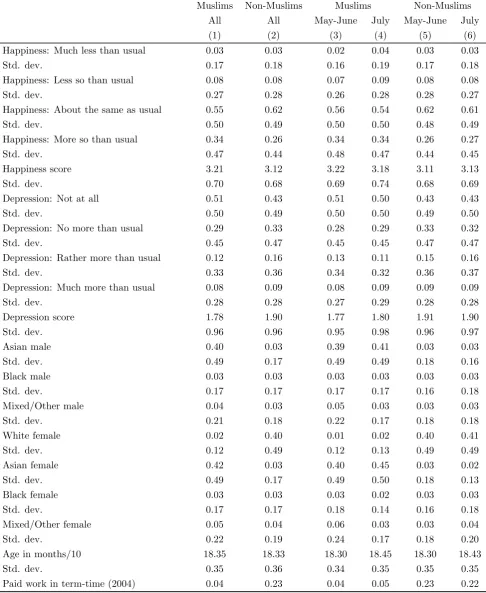
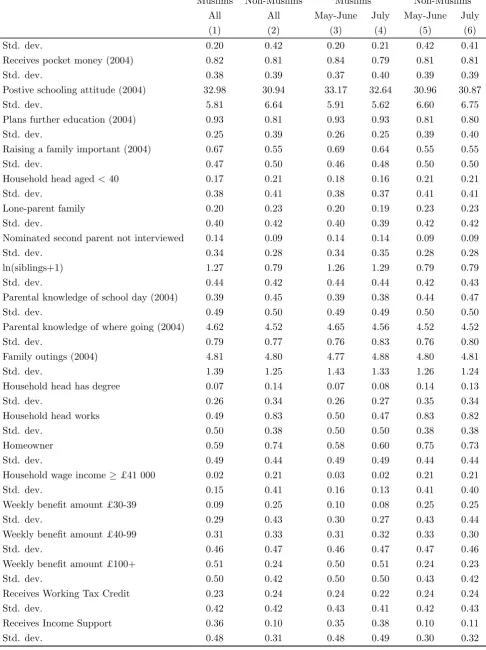
inter-viewed in July 2005, which partially reflects regional differences in the timing of interviews. Table 1
presents summary statistics, distinguishing between Muslims and non-Muslims, and pre/post
bomb-ings within these groups. As Table 1 shows, differences exist between Muslims and non-Muslims in
terms of attitudes, family circumstances, and area of residence. For example, Muslim teenagers are
more ambitious and have more siblings compared to others. Their parents are less likely to have a
degree and work full-time. Unfortunately, earnings data is missing for 19% of the sample so we only
construct a dummy variable indicating household earnings are in the top third of the distribution. Persons with missing data are placed into the base category, where they most likely would have been
had their earnings data been available. This proxy of economic resources, as well as benefit receipt
and home ownership levels suggests that parents of Muslim teens are typically poorer. On the other
hand, there are very few differences in the composition of Muslim (non-Muslim) samples before and
after the bombings. These summary statistics suggest that a combination of difference-in-differences
and a before-after comparison across Muslims alone may be required to robustly establish the impact
of the bombings on teenage wellbeing. One advantage to using a difference-in-differences strategy
is that temporal effects in wellbeing can be taken into account. This is important because, for
example, schools often wind down the school year in July, resulting in fewer academic stresses and more leisure activities in final teaching weeks. This, in combination with better weather and longer
evenings, suggests the wellbeing of teenagers may improve in July so that ignoring temporal effects
may understate any treatment effect. Another advantage is that any unobserved differences between
persons interviewed earlier and later in the survey period would be differenced away as long as any
unobserved differences are unrelated to treatment status. However, a disadvantage to the method
of difference-in-differences when the treated and control groups are somewhat dissimilar is that the
common trends assumption may not be satisfied, and more generally, issues of balance and overlap
may influence treatment effect estimates in a regression context. A before-after comparison across
Muslims alone guarantees a comparison of similar individuals but assumes zero temporal effects in
wellbeing. We seek to verify that both approaches yield the same overall conclusions.
3.2
Empirical Model
Both dependent variables are ordered categorical variables and using a linear regression to model
such outcomes requires assuming that, for example, happiness is cardinal. A priori, however, it is
unclear that a person answering ‘same as usual’ is twice as happy as they would have been had
they instead answered ‘much less than usual’. Respecting the ordinal nature of these data requires
estimating ordered response models, which model the probability of selecting a particular response
category. This approach also has the advantage of highlighting whether the treatment effect is
confined to specific segments of the happiness distribution, or whether it is observed across the
entire distribution. For the method of difference-in-differences, a problematic feature of ordered
response models is that the common trends assumption required to identify the treatment effect is unlikely to hold for these probabilities (Blundell and Costa Dias, 2009; Lechner, 2011). Previous
research analysing subjective wellbeing data in difference-in-differences-style settings either uses
linear regression (Brodeur, 2013) or constructs dummy variables for each response category and
uses linear probability models to analyse these dummy variables (Gruber and Mullainathan, 2005;
Leicester and Levell, 2013). The latter approach is troublesome for ‘middle’ response categories,
such as ‘same as usual’. For example, if more income is associated with greater happiness, we
might expect an increase in income to reduce the likelihood of ‘much less than usual’ responses
and increase the likelihood of‘more so than usual’ responses. Yet constructing a dummy variable
for the response category ‘same as usual’ places both ‘much less than usual’ and ‘more so than usual’ responses into the base category, which forces income to have one effect on the probability
of observing ‘same as usual’ and exactly the opposite effect on both ‘much less than usual’ and
‘more so than usual’.
In this paper, we adopt an alternative approach to estimate an ordered response model by
specifying common trends at the level of the latent variable (see Blundell and Costa Dias, 2009;
Lechner, 2011, for similar applications in the context of binary choice models). Thus we assume that
there is some underlying unobserved latent wellbeing index that determines which response category
on whether the treatment is received or not, which are in turn driven by two possible realisations of
the latent wellbeing index. For example, in the instance that an individual receives the treatment,
their latent wellbeing is equal to that realised under the treatment, denoted byY1∗
i , while it isY0
∗
i if no treatment is received. These potential realisations of the latent wellbeing index can by modelled
as a function of group membership, time, and individual-level characteristics. Thus:
Yi1∗ =β1Di +δ1Ti+X
0
iγ +εi (1)
Yi0∗ =β1Di +δ0Ti+X
0
iγ +εi (2)
whereDi is equal to one if an individual ultimately receives the treatment,Ti is equal to one in the
post-treatment period,Xi0 is a vector of individual characteristics andεi is an error term, which is
assumed to be IID standard normal. Hence, potential latent wellbeing varies across treatment states
only insofar as there being an average difference in latent wellbeing after treatment is received.
It is straightforward to show that the change in the untreated potential latent wellbeing index
over time is the same regardless of whether an individual ultimately receives the treatment (i.e.
E(Y0∗
i |Di= 1, Ti= 1, xi)−E(Yi0∗|Di= 1, Ti= 0, xi) =E(Yi0∗|Di= 0, Ti= 1, xi)−E(Yi0∗|Di= 0, Ti= 0, xi) =δ0). Potential realisations of latent wellbeing map onto potential outcomes as follows:
YiD =k if µk < YiD∗ ≤µk+1, k= 1, ..., K (3)
where k is one of multiple ordered response categories ranging from 1 to K. Thus we observe the
potential treated outcome equal to the response category k if the treated realisation of the latent wellbeing index falls within the range defined by the two thresholds µk and µk+1 (likewise for
the potential untreated outcome). The probability of observing a particular potential outcome is
therefore given by:
Pik =E(I(YiD =k)|Di, Ti, xi)
= Φ(µk+1−E(YiD∗ |Di, Ti, xi))−Φ(µk−E(YiD∗ |Di, Ti, xi)) (4)
whereI(·) is the indicator function and Φ(·) is the standard normal CDF. In practice, an individual
either receives the treatment or not and thus only one of two potential latent wellbeing indices is
realised and only one of two potential outcomes is observed. This feature implies the following
realisation rule for the latent wellbeing index:
Yi∗ =DiYi1∗+ (1−Di)Yi0∗ =Di(β1Di+δ1Ti+x
0
iγ+εi) + (1−Di)(β1Di+δ0Ti+x
0
iγ+εi)
=β1Di+δ0Ti+ (δ1−δ0)DiTi+x
0
iγ+εi
=β1Di+β2Ti+β3DiTi+x
0
whereβ2 =δ0 and β3 =δ1−δ0. Another implication of observing only one potential outcome per
individual is that we cannot construct an individual-level treatment effect. We therefore focus on
the average treatment effect on the treated (ATET), and specifically, in terms of the probability of
observing a particular response category:
AT ETPk =E(I(Y
1
i =k)−I(Y
0
i =k)|Di = 1, Ti = 1) (6)
i.e. the expected difference in the probability of reporting response category k for a randomly chosen
individual out of those individuals who ultimately receive the treatment. Although the expected
counterfactual probability is not itself observed, we can use the common trends assumption to model
the potential latent wellbeing index in the absence of treatment, which delivers this counterfactual
probability. For example:
E(Y0∗
i |Di = 1, Ti = 1, xi)
=E(Yi0∗ |Di = 1, Ti = 0, xi) +E(Yi0∗ |Di = 0, Ti = 1, xi)−E(Yi0∗ |Di = 0, Ti = 0, xi) =E(Yi∗ |Di = 1, Ti = 0, xi) +E(Yi∗ |Di = 0, Ti = 1, xi)−E(Yi∗ |Di = 0, Ti = 0, xi)
=β1+β2+x0iγ (7)
suggesting that the the unobserved counterfactual probability for the treated group post treatment
can be obtained via:
E(I(Yi0 =k)|Di = 1, Ti = 1, xi) = Φ(µk+1−β1−β2−x0iγ)−Φ(µk−β1−β2−x0iγ) (8)
which is easily estimated using an ordered probit model. The average treatment effect on the treated (ATET) in terms of the probability of observing a particular outcome is therefore given by:
AT ETPk =E(I(Y
1
i =k)−I(Y
0
i =k)|Di = 1, Ti = 1)
= 1
N1
N
X
i=1
DiTi{I(Yi =k)−[Φ(µk+1−β1−β2−x0iγ)−Φ(µk−β1−β2−x0iγ)]} (9)
whereN1 =PN
i=1DiTi. 5
The ATET in terms of the expected value of the outcome variable can then be obtained via:
AT ETY =E(Yi1−Y
0
i |Di = 1, Ti = 1) = K
X
k=1
k×AT ETPk (10)
5An alternative estimator of AT ET
Pk, which is a logical extension of the estimator proposed by Puhani (2012)
in the context of binary choice models, is given by substitutingI(Yi=k) in equation 9 by Φ(µk+1−β1−β2−β3−
x0iγ)−Φ(µk−β1−β2−β3−x0iγ). Since the average of the predicted probabilities is not, in general, identical to the
Clearly, it is implicitly assumed that the outcome variable is cardinal when calculating AT ETY,
while the above discussion highlights the problem of imposing this assumption a priori. Nevertheless,
AT ETY provides a useful summary measure of the treatment effect, which can be estimated using
both linear and ordered models. For example, an alternative estimator ofAT ETY used to date in
the literature is the estimated coefficient onDi×Ti in a linear regression ofYi onDi,Ti,Di×Ti and
xi. A comparison of both approaches is of interest given the relative simplicity of latter approach
(subject to the caveat that the outcome variable may not be cardinal).
In addition to using the method of difference-in-differences, in which we compare the change
in wellbeing of Muslims to non-Muslims, we also calculate the before-after difference in wellbeing across Muslims, which guarantees a comparison of similar individuals. This is done by estimating
the ordered probit model defined in equations 1-5 on the treated group sample, excluding Di and
Di×Ti as regressors. The estimate of AT ETPk can then be obtained via:
AT ETPk =E(I(Y
1
i =k)−I(Y
0
i =k)|Di = 1, Ti = 1)
= 1
N1
N
X
i=1
DiTi{I(Yi =k)−[Φ(µk+1−x0iγ)−Φ(µk−x0iγ)]} (11)
where the expression in the square brackets represents the unobserved untreated potential outcome.
This assumes that, conditional on xi, no factors other than the treatment have an impact on the
difference in reported wellbeing between individuals observed in the pre- and post-treatment periods.
As before an estimate of AT ETY based on equation 10 can be obtained.
Both the method of difference-in-differences and the before-after comparison exploit variations
in wellbeing over time in order to estimate the treatment effect. In doing so, the former approach
requires that there are no other contemporaneous events that would differentially affect the
well-being of Muslims versus non-Muslims while the latter approach requires that there are no other
contemporaneous events. Such contemporaneous events may include religious festivities, exams and
school holidays. A coincidence of several factors suggests that this requirement may be satisfied. Firstly, in 2005 key religious festivals took place outside of our observation window, with Lent and
Passover occurring beforehand, and Ramadan and Diwali afterwards. Secondly, students in
Eng-land are tested at the end of Key Stage 3 in Year 9 and at the end of Key Stage 4 in Year 11, with
the latter determining whether students can progress to post-compulsory education. Given that
we observe adolescents towards the end of Year 10, we avoid national exams, but that does not
preclude students taking school-specific exams. Finally, national school holidays begin towards the
end of July, and children from different backgrounds may be engaged in different activities during
this time. Unfortunately, we do not have access to the exact date of interview so our effect may
to some extent pick up school holiday activities. However, the second wave of bombings occurred towards the end of July, with the atmosphere surrounding this second attack likely to dominate any
bombings.
Metcalfe et al. (2011) present evidence of widespread declines in wellbeing following terrorist
attacks arising through a ‘fear and destruction’ channel. If treated and control groups respond in
the same way to a ‘fear and destruction’ channel, any additional effect on Muslim teenagers would
reflect the shock to racism, and we still estimate the treatment effect in a difference-in-difference
setting. However, if Muslims respond more strongly to this channel, because the attacks were
carried out by other (albeit extremist) Muslims, combined with the resulting media coverage, we no
longer estimate the causal effect of racism but instead estimate a causal effect of the bombings. If
non-Muslims respond more strongly to this channel, we could understate the causal effect of racism or the bombings. For the before-after comparison across Muslims alone, the estimated treatment
effect may combine both the shock to racism and any ‘fear and destruction’ effect.
Finally, in using cross-section data, we also require that there are no changes in the composition
of our treated and control samples before and after the bombings. However, as we show in Table 1,
the composition of the Muslim (non-Muslim) sample before and after the bombings is similar.
4
Results
4.1
Main results
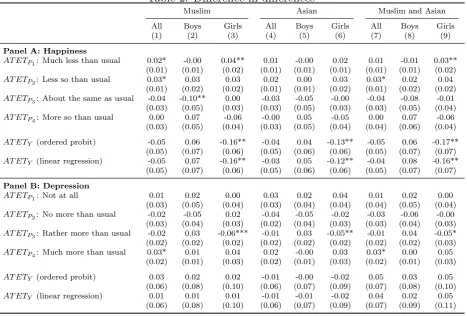
Table 2 presents a series of treatment effect estimates using the method of difference-in-differences.
Rows 1-4 focus on the probability of observing a particular response category (see equation 9)
while rows 5-6 focus on the expected value of the outcome variable, where row 5 presents estimates
using the modelled response probabilities (see equation 10) and row 6 presents linear regression
estimates. Panel A presents results for happiness, where in columns 1-3 we specify the treated
(control) group as Muslim (non-Muslim) teenagers, in columns 4-6 we specify the treated (control)
group as Asian (non-Asian) teenagers and in columns 7-9 Asian Muslim (Non-Asian Muslim and
non-Muslim) teenagers are the designated treated (control) group.6 For each treatment definition, we first focus on the impact on all teenagers, and subsequently on male and female teenagers.
The results in column 1 suggest an adverse effect of the London bombings on the happiness of
Muslims relative to non-Muslim teenagers. Specifically, the bombings increase the probability of
response categories‘much less than usual’ and‘less than usual’ by 2 and 3 percentage points relative
to non-Muslims, with both estimates statistically significant at the 10 percent level. These are large
effects as the pre-treatment frequencies of these response categories are 2% and 7%, respectively
(see Table 1).7 Conversely, the probability of reporting ‘same as usual’ decreases by 4 percentage
6We find similar results when using a consistent control group across all treatment definitions i.e. non-Muslim
whites and non-Muslim non-Asian minorities.
7Since only a small number of respondents reported ‘much less than usual’ in the pre-treatment period we also
points although this effect is not precisely determined, and there is little evidence that the bombings
influence the probability of reporting‘more so than usual’. Treating happiness as cardinal instead
of ordinal to evaluate the average change in the happiness score suggests a decline of 0.6, which
is equivalent to 2 percent of the average pre-treatment happiness score among Muslims (see Table
1). It seems to make little difference if a linear regression is used instead of the modelled response
probabilities to evaluate the average change in the happiness score.
Although these results point towards widespread effects of the bombings, columns 2 and 3 tell a
different story: the detrimental impact of the bombings is largely concentrated among teenage girls.
Here the probability of responding‘much less than usual’ increases by 4 percentage points relative to non-Muslim teenage girls, an effect that is statistically significant at the 5 percent level. There
is also evidence of an increase in the probability of reporting ‘less than usual’ and a substantial
decline in the probability of reporting ‘more so than usual’, but those estimates are imprecise
and insignificantly different from zero. For teenage boys, the pattern of changes in each response
category is not consistent with a general decline in happiness. Consistent with these findings,
happiness scores also fall by 0.16 units for teenage girls, with little evidence to support a decline in
happiness among teenage boys.
Changing the treatment definition does not substantively change our results (see columns
4-9) although the estimated impact of the bombings on Asians is slightly smaller. Nevertheless, these findings indicate that ethnicity may substitute for religion where the latter is unavailable. In
contrast, the definition of wellbeing may be important for understanding the impact of racism on
adolescents. Results presented in Panel B depict a more modest effect of the bombings on feelings
of unhappiness and depression. Relative to non-Muslims there is some evidence of an increase in the
‘much more than usual’ response category and of a decline in response categories ‘rather more than
usual’ and ‘no more than usual’. However, when looking at teenage boys and girls separately, the
pattern of changes in each response category is not consistent with a general increase in depression,
with reductions in middle response categories offset by increases in response categories both above
and below. In line with this, there is little evidence of an overall increase in depression levels. Table 3 presents a series of treatment effect estimates based on a before-after comparison among
Muslims alone. These results are also supportive of a decline in the wellbeing of Muslim teenage
girls, though these estimates are smaller in absolute value. These findings are consistent with the
method of difference-in-differences taking into account temporal effects in wellbeing (where those
temporal effects suggest that wellbeing increases over time) while before-after comparisons impose
zero temporal effects.
From a methodological viewpoint, our results suggest that the ordered probit approach provides
a more complete picture of the impact of the bombings, with the clearest effects observed at the
lower end of the happiness distribution. However, there is also suggestive evidence of an effect across the entire happiness distribution. In subsequent analyses, for brevity, we restrict our attention to
to the ordered probit approach in this context we use linear regression.
4.2
Robustness checks
Using both the method of difference-in-differences and a before-after comparison across Muslims
alone, we find evidence of a decrease in happiness and increase in depression among Muslim teenage
girls after the bombings. While this evidence is consistent with a shock to racism, it is also possible
that the wellbeing of our treated and control groups naturally diverge at this age. We can test for
divergent paths in wellbeing by excluding July from our sample and assigning a pseudo treatment
in the month of June. If our estimated treated effect simply reflects differential trends in wellbeing
across Muslims and non-Muslims, or different levels of wellbeing across Muslims interviewed earlier
compared to later in the survey period, we might expect to estimate a similar treatment effect for any pseudo treatment assigned prior to the bombings, albeit with lower precision owing to a
reduced sample. Table 4 presents results from this exercise across all definitions of treatment, where
panels A and B report difference-in-differences estimates and Panels C and D report estimates from
a before-after comparison. For Muslims, these results suggest that the wellbeing of Muslims versus
non-Muslims, and Muslims interviewed earlier versus later in the survey period, followed a similar
trajectory prior to the bombings. For example, the estimated treatment effect ranges between 0
and -0.3, which does not approach statistical significance even in the event that estimated standard
errors had not increased. There is more evidence, however, of differential trends in wellbeing across
Asians. This is perhaps not surprising since this treatment definition includes Indians who are not Muslim, and Figure A1 suggests that the wellbeing of this group declined prior to July. From this
point onwards, therefore, we focus our attention on Muslims as the treated group.
In other falsification tests we use the 2004 wave of the LSYPE to investigate whether (i) Muslims
interviewed in July 2005 are just different from others, leading to differences in outcomes in other
years and (ii) longer evenings and the onset of the summer holiday produces a ‘July effect’. While
we are unable to analyse happiness and depression directly, as the GHQ is not asked of respondents
in 2004, we have access to information on how, and with whom, teenagers spend their time, which
is arguably linked to their wellbeing. Specially, we analyse the following questions ‘Thinking back
over the last 7 days, how many times have you had friends round to your house?’, ‘Thinking back over the last 7 days, how many times have you gone out with friends?’, and ‘In the past 7 days,
how many times have you eaten an evening meal together with the rest of your family who live
with you?’ where respondents can select ‘None’, ‘1 or 2’, ‘3-5’ or ‘6-7’. Most teenagers answer the
first two questions but non-response rates are 3.5% for the third question. This analysis is subject
to a number of caveats, which should be borne in mind when interpreting results. A first caveat
is that interviews in 2004 take place between April-July, and individuals interviewed in July 2004
are not the same individuals interviewed in July 2005. For example, just 14% of individuals are
there are systematic differences between Muslims interviewed in July 2005 we continue with our
current definition of treatment (i.e. Muslims interviewed in July 2005) and sample. To investigate
whether there is a ‘July effect’ we allocate treatment to all Muslims interviewed in 2004 regardless
of when they were interviewed in 2005, and to test whether people engage in different activities over
the same period in a different year we restrict the sample to those interviewed May-July 2004. A
second caveat is that the weather influences whether teenagers go out with their friends, and this
differed in July 2004 compared with July 2005, with poor weather conditions in July 2004. A third
caveat is that Key Stage 3 testing (by school teachers) takes place in May 2004. A final caveat is
that, as we must restrict the set of control variables to those available in 2004 we are unable to control for income and the amount of weekly benefits received, and economic resources are likely
to be an important determinant of how teenagers spend their time. Results presented in Table 5
provide little evidence of systematic differences in the activities undertaken by Muslims interviewed
in July 2005 in the previous year. There is some evidence for a ‘July effect’ in 2004 when using
the method of differences-in-differences but this essentially disappears in before-after comparisons
across Muslims alone. This evidence suggests that it is unlikely that our results are an artefact of
sampling issues or a ‘July effect’.
Instead of constructing a before-after comparison to guarantee the comparability of treated and
control groups, we could use a matching difference-in-differences estimator based on the propensity score. It transpires, however, that finding good matches between Muslims and non-Muslims is
difficult owing to differences in attitudes across Muslim and non-Muslim teenagers. For example,
using a lack of parental home ownership and degree status as crude proxies of (a lack of) economic
resources, poorer Muslim teenagers have better attitudes towards school, are more likely to plan
further education, and believe that raising a family is more worthwhile relative to poorer non-Muslim
teenagers. Thus where it is possible to find satisfactory matches for poorer Muslim teenagers in
terms of economic resources, it is difficult to match these teenagers on attitudes. In contrast, we are
able to match Muslims interviewed before and after the bombings relatively easily, with results using
matching in combination with regression to calculate before-after differences suggesting slightly larger treatment effect estimates (available on request).
4.3
Extensions
In this section, we investigate whether there are heterogenous treatment effects among teenagers
living in relatively poor and ethnically segregated areas. We might expect the effect of the bombings
to vary across neighbourhood poverty because exposure to crime may be higher in deprived areas.
Alternatively, adolescents living in these areas may be less-well equipped to deal with an increase
in racism. In particular, living in neighbourhood disadvantage may expend mental and physical
resources required to cope with shocks, and may reduce the capacity of parents to provide effective
to the bombings, the opposite may be true for residential segregation. For example, exposure to
racism may be lower in more segregated areas, and more community support may be available
when racism is experienced. However, it may also be the case that teenagers are more likely to
learn about, and know, people subject to discrimination after the bombings. Disentangling effects
of area poverty and segregation is difficult in practice, however, because the two often coexist (see
Becares et al., 2009, for an interesting discussion on some of these issues). Moreover, location is a
choice variable, which may be correlated with unobserved factors that in turn influence the outcome
of interest. Using an experimental set-up to circumvent issues of endogenous location, Kling et al.
(2007) show that the outcomes of teenage girls, and particularly mental health outcomes, improve when families move to better neighbourhoods. In contrast teenage boys fare worse on a range of
outcomes. Research from the UK suggests very small, if any, effects of the local area on adult health
(see inter alia. Karlsen et al., 2002; Shields and Wailoo, 2002; Becares et al., 2009). However, such
effects may be more pervasive among certain groups, for example, Propper et al. (2005) find that area
disadvantage is more important in shaping the mental health of women and ethnic minorities, while
Knies et al. (2014) find positive effects of segregation on the life satisfaction of second-generation
Asians.
We have access to data on the characteristics of the neighbourhood and the school attended by
adolescents, and are therefore able to compare and contrast the impact of schools versus neighbour-hoods. An advantage of using schooling data is that teenagers spend most of their day in school,
and as a result, interactions with others may be shaped by the characteristics of the school rather
than those of the neighbourhood. This is particularly relevant in England where schools are more
segregated than neighbourhoods (Johnston et al., 2008), and where school sorting by ethnicity may
also produce a concentration of poverty in schools. Nevertheless, schools are in a good position to
react to the bombings, by offering counselling or leisure activities to students, where the number of
attending students from affected backgrounds would likely influence such reactions. Thus, a priori,
it is unclear how the characteristics of neighbourhoods and schools would shape teenage wellbeing
in the aftermath of the bombings.
To capture neighbourhood poverty we use the 2004 Index of Multiple Deprivation (IMD)
mea-sured at the level of Lower Super Output Areas (LSOA), which roughly corresponds to 1000
house-holds. Measuring neighbourhood segregation is less straightforward because we seek to measure
segregation along the lines of religion but only have access to data on ethnicity. Moreover, the
lowest available geography at which ethnicity data is available is Local Authority Districts (LAD),
which are responsible for providing local public services in England. We therefore use Population
Estimates by Ethnic Group (PEEG) available from the Office for National Statistics to calculate the
proportion of Pakistanis and Bangladeshis living in each LAD. We use Pakistani and Bangladeshi
populations to proxy Muslims because over 98% of individuals corresponding to these ethnic groups are Muslim in the LSYPE (which has cruder definitions of ethnicity compared to PEEG). Free
measured as the proportion of Pakistanis and Bangladeshis attending.
We focus on the before-after comparison in this analysis because Muslims are much more likely to
face poverty and ethnic segregation compared to non-Muslims, suggesting scope for large observed
and unobserved differences between Muslims and non-Muslims facing high levels of poverty and
ethnic segregation. Measures of poverty and ethnic segregation are therefore included in the set of
control variables and are also interacted with a dummy variable for July 2005. Note that finding
evidence of more pronounced treatment effects for Muslims living in poverty may suggest that area
deprivation influences how young people, or others around them, react to the bombings, but it may
equally reflect unobservable similarities between young Muslims living in deprived areas. Similarly, finding evidence of more pronounced treatment effects for Muslims living in ethnically concentrated
areas may indicate deleterious effects of ethnic segregation, a coexistence of ethnic segregation and
poverty where the latter is more important, or the presence of unobservable similarities between
young Muslims living in enclaves. Finally, finding evidence of more pronounced treatment effects
in schools rather than neighbourhoods may be consistent with schools being more important than
neighbourhoods in shaping outcomes or that unobservable similarities are greater among young
Muslims attending the same school. We are unable to distinguish between these possibilities. Our
ambition is simply to document possible heterogeneities in the treatment effect.
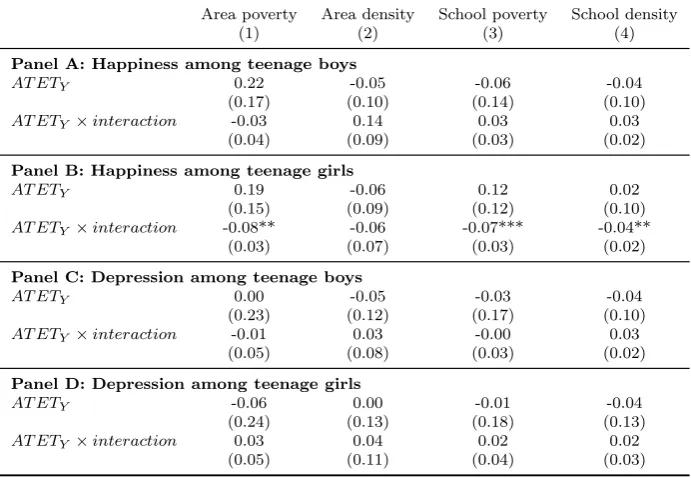
Results presented in Table 6 provide little evidence of any effect of the bombings on the happiness of Muslim teenage boys after taking into account potential heterogeneities. However, for Muslim
teenage girls, these results indicate that poverty may be an important factor in shaping reactions
to the bombings, with teenagers living in poverty showing signs of greater distress. Specifically,
each unit increase in the area IMD score decreases reported happiness after the bombings by 0.007
units. To illustrate what this means in practice, we calculate the estimated treatment effect at the
25th, 50th and 75th percentiles of area poverty in Table 7. This shows that there is very little effect
of the bombings where Muslim teenagers live in relatively more affluent areas, a non-trivial effect
across representative levels of area poverty among Muslims, and a sizeable effect where Muslim
teenagers live in the poorest areas. This latter effect is equivalent to a 7 percent decline in the pre-treatment happiness score. We also find a detrimental influence of ethnic segregation, highlighting
the difficulties in separating the effects of ethnic segregation from that of poverty or other
unob-servable characteristics of Muslims living in similar environments. Results are remarkably similar
if we consider the characteristics of the school instead of the area, despite school choices increasing
observed and unobserved similarities between students attending the same school. Finally, there is
no equivalent evidence to support heterogeneous impacts of the bombings on depression.
5
Conclusion
This paper exploits the timing of the London bombings to estimate the causal effect of an exogenous
using non-Muslim adolescents as a control group, and a before-after comparison across Muslims
alone, show the bombings led to a decline in the happiness of Muslim teenage girls. We also
find evidence that this detrimental impact on happiness is larger for those facing higher levels of
deprivation and ethnic segregation. No corresponding effects are found for Muslim teenage boys.
From a methodological viewpoint, we extend the framework presented in Lechner (2011) in the
context of binary choice models, in order to apply the method of differences-in-differences to ordered
response data. We find that it makes little difference whether we use OLS or ordered probit where
the goal is to estimate the impact on the conditional mean of the outcome variable. However,
in respecting the ordinal nature of subjective wellbeing measures, ordered probit methods have the advantage of showing whether particular sections of the wellbeing distribution are particularly
responsive to racism. We find clearest evidence of an impact at the lower end of the happiness
distribution although there is some suggestion of an impact across the entire distribution.
While our analysis suggests a decrease in happiness among Muslim teenage girls we do not find
evidence of an increase in depression. Although this could be a genuine result, we cannot rule out
the possibility that teenagers find it more difficult to answer questions on depression, which may be
a less familiar concept to them. In addition, although evidence that the London bombings resulted
in a decline in the happiness of Muslim teenage girls is consistent with an increase in racism, there
remain other channels through which the bombings may have had an effect. In particular, Muslims and non-Muslims may have experienced a decline in wellbeing through a ‘fear-and-destruction’
channel, but the fact that the attacks were carried out by other (albeit extremist) Muslims, along
with the resulting media coverage, could have had an additional impact on the happiness of teenage
Muslim girls. These competing explanations are difficult to disentangle, especially since they may
partially overlap. Finally, we provide evidence of a short-term impact of the bombings on subjective
wellbeing, and it remains unclear whether an effect on happiness is short-lived or long-lived. The
latter is likely to be of most concern to policymakers. These remaining issues are all avenues for
References
Aslund, O. and D. O. Rooth (2005). Shifts in attitudes and labor market discrimination: Swedish experiences after 9-11. Journal of Population Economics 18(4), 603–629.
Becares, L., J. Nazroo, and M. Stafford (2009). The buffering effects of ethnic density on experienced racism and health. Health & Place 15(3), 700 – 708.
Blundell, R. and M. Costa Dias (2009). Alternative approaches to evaluation in empirical microe-conomics. Journal of Human Resources 44(3), 565–640.
Braakmann, N. (2009). The impact of September 11th 2001 on the employment prospects of Arabs and Muslims in the German labor market. Journal of Economics and Statistics 229, 2–21.
Braakmann, N. (2010). Islamistic terror and the labour market prospects of Arab men in England: Does a country’s direct involvement matter? Scottish Journal of Political Economy 57(4), 430– 454.
Brodeur, A. (2013). Smoking, income and subjective well-being: Evidence from smoking bans. IZA Discussion Papers 7357, Institute for the Study of Labor (IZA).
Carter, R. (2007). Racism and psychological and emotional injury: Recognizing and assessing race-based traumatic stress. The Counseling Psychologist 35, 13–105.
Caughy, M. O., P. J. O’Campo, and C. Muntaner (2004). Experiences of racism among African American parents and the mental health of their preschool-aged children. American Journal of Public Health 94(12), 2118 – 2124.
Cohen, S., D. Janicki-Deverts, and G. E. Miller (2007). Psychological distress and disease. Journal of the American Medical Association 298(14), 1685–1687.
Conti, G. and J. J. Heckman (2012). The economics of child well-being. Working Paper 18466, National Bureau of Economic Research.
D´avila, A. and M. Mora (2005). Changes in the earnings of Arab men in the US between 2000 and 2002. Journal of Population Economics 18(4), 587–601.
DCLG (2006). 2005 Citizenship Survey: Race and Faith Topic Report. Report, Department of Communities and Local Government.
EUMC (2005). The impact of 7 July 2005 bomb attacks on Muslim communities in the EU. Report, European monitoring centre on Racism and Xenophobia.
French, D. J. and R. J. Tait (2004). Measurement invariance in the General Health Questionnaire-12 in young Australian adolescents. European Child & Adolescent Psychiatry 13(1), 1–7.
Goldberg., D. P. (1972). The Detection Of Psychiatric Illness By Questionnaire. London: Oxford University Press.
Greater London Authority (2006). Muslims in London. Report, Greater London Authority.
Gruber, J. H. and S. Mullainathan (2005). Do cigarette taxes make smokers happier? The B.E. Journal of Economic Analysis & Policy 5(1), 1–45.
Hanes, E. and S. Machin (2014). Hate crime in the wake of terror attacks: Evidence from 7/7 and 9/11. Journal of Contemporary Criminal Justice 30(3), 247–267.
Headey, B. and M. Wooden (2004). The effects of wealth and income on subjective well-being and ill-being. Economic Record 80, S24–S33.
Johnston, D. W. and G. Lordan (2012). Discrimination makes me sick! An examination of the discrimination-health relationship. Journal of Health Economics 31(1), 99 – 111.
Johnston, R., S. Burgess, R. Harris, and D. Wilson (2008). Sleep-walking towards segregation? The changing ethnic composition of English schools, 1997-2003: An entry cohort analysis. Transac-tions of the Institute of British Geographers 33(1), 73–90.
Jones, C. (2000). Levels of racism: A theoretic framework and a gardener’s tale. American Journal of Public Health 90(8), 1212–1215.
Karlsen, S., J. Y. Nazroo, and R. Stephenson (2002). Ethnicity, environment and health: Putting ethnic inequalities in health in their place. Social Science & Medicine 55(9), 1647 – 1661.
Kaushal, N., R. Kaestner, and C. Reimers (2007). Labor market effects of September 11th on Arab and Muslim residents of the United States. Journal of Human Resources 42(2), 275–308.
Kelly, Y., L. Becares, and J. Nazroo (2013). Associations between maternal experiences of racism and early child health and development: Findings from the UK Millennium Cohort Study.Journal of Epidemiology and Community Health 67(1), 35–41.
Kling, J. R., J. B. Liebman, and L. F. Katz (2007). Experimental analysis of neighborhood effects.
Econometrica 75(1), 83–119.
Knies, G., A. Nandi, and L. Platt (2014). Life satisfaction, ethnicity and neighbourhoods: Is there an effect of ethnic composition on life satisfaction. ISER working paper series, ISER.
Lang, K. and J.-Y. K. Lehmann (2012). Racial discrimination in the labor market: Theory and empirics. Journal of Economic Literature 50(4), 959–1006.
Lauderdale, D. S. (2006). Birth outcomes for arabic-named women in California before and after September 11. Demography 43(1), 185–201.
Lechner, M. (2011). The estimation of causal effects by difference-in-difference methods. Founda-tions and Trends(R) in Econometrics 4(3), 165–224.
Leicester, A. and P. Levell (2013). Anti-smoking policies and smoker well-being: Evidence from Britain. IFS Working Papers W13/13, Institute for Fiscal Studies.
Paradies, Y. (2006). A systematic review of empirical research on self-reported racism and health.
International Journal of Epidemiology 35(4), 888–901.
Pascoe, E. A. and L. Smart Richman (2009). Perceived discrimination and health: A meta-analytic review. Psychological Bulletin 135(4), 531–554.
Priest, N., Y. Paradies, B. Trenerry, M. Truong, S. Karlsen, and Y. Kelly (2013). A systematic review of studies examining the relationship between reported racism and health and wellbeing for children and young people. Social Science & Medicine 95, 115 – 127.
Propper, C., K. Jones, A. Bolster, S. Burgess, R. Johnston, and R. Sarker (2005). Local neigh-bourhood and mental health: Evidence from the UK. Social Science & Medicine 61(10), 2065 – 2083.
Puhani, P. A. (2012). The treatment effect, the cross difference, and the interaction term in nonlinear ‘difference-in-differences’ models. Economics Letters 115, 85 – 87.
Rabby, F. and W. M. Rodgers (2010). The impact of 9/11 and the London bombings on the employment and earnings of UK Muslims. Discussion Paper 4763, IZA.
Ratcliffe, A. and S. von Hinke Kessler Scholder (2015). The London bombings and racial prejudice: Evidence from housing and labour markets. Economic Inquiry 53, 276–293.
Romanov, D., A. Zussman, and N. Zussman (2012). Does terrorism demoralize? Evidence from Israel. Economica 79, 183198.
Sander, J. B. and C. A. McCarty (2005). Youth depression in the family context: Familial risk factors and models of treatment. Clinical Child and Family Psychology Review 8(3), 203–219.
Shields, M. A. and A. Wailoo (2002). Exploring the determinants of unhappiness for ethnic minority men in Britain. Scottish Journal of Political Economy 49(4), 445–466.
Smith, J. P. and G. C. Smith (2010). Long-term economic costs of psychological problems during childhood. Social Science & Medicine 71(1), 110 – 115.
Stevenson, B. and J. Wolfers (2012). Subjective and objective indicators of racial progress. The Journal of Legal Studies 41(2), 459 – 493.
Thoits, P. A. (2010). Stress and health: Major findings and policy implications. Journal of Health and Social Behavior 51, S41–S53.
Tran, A. G. (2014). Family contexts: Parental experiences of discrimination and child mental health. American Journal of Community Psychology 53(1-2), 37–46.
Williams, D. R. and S. A. Mohammed (2009). Discrimination and racial disparities in health: Evidence and needed research. Journal of Behavioral Medicine 32(1), 20–47.
Wolfers, J. (2003). Is Business Cycle Volatility Costly? Evidence from Surveys of Subjective Well-Being. International Finance 6(1), 1–26.
Tables and figures
[image:23.595.201.401.386.567.2]Figure 1: The average happiness score across Muslims and Non-Muslims
Table 1: Characteristics of Muslims and non-Muslims interviewed May-July 2005
Muslims Non-Muslims Muslims Non-Muslims All All May-June July May-June July
(1) (2) (3) (4) (5) (6)
Happiness: Much less than usual 0.03 0.03 0.02 0.04 0.03 0.03
Std. dev. 0.17 0.18 0.16 0.19 0.17 0.18
Happiness: Less so than usual 0.08 0.08 0.07 0.09 0.08 0.08
Std. dev. 0.27 0.28 0.26 0.28 0.28 0.27
Happiness: About the same as usual 0.55 0.62 0.56 0.54 0.62 0.61
Std. dev. 0.50 0.49 0.50 0.50 0.48 0.49
Happiness: More so than usual 0.34 0.26 0.34 0.34 0.26 0.27
Std. dev. 0.47 0.44 0.48 0.47 0.44 0.45
Happiness score 3.21 3.12 3.22 3.18 3.11 3.13
Std. dev. 0.70 0.68 0.69 0.74 0.68 0.69
Depression: Not at all 0.51 0.43 0.51 0.50 0.43 0.43
Std. dev. 0.50 0.49 0.50 0.50 0.49 0.50
Depression: No more than usual 0.29 0.33 0.28 0.29 0.33 0.32
Std. dev. 0.45 0.47 0.45 0.45 0.47 0.47
Depression: Rather more than usual 0.12 0.16 0.13 0.11 0.15 0.16
Std. dev. 0.33 0.36 0.34 0.32 0.36 0.37
Depression: Much more than usual 0.08 0.09 0.08 0.09 0.09 0.09
Std. dev. 0.28 0.28 0.27 0.29 0.28 0.28
Depression score 1.78 1.90 1.77 1.80 1.91 1.90
Std. dev. 0.96 0.96 0.95 0.98 0.96 0.97
Asian male 0.40 0.03 0.39 0.41 0.03 0.03
Std. dev. 0.49 0.17 0.49 0.49 0.18 0.16
Black male 0.03 0.03 0.03 0.03 0.03 0.03
Std. dev. 0.17 0.17 0.17 0.17 0.16 0.18
Mixed/Other male 0.04 0.03 0.05 0.03 0.03 0.03
Std. dev. 0.21 0.18 0.22 0.17 0.18 0.18
White female 0.02 0.40 0.01 0.02 0.40 0.41
Std. dev. 0.12 0.49 0.12 0.13 0.49 0.49
Asian female 0.42 0.03 0.40 0.45 0.03 0.02
Std. dev. 0.49 0.17 0.49 0.50 0.18 0.13
Black female 0.03 0.03 0.03 0.02 0.03 0.03
Std. dev. 0.17 0.17 0.18 0.14 0.16 0.18
Mixed/Other female 0.05 0.04 0.06 0.03 0.03 0.04
Std. dev. 0.22 0.19 0.24 0.17 0.18 0.20
Age in months/10 18.35 18.33 18.30 18.45 18.30 18.43
Std. dev. 0.35 0.36 0.34 0.35 0.35 0.35
Paid work in term-time (2004) 0.04 0.23 0.04 0.05 0.23 0.22
Table 1 –Continued from previous page
Muslims Non-Muslims Muslims Non-Muslims All All May-June July May-June July
(1) (2) (3) (4) (5) (6)
Std. dev. 0.20 0.42 0.20 0.21 0.42 0.41
Receives pocket money (2004) 0.82 0.81 0.84 0.79 0.81 0.81
Std. dev. 0.38 0.39 0.37 0.40 0.39 0.39
Postive schooling attitude (2004) 32.98 30.94 33.17 32.64 30.96 30.87
Std. dev. 5.81 6.64 5.91 5.62 6.60 6.75
Plans further education (2004) 0.93 0.81 0.93 0.93 0.81 0.80
Std. dev. 0.25 0.39 0.26 0.25 0.39 0.40
Raising a family important (2004) 0.67 0.55 0.69 0.64 0.55 0.55
Std. dev. 0.47 0.50 0.46 0.48 0.50 0.50
Household head aged<40 0.17 0.21 0.18 0.16 0.21 0.21
Std. dev. 0.38 0.41 0.38 0.37 0.41 0.41
Lone-parent family 0.20 0.23 0.20 0.19 0.23 0.23
Std. dev. 0.40 0.42 0.40 0.39 0.42 0.42
Nominated second parent not interviewed 0.14 0.09 0.14 0.14 0.09 0.09
Std. dev. 0.34 0.28 0.34 0.35 0.28 0.28
ln(siblings+1) 1.27 0.79 1.26 1.29 0.79 0.79
Std. dev. 0.44 0.42 0.44 0.44 0.42 0.43
Parental knowledge of school day (2004) 0.39 0.45 0.39 0.38 0.44 0.47
Std. dev. 0.49 0.50 0.49 0.49 0.50 0.50
Parental knowledge of where going (2004) 4.62 4.52 4.65 4.56 4.52 4.52
Std. dev. 0.79 0.77 0.76 0.83 0.76 0.80
Family outings (2004) 4.81 4.80 4.77 4.88 4.80 4.81
Std. dev. 1.39 1.25 1.43 1.33 1.26 1.24
Household head has degree 0.07 0.14 0.07 0.08 0.14 0.13
Std. dev. 0.26 0.34 0.26 0.27 0.35 0.34
Household head works 0.49 0.83 0.50 0.47 0.83 0.82
Std. dev. 0.50 0.38 0.50 0.50 0.38 0.38
Homeowner 0.59 0.74 0.58 0.60 0.75 0.73
Std. dev. 0.49 0.44 0.49 0.49 0.44 0.44
Household wage income≥£41 000 0.02 0.21 0.03 0.02 0.21 0.21
Std. dev. 0.15 0.41 0.16 0.13 0.41 0.40
Weekly benefit amount£30-39 0.09 0.25 0.10 0.08 0.25 0.25
Std. dev. 0.29 0.43 0.30 0.27 0.43 0.44
Weekly benefit amount£40-99 0.31 0.33 0.31 0.32 0.33 0.30
Std. dev. 0.46 0.47 0.46 0.47 0.47 0.46
Weekly benefit amount£100+ 0.51 0.24 0.50 0.51 0.24 0.23
Std. dev. 0.50 0.42 0.50 0.50 0.43 0.42
Receives Working Tax Credit 0.23 0.24 0.24 0.22 0.24 0.24
Std. dev. 0.42 0.42 0.43 0.41 0.42 0.43
Receives Income Support 0.36 0.10 0.35 0.38 0.10 0.11
Std. dev. 0.48 0.31 0.48 0.49 0.30 0.32
Table 1 –Continued from previous page
Muslims Non-Muslims Muslims Non-Muslims All All May-June July May-June July
(1) (2) (3) (4) (5) (6)
Financial difficulties (2004) 0.16 0.06 0.15 0.19 0.05 0.06
Std. dev. 0.37 0.23 0.35 0.40 0.22 0.25
Northern England 0.36 0.28 0.37 0.36 0.27 0.33
Std. dev. 0.48 0.45 0.48 0.48 0.44 0.47
Central England 0.23 0.32 0.22 0.24 0.33 0.30
Std. dev. 0.42 0.47 0.41 0.43 0.47 0.46
Table 2: Difference-in-differences
Muslim Asian Muslim and Asian All (1) Boys (2) Girls (3) All (4) Boys (5) Girls (6) All (7) Boys (8) Girls (9)
Panel A: Happiness
AT ETP1: Much less than usual 0.02* -0.00 0.04** 0.01 -0.00 0.02 0.01 -0.01 0.03**
(0.01) (0.01) (0.02) (0.01) (0.01) (0.01) (0.01) (0.01) (0.02)
AT ETP2: Less so than usual 0.03* 0.03 0.03 0.02 0.00 0.03 0.03* 0.02 0.04
(0.01) (0.02) (0.02) (0.01) (0.01) (0.02) (0.01) (0.02) (0.02)
AT ETP3: About the same as usual -0.04 -0.10** 0.00 -0.03 -0.05 -0.00 -0.04 -0.08 -0.01
(0.03) (0.05) (0.03) (0.03) (0.05) (0.03) (0.03) (0.05) (0.04)
AT ETP4: More so than usual 0.00 0.07 -0.06 -0.00 0.05 -0.05 0.00 0.07 -0.06
(0.03) (0.05) (0.04) (0.03) (0.05) (0.04) (0.04) (0.06) (0.04)
AT ETY (ordered probit) -0.05 0.06 -0.16** -0.04 0.04 -0.13** -0.05 0.06 -0.17**
(0.05) (0.07) (0.06) (0.05) (0.06) (0.06) (0.05) (0.07) (0.07)
AT ETY (linear regression) -0.05 0.07 -0.16** -0.03 0.05 -0.12** -0.04 0.08 -0.16**
(0.05) (0.07) (0.06) (0.05) (0.06) (0.06) (0.05) (0.07) (0.07)
Panel B: Depression
AT ETP1: Not at all 0.01 0.02 0.00 0.03 0.02 0.04 0.01 0.02 0.00
(0.03) (0.05) (0.04) (0.03) (0.04) (0.04) (0.04) (0.05) (0.04)
AT ETP2: No more than usual -0.02 -0.05 0.02 -0.04 -0.05 -0.02 -0.03 -0.06 -0.00
(0.03) (0.04) (0.03) (0.02) (0.04) (0.03) (0.03) (0.04) (0.03)
AT ETP3: Rather more than usual -0.02 0.03 -0.06*** -0.01 0.03 -0.05** -0.01 0.04 -0.05*
(0.02) (0.02) (0.02) (0.02) (0.02) (0.02) (0.02) (0.02) (0.03)
AT ETP4: Much more than usual 0.03* 0.01 0.04 0.02 -0.00 0.03 0.03* 0.00 0.05
(0.02) (0.01) (0.03) (0.02) (0.01) (0.03) (0.02) (0.01) (0.03)
AT ETY (ordered probit) 0.03 0.02 0.02 -0.01 -0.00 -0.02 0.05 0.03 0.05
(0.06) (0.08) (0.10) (0.06) (0.07) (0.09) (0.07) (0.08) (0.10)
AT ETY (linear regression) 0.01 0.01 0.01 -0.01 -0.01 -0.02 0.04 0.02 0.05
(0.06) (0.08) (0.10) (0.06) (0.07) (0.09) (0.07) (0.09) (0.11) Notes: An ordered probit model first estimates the predicted probabilities based on the sample of treated and control persons, and these estimates are used to calculateAT ETPkandAT ETY (see equations 9 and 10 respectively) for the treated sample. Standard
[image:26.595.71.539.286.602.2]