This is a repository copy of The influence of tennis court surfaces on player perceptions and biomechanical response..
White Rose Research Online URL for this paper: http://eprints.whiterose.ac.uk/97527/
Version: Accepted Version
Article:
Starbuck, C., Damm, L., Clarke, J. et al. (5 more authors) (2015) The influence of tennis court surfaces on player perceptions and biomechanical response. Journal of Sports Sciences, 34 (17). pp. 1627-1636. ISSN 0264-0414
https://doi.org/10.1080/02640414.2015.1127988
eprints@whiterose.ac.uk https://eprints.whiterose.ac.uk/ Reuse
Unless indicated otherwise, fulltext items are protected by copyright with all rights reserved. The copyright exception in section 29 of the Copyright, Designs and Patents Act 1988 allows the making of a single copy solely for the purpose of non-commercial research or private study within the limits of fair dealing. The publisher or other rights-holder may allow further reproduction and re-use of this version - refer to the White Rose Research Online record for this item. Where records identify the publisher as the copyright holder, users can verify any specific terms of use on the publisher’s website.
Takedown
If you consider content in White Rose Research Online to be in breach of UK law, please notify us by
1
T
HEI
NFLUENCE OFT
ENNISC
OURTS
URFACES ONP
LAYERP
ERCEPTIONS 1AND
B
IOMECHANICALR
ESPONSE 2This is an Accepted Manuscript of an article published by Taylor & Francis in Journal of 3
Sports Sciences, available online: 4
http://www.tandfonline.com/doi/full/10.1080/02640414.2015.1127988
5
6
Authors: 1,2Chelsea Starbuck, 2Loïc Damm, 3James Clarke, 3Matt Carré, 4Jamie Capel-Davis, 7
4
Stuart Miller, 1Victoria Stiles and 1Sharon Dixon 8
1
Sport and Health Sciences, University of St Mark and St John, Plymouth, PL6 8BH 9
2
Exeter Biomechanics Team, Sport and Health Sciences, University of Exeter, St Lukes 10
campus, EX1 2LU, UK. 11
3
Sports Engineering Research Group, University of Sheffield, Department of Mechanical 12
Engineering, Mappin Street, Sheffield, S1 3JD, UK. 13
4
International Tennis Federation, Bank Lane, London, SW15 5XZ 14
Corresponding author: Chelsea Starbuck 15
Address for corresponding author: Chelsea Starbuck, Sport and Health Sciences, University 16
of St Mark and St John, Derriford Road, Plymouth, PL6 8BH, UK. 17
Email: cstarbuck@marjon.ac.uk 18
Tel: +44 (0)1752 636700 (Ext. 5639) 19
Acknowledgements: 20
The authors would like to thank the International Tennis Federation and the Lawn Tennis 21
association for their support during the study. 22
23
Running title: Tennis player perceptions and player response
24
Key words: Playing experience, Turning, Pressure, Kinematics
2
A
BSTRACT1
This study aimed to examine player perceptions and biomechanical responses to tennis 2
surfaces and to evaluate the influence of prior clay court experience. Two groups with 3
different clay experiences (experience group, n=5 and low-experience group, n=5) performed 4
a 180o turning movement. Three-dimensional ankle and knee movements (50Hz), plantar 5
pressure of the turning step (100Hz) and perception data (visual analogue scale questionnaire) 6
were collected for two tennis courts (acrylic and clay). Greater initial knee flexion (acrylic 7
20. 8 ± 11.2o and clay 32.5 ± 9.4o) and a more upright position were reported on the clay 8
compared to the acrylic court (P<0.05). This suggests adaptations to increase player stability 9
on clay. Greater hallux pressures and lower midfoot pressures were observed on the clay 10
court, allowing for sliding whilst providing grip at the forefoot. Players with prior clay court 11
experience exhibited later peak knee flexion compared to those with low-experience. All 12
participants perceived the differences in surface properties between courts and thus 13
responded appropriately to these differences. The level of previous clay court experience did 14
not influence players’ perceptions of the surfaces; however, those with greater clay court 15
experience may reduce injury risk as a result of reduced loading through later peak knee 16
3
1. Introduction
1
Tennis surfaces, such as clay and acrylic courts, can differ greatly in mechanical properties 2
such as friction and hardness. These differences have been associated with changes in 3
performance as a result of altered movement patterns and styles of play (O'Donoghue & 4
Ingram, 2001; Reid et al., 2013). Compared with low friction surfaces, high friction surfaces 5
lead to kinematic adjustments (Farley, Glasheen, & McMahon, 1993; Dowling, Corazza, 6
Chaudhari, & Andriacchi, 2010), such as lower attack angles (measured to the horizontal), in 7
addition to faster running speeds and movements (Brechue, Mayhew, & Piper, 2005). Players 8
have been observed to accommodate to low friction surfaces such as clay through sliding 9
(Miller, 2006). 10
Lower injury rates have been reported on clay courts compared to acrylic hardcourts, 11
suggested to be a result of lower friction (Nigg & Segesser, 1988; Bastholt, 2000). Higher 12
friction surfaces, such as acrylic hardcourts, have been associated with high loading, 13
particularly on the lateral regions of the foot (Damm et al., 2014). This suggests the foot to be 14
in an inverted position. High levels of inversion (16o) have previously been linked to ankle 15
inversion injuries (Kristianslund, Bahr, & Krosshaug, 2011). When examining 180o turning 16
movement on a range of test surfaces (including wood, asphalt and synthetic rubber), 17
kinematic adjustments to the high friction surfaces included longer braking phases and 18
greater knee flexion (Durá, Hoyos, Martínez, & Lozano, 1999). These adjustment have been 19
suggested to contribute to the occurrence of patellofemoral pain (Chard & Lachmann, 1987; 20
Gecha & Torg, 1988; Damm et al., 2013), a commonly reported injury in tennis (Abrams, 21
Renstrom, & Safran, 2012). Alternatively, cutting tasks on high friction surfaces have been 22
reported to produce lower knee flexion angles resulting in an increased risk of anterior 23
4 Pressure insoles provide a tool to examine loading during on-court scenarios. The distribution 1
and the magnitude of force within foot regions have been suggested as good indicators of 2
injury risks compared to overall force magnitude (Willems et al., 2005; Girard, Eicher, 3
Fourchet, Micallef, & Millet, 2007; Stiles & Dixon, 2007; Damm et al., 2014). In tennis, 4
lower whole foot loads have been reported for clay courts compared with acrylic suggesting 5
lower risk of injury on the clay (Girard et al., 2007; Damm et al., 2012). Court surface types 6
have also been associated with different pressure distribution patterns (Girard et al., 2007; 7
Girard, Micallef, & Millet, 2010; Damm et al., 2012, 2014). Girard et al. (2007) reported 8
greater midfoot and hallux pressures on an acrylic court compared to a clay court during 9
tennis specific movements and associated these greater pressures with greater injury risk on 10
the acrylic court. 11
Mechanical tests measure surface properties, yet due to players’ ability to adapt to different 12
properties through biomechanical adjustments mechanical tests are unable to replicate players 13
experiences of tennis surfaces (Ferris, Liang, & Farley, 1999; Dixon, Collop, & Batt, 2000; 14
Damm et al., 2013). Perceptions have been suggested to be an important link between 15
mechanical properties and player biomechanics (Fleming, Young, Roberts, Jones, & Dixon, 16
2005). Perceptions can provide information on humans’ ability to identify and respond to 17
their environment (Milani, Hennig, & Lafortune, 1997; Stiles & Dixon, 2007). Previous 18
experience and sensory information are combined to formulate perceptions and enable 19
humans to interact successfully within their environment (Coren, Porac, & Ward, 1979; 20
Sherwood, 1993). Studies of sports surfaces have mainly focused on perceptions of hardness 21
and grip, whilst Fleming et al. (2005) identified other perceptions such as surface 22
abrasiveness to be important, following interviews with 22 hockey players. Therefore further 23
research is required to examine additional perception parameters of court surfaces to provide 24
5 Greater understanding of tennis players’ perceptions and biomechanical response could also 1
enable the development of mechanical tests to better characterise court surface properties. 2
In addition to influencing perceptions, previous experience can alter human response to 3
surface conditions (Coren et al., 1979; Chiou, Bhattacharya, & Succop, 2000; Heiden, 4
Sanderson, Inglis, & Siegmund, 2006). It has previously been observed that prior experience 5
and awareness of slippery surfaces results in the adoption of a cautious gait (greater initial 6
knee flexion), leading to reduced GRF and increased muscle activity during walking (Heiden 7
et al., 2006). Heiden et al. (2006) examined walking, whilst there has been no research 8
examining the influence of previous experience of surface conditions during sport-specific 9
movements such as turning. 10
This study aims to examine the influence of changes in tennis surface upon perceptions and 11
biomechanical variables to better understand the influence of perceptions upon factors 12
associated with increased injury risk and to enable future development of mechanical tests. 13
Based on literature evidence, it was anticipated that tennis court properties would influence 14
tennis players’ perceptions and biomechanical response. Specifically, it was hypothesised that 15
players would perceive greater hardness on the acrylic court as a result of greater peak heel 16
pressures. Lower perceptions of grip on the clay court would be observed alongside greater 17
initial knee flexion associated with reduced ACL injury risk. The study also aimed to 18
evaluate the influence of previous experience of clay courts upon perceptions and 19
biomechanics. It was hypothesised that those with prior experience of clay courts would 20
6
2. Methods
1
2.1 Participant Information 2
Ten tennis players (Lawn Tennis Association (LTA) rating 3.6 ± 1.3), volunteered to 3
participate in the current study. Players were grouped into two groups according to their 4
experience with playing on clay courts. These groupings were determined by questionnaire 5
where those who rated their experience on clay as high or above (defined as once a month or 6
more) were selected for the experienced group (n = 5, LTA rating 3.0 ± 1.6, age 28.0 ± 5.1 7
years, height 1.8 ± 0.1 m and weight 75.0 ± 14.3 kg), whereas those who rated no to moderate 8
experience (once a year or less) formed the low-experience group (n=5, LTA rating 3.8 ± 1.1, 9
age 26.0 ±1.3 years, height 1.7 ± 0.1 m and 65.8 ± 12.8 kg). No statistical differences (using 10
independent t-tests) in LTA ratings and anthropometric data were observed between groups. 11
The study was approved by the Institutional Ethics Committee and informed consent was 12
obtained before testing. 13
Participants were required to perform 10 x 180o turns on two tennis courts (GreenSet Grand 14
Prix Acrylic laid directly on asphalt and Northern European Clay, order randomly assigned) 15
at the National Tennis Centre (NTC), London. Participants ran 5.5 m along the baseline 16
through timing gates placed 3 m apart at a speed of 3.9 ± 0.20 m.s-1 before performing the 17
turn. Participants wore the same shoes on both tennis courts (adidas Barricade 6.0 clay court 18
shoes with a v-shaped tread pattern) and were given adequate time to habituate themselves 19
with the court and movement before testing. 20
2.2 Mechanical data 21
Mechanical tests were conducted to provide details of surface properties for each tennis court. 22
A pendulum test (Slip resistance test, ITF CS 02/01) was conducted to provide a measure of 23
7 has previously been used to examine surface friction on clay and acrylic tennis courts (Miller 1
& Capel-Davies, 2006; Damm et al., 2013; Damm et al., 2014). The pendulum test was 2
conducted on five different locations on the baseline of the court. Eight repeats were 3
conducted at each location with the first three repeats being disregarded. Therefore five valid 4
repeats were collected in five locations along the baseline of each court. The Crab III device 5
(developed by the ITF; (Miller & Capel-Davies, 2006) was used to obtain a measure of static 6
translational friction. Data were collected from ten separate locations around the baseline area 7
of each tennis court. Making consistent measurements on the clay court proved challenging 8
with both friction test devices as the surface particles were disturbed between trials, therefore 9
reducing the validity of the test devices. 10
Mechanical hardness and stiffness were measured using the SERG impact hammer, first 11
described by Carré et al., (2006). To simulate actual conditions and to prevent damage to the 12
tennis courts, an outsole of a tennis shoe was attached onto the rigid steel hammer, which has 13
previously been successful in comparing impact characteristics of tennis surfaces (Yang, 14
2010). Peak force was measured during impact with the surface to indicate differences in 15
surface hardness. Average stiffness was reported as the ratio of the peak force and the related 16
displacement. The SERG impact hammer test was conducted on ten separate locations in the 17
baseline area of the court. 18
2.3 Perception data 19
A short questionnaire comprising of five visual analogue scales (VAS; Figure 1) was used to 20
collect perception data following play on each court (Starbuck, 2015). These scales were 100 21
mm in length with two descriptive end phrases, formulated from parameters and language 22
identified in previous qualitative pilot work. Perception parameters included perceived 23
8 ****Figure 1 near here****
1
2.4 Kinematic data 2
Kinematic data were collected using three video cameras (Sony HDV 1080i mini DV). The 3
video data were then de-interlaced to provide a sampling frequency of 50 Hz with images of 4
720p. Event synchronisation of LED lights were used to synchronise the cameras with a 5
maximum error of 0.02 s. Direct linear transformations (DLT) using Vicon Motus (v9.2) 6
software reconstructed 3-dimensional coordinates from the 2-dimensional digitised 7
coordinates of each camera (Abel-Aziz & Karara, 1971). Reconstruction errors, calculated 8
using Root Mean Square Error (RMSE) of four known markers, were no larger than 0.01 m 9
in the x, y and z direction. Eleven markers (Figure 2) were placed upon the lower limb of the 10
dominant leg, enabling increased accuracy and reliability of manual digitisation as well as 11
defining the joint coordinate systems adapted from (Grood & Suntay, 1983; Soutas-Little, 12
Beavis, Verstraete, & Markus, 1987). The 3-dimensional lower limb coordinates were filtered 13
using a recursive 2nd order Butterworth filter, with an optimum cut off frequency (range of 4-14
8 Hz) for each coordinate determined using residual analysis . 15
***Figure 2 near here*** 16
Rotations about the ankle and knee joint centres were determined using a custom written 17
Matlab code (2011b, MathsWorks.). All kinematic data were presented relative to a relaxed 18
standing trial. Kinematic variables included initial and peak inversion angles, initial ankle 19
flexion and peak dorsi flexion angles and initial and peak knee flexion angles. Occurrence 20
times of peak angles were reported relative to heel contact. Sliding distance was calculated 21
9 at impact was defined as the angle between the xy plane and the calcaneus to hip vector. 1
Estimated errors for all angles were less than 1o. 2
2.5 Pressure data 3
**** Figure 3 near here**** 4
Pressure insoles (Pedar, Novel, GmbH, Munich) were used to obtain pressure data at 100 Hz 5
for the turning step. Eight masks, as previously used by Damm et al. (2012), allowed for a 6
detailed analysis of plantar foot sections (Figure 3), which included the lateral and medial 7
heel, midfoot and forefoot and the hallux and lesser toes. Variables for both whole foot and 8
foot regions included mean and maximum pressures, peak impact and active forces, peak and 9
average loading rates, and impulse. Occurrence times of peak impact and active forces and 10
maximum pressures were also identified. To ensure an accurate assessment, a drift correction, 11
recommended by Hurkmans et al. (2006), was implemented for the pressure data. 2.6 12
Statistical Analysis 13
Comparisons between the clay experience groups and the surfaces were examined for 14
kinematic and perception data using a two-way ANOVA with repeated measures, with 15
Bonferonni’s corrected alpha post hoc analysis. Standardised effect sizes (ES) were 16
calculated using partial Eta2 to provide the degree to which the differences were present 17
(Cohen, 1977). ES were presented for either differences between groups and within groups 18
(court differences) when significance was observed for these effects. Some trials from the 19
pressure data were omitted due to a failed wireless transmission, resulting in data for only 20
four participants in the low-experience group and three participants in the experienced group, 21
meaning group comparisons could not be made for pressure variables. Therefore a paired t-22
10 courts. Statistical analysis was conducted using SPSS (v.19) software. An alpha level of less 1
than 0.05 determined significance. 2
3. Results
3
3.1 Mechanical Data 4
****Table 1 near here**** 5
The clay court had lower static and dynamic coefficients of friction compared to the acrylic 6
court (Table 1). Peak force measured by the SERG impact hammer was greater on the 7
acrylic court compared to the clay court, indicating greater hardness of the acrylic court 8
(Clarke, Carré, Damm, & Dixon, 2013). Stiffness was also measured by the SERG impact 9
hammer and was greater on the acrylic court compared to the clay court (P < 0.05). 10
3.2 Tennis Court Differences 11
****Figure 4 near here**** 12
The analysis revealed differences between tennis courts for all perception parameters (Figure 13
4). The acrylic court was rated to be more predictable, have more grip, greater hardness and 14
was harder to slide on when compared with the clay court. However, the clay court was 15
perceived to be harder to change direction compared to the acrylic court. 16
Sliding distances were greater (ES = 0.598, P < 0.05) on the clay court (0.66 ± 0.40 m) 17
compared to the acrylic court (0.35 ± 0.04 m). Ground contact time (ES = 0.838, P < 0.05) 18
was longer on the clay court (0.54 ± 0.11 s) compared to the acrylic court (0.35 ± 0.04 s). 19
Represented schematically (Figure 5), initial attack angle was higher on the clay court (74.4 20
± 6.1o) compared to the acrylic court (64.8 ± 5.3o, ES = 0.572, P < 0.05). Greater initial knee 21
11 compared to the acrylic court (20.8 ± 11.2o, P < 0.05). No court differences occurred for peak 1
ankle dorsi flexion angle. However, later peak dorsi flexion (ES = 0.694, P < 0.05) occurred 2
on the clay court (0.28 ± 0.10 s) compared to the acrylic court (0.16 ± 0.10 s). 3
****Figure 5 near here**** 4
****Table 2 near here**** 5
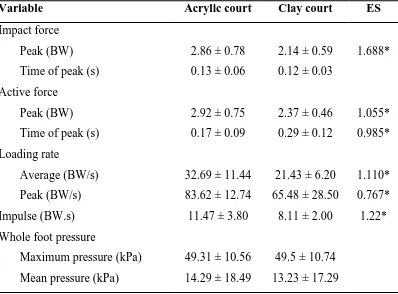
The acrylic court produced (P < 0.05) greater peak impact forces, peak active forces, average 6
loading rates, peak loading rates and impulse compared to the clay court (Table 3). Peak 7
active force occurred earlier on the acrylic compared to the clay court. No differences 8
between the tennis courts were identified for whole foot mean and maximum pressures. 9
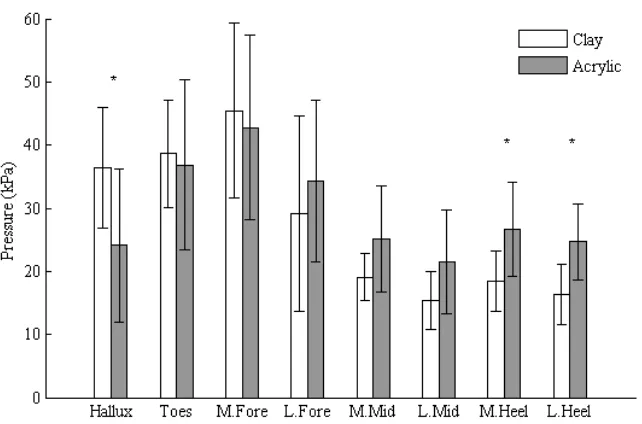
****Table 3 near here**** 10
Greater maximum pressure in the hallux region (ES = 1.73, P < 0.05; Figure 6) occurred on 11
the clay (36.40 ± 9.64 kPa) compared to the acrylic court (24.14 ± 12.13 kPa). Differences 12
between the courts were detected for the maximum pressures at the lateral (ES = 1.06, P < 13
0.05) and medial heel regions (ES = 1.49, P < 0.05). Lower maximum heel pressures were 14
produced on the clay court (lateral = 18.36 ± 4.77 kPa and medial = 16.39 ± 4.77 kPa) 15
compared to the acrylic court (lateral = 26.57 ± 7.45 kPa and medial = 24.68 ± 6.88 kPa). 16
Lower mean (Figure 7) lateral midfoot pressures (ES = 0.334, P < 0.05) were revealed on the 17
clay court (3.83 ± 4.41 kPa) compared to the acrylic court (4.98 ± 4.92 kPa). 18
12 3.3 The Influence of Previous Clay Court Experience on Perceptions and Biomechanical 1
Response 2
All perception parameters except players’ perceived ability to change direction were similar 3
between experience groups. The experience group perceived it easier (33.7%) to change 4
direction compared to the low-experience group (P < 0.05) irrespective of tennis court. The 5
experience group (0.26 ± 0.03 s) produced later peak knee flexion (ES = 0.456, P < 0.05) 6
compared to the low-experience group (0.14 ± 0.03 s). An interaction between group and 7
court was revealed (ES = 0.562 P < 0.05) for initial ankle flexion angle. Post hoc analysis 8
indicated differences between tennis courts for the experienced group but no differences for 9
the low-experience group. At impact, the experienced group were plantar flexed on clay (7.7 10
± 9.4o), whilst this group were neutral or slightly dorsi-flexed on the acrylic court (-2.5 ± 11
7.5o). 12
4. Discussion
13
The main purpose of this study was to examine tennis players’ perceptions and 14
biomechanical response on two tennis court surfaces with distinct cushioning and friction 15
properties – an acrylic court and a clay court. A second aim was to investigate the influence 16
of previous clay court experience on player perceptions and response. Court differences in 17
player perceptions and response were observed, whilst group differences only occurred in 18
tennis players’ biomechanical responses and perception of ability to turn on the surfaces. 19
4.1 Player Perceptions of Tennis Courts 20
Players’ perceptions of the courts inform their response to mechanical differences between 21
surfaces (Milani et al., 1997), therefore measuring perceptions can provide an insight into 22
how tennis players differentiate between court surfaces (Fleming et al., 2005). Similar to 23
13 study revealed differences in perception of the two tennis courts, which corresponded to 1
differences in mechanical data. For instance, the acrylic court, which was mechanically 2
harder and had greater friction, was perceived to be harder and resulted in greater perceptions 3
of grip compared to the clay court. Unlike previous reports, this study examined additional 4
perceptions such as perceived predictability and perceived ability to change direction and 5
slide. Perceived predictability was lower on the low friction surface which was also perceived 6
to be easier to slide on yet difficult to change direction. These additional perception measures 7
provided further information regarding player perception of tennis courts which could alter 8
players’ response to the surface, thus influencing injury risks and style of play. Results in this 9
study suggest that the mechanical tests of hardness and friction that were used provided 10
information regarding player perceptions of friction and hardness, yet other perceptions of the 11
surface, such as predictability, were identified and should be considered during the future 12
development of mechanical tests. 13
When developing mechanical tests and characterising tennis court surfaces the collection of 14
perceptions provides an indication of how players’ respond to surfaces. Therefore perceptions 15
may reveal associations with biomechanical variables associated with increased injury risk. 16
Measuring perception provides further information regarding players experience of the 17
surface which can supplement mechanical measures but also aid in the development of new 18
mechanical tests (Fleming et al., 2005). This study identified differences in players’ 19
perceptions of their ability to perform tasks such as sliding and changing direction between 20
court surf aces which could influence their biomechanical response. Therefore it is 21
recommended that future development of mechanical tests should attempt to replicate sliding 22
and changing of direction type movements, with the use of biomechanical data such as 23
14 4.2 Player Response to Tennis Court Differences
1
Longer braking has previously been associated with high friction surfaces and has been 2
suggested to be an attempt to reduce high loading (Durá et al., 1999). In contrast, the current 3
study reported longer braking on the low friction clay court, observed through later peak 4
active force and ankle dorsi flexion. These differences were attributed to longer contact times 5
as a result of sliding on the court, unlike previous comparisons where sliding was not 6
reported (Durá et al., 1999). The lower loading measured on the clay court compared with the 7
acrylic is attributed to sliding on this court surface, and provides a suggested explanation for 8
the lower injury incidences previously reported on lower friction tennis courts such as clay, in 9
comparison to high friction acrylic courts (Nigg & Segesser, 1988; Bastholt, 2000). 10
Sliding in tennis can be beneficial by allowing braking to occur during stroke production thus 11
allowing players to prepare for the next stroke immediately after ball strike making for a 12
more efficient movement (Miller, 2006; Pavailler & Horvais, 2015). As a result of sliding on 13
clay it was apparent that an altered turning technique (e.g. differences in initial knee flexion, 14
attack angle, pressure distribution) occurred compared to the acrylic court where no sliding 15
was observed, as hypothesised. This study revealed greater knee flexion at ground contact 16
and reduced GRF on clay, both of which have been associated with improved stability on low 17
friction surfaces during walking (Heiden et al., 2006). Flexion at the knee has previously 18
been suggested to improve stability through lowering the COM closer to the base of support 19
(Cham & Redfern, 2002; Marigold & Patla, 2002). High knee flexion during cutting 20
movements has also been suggested to reduce risk of ACL injuries on low friction surfaces 21
(Dowling et al., 2010). Thus the more extended knee at initial ground contact on the acrylic 22
court observed in the current study may increase risk of ACL injuries when performing on 23
15 Participants approach to the clay court was consistent with results previously reported from 1
walking studies (Heiden et al., 2006). Greater attack angle on the clay suggests a more 2
upright position at ground contact. A more upright attack angle has previously been 3
associated with an anterior COM shift, suggested to improve stability (Clark & Higham, 4
2011) in addition to lower COM through greater knee flexion. In contrast to the clay court, all 5
players had a more aggressive approach through lower attack angle on the acrylic court. This 6
aggressive approach observed on the acrylic court agrees with findings reported by Girard et 7
al. (2007) and reflects the explosive playing style often observed on acrylic courts 8
(O'Donoghue & Ingram, 2001). 9
Unlike previous reports, where greater whole foot mean and maximum pressures on acrylic 10
courts compared to clay courts have been reported (Girard et al., 2007; Damm et al., 2012), 11
few differences were obtained between the acrylic and clay courts. Findings from this study 12
were similar to those reported during walking where altered pressure distributions between 13
surfaces accounted for a lack of whole foot pressure differences (Fong, Mao, Li, & Hong, 14
2008). The greater pressures in the hallux area observed on the clay court compared to the 15
acrylic court suggest increased grip needed to turn on the lower friction surface, which is 16
similar to Fong et al. (2008) who suggested that greater toe grip and lower heel pressures 17
provided balance and grip during walking on slippery surfaces. Players ability to increase 18
grip on the low friction clay court through greater hallux pressures may increase risk of 19
tendinopathy of the flexor halluces longus, which develops during repetitive loading in the 20
big toe area (Trepman, Mizel, & Newberg, 1995; Lynch & Renström, 2002). In agreement 21
with Damm et al. (2014), greater lateral pressures at the heel, midfoot and forefoot were 22
reported on the acrylic court suggesting a more inverted foot position which has previously 23
16 In contrast to Girard et al. (2007), the current study reported lower midfoot pressures on the 1
clay court compared to the acrylic court. This response has been suggested to facilitate 2
sliding on this type of surface by limiting areas of high pressure to prevent ‘sticking’ (Damm 3
et al., 2012). Girard et al. (2007) reported higher midfoot loading on clay compared with 4
acrylic hardcourt, suggesting this permitted controlled sliding. Additionally, Girard et al. 5
(2007) reported higher hallux pressures on acrylic attributed to a more aggressive play 6
possibly as a result of greater friction. The findings reported in the current study differed to 7
those reported by Girard et al. (2007), likely due to the different methods of analysing 8
pressure data. Girard et al. (2007) examined the global effect of playing surface on pressure 9
during two movements, serve and volley and baseline movements, therefore combining 10
pressure distributions from multiple steps which consisted of accelerations, running and 11
cutting which differ in pressure distribution patterns (Orendurff et al., 2008). Girard et al. 12
(2007) collected data during whole tennis strategies (e.g. serve and volley) whilst this study 13
specifically examined the turning step. Examining pressure distribution during individual 14
steps rather than multiple steps allows mire detailed understanding of surfaces affects and the 15
specific implications regarding injury risks. 16
4.3 The Influence of Previous Clay Court Experience on Perceptions and Biomechanical 17
Response 18
Despite evidence that previous experiences combined with sensory information are used to 19
formulate perceptions (Coren et al., 1979; Gescheider & Bolanowski, 1991; Goldstein, 1999), 20
when examining the influence of prior clay court experience on perceptions of tennis courts 21
few differences were reported between experience groups. This lack of difference in surface 22
perceptions was likely influenced by the familiarisation given to the participants prior to data 23
17 felt necessary for safety reasons, but may have limited the ability to detect differences 1
between experience groups. 2
It was hypothesised that those with prior experience of clay courts would adapt to increase 3
stability through reduced GRF and further increases in initial knee flexion compared to the 4
low-experience group. However, findings from the current study failed to support this 5
hypothesis. The lack of agreement with previous literature is most likely due to the nature of 6
the population and the movement. Previous literature has focused on walking (Heiden et al., 7
2006), whilst the current study examined a more dynamic movement. 8
Prior experience on clay produced further adaptions such as altered initial ankle flexion and 9
occurrence time of peak knee flexion which were not observed in the low-experience group. 10
In particular, the experience group were in a plantar flexed position at ground contact on the 11
clay yet slightly dorsi flexed on the acrylic; however, the low-experience group did not differ 12
in initial ankle flexion angle between courts. Those with prior experience on clay had later 13
peak knee flexion, suggesting that regular play on clay results in adaptations to reduce 14
loading through longer braking phases (Durá et al., 1999), potentially reducing injury risk on 15
certain tennis courts. These changes in response between the groups suggest that although 16
participants perceived similarly, experience leads to additional biomechanical responses to 17
surface manipulation. 18
5. Limitations
19
The use of on court analysis in this study was a limitation regarding reproducibility of the 20
tennis-specific movements. Yet, the benefits of an on court analysis using the tennis specific 21
drills provided realistic conditions which are often difficult to obtain in confined laboratory 22
18 reliable reproduction of the movement between trials, statistically differences between 1
surfaces were detected. 2
Low sampling frequency of kinematic (50 Hz) and pressure (100 Hz) data was a limiting 3
factor which increases synchronisation error within the data and reduces accuracy of temporal 4
data. In support of the data collected, values were similar to those reported in the literature. It 5
is possible that the presence of the pressure insoles within the footwear influenced 6
participants movement on the tennis court (Kong & De Heer, 2009). However, it was felt that 7
the data obtained through the use of these insoles was appropriate for obtaining on court 8
loading characteristics, and that the influence on footwear environment was small compared 9
with the large differences in surface characteristics. The Pedar system used for pressure data 10
collection (Pedar, Novel) has been suggested to be acceptably accurate and reliable (Godi, 11
Turcato, Schieppati, & Nardone, 2014; Price, Parker, & Nester, 2014). 12
The anchor words employed in the visual analogue scale, previously deemed a reliable 13
measure of perception (Mündermann, Nigg, Stefanyshyn, & Humble, 2002; Mills, Blanch, & 14
Vicenzino, 2010), may be interpreted differently by different people (Aitken, 1969). However 15
previous pilot work supported that face validity of the questionnaire was achieved, thus 16
minimising the ambiguity of the questionnaire (Starbuck, 2015). 17
6. Conclusions
18
Participants in this study were able to perceive differences between tennis courts and 19
produced altered biomechanical responses as a result of different surface properties. As 20
hypothesised, players perceived differences in perceived hardness and perceived grip 21
between the tennis courts, in agreement with the mechanical data collected. Evidence 22
suggests the inclusion of multiple perception measures such as perceived predictability and 23
19 tennis court surfaces. The use of perception and biomechanical data during on court analysis 1
could inform the development of mechanical tests to better replicate player experience. All 2
participants in the current study demonstrated adaptations consistent with providing improved 3
stability on the clay court during sliding, whilst those with greater experience on clay had 4
additional adaptations such as later knee flexion, reducing rate of loading and potentially 5
reducing injury risk. Previous experience does not appear to influence players’ perceptions of 6
tennis courts but provides information regarding an appropriate response. Although not 7
directly measured due to a failed wireless transmission, later occurrence of peak knee flexion 8
for the experienced group suggests lower GRF when compared to the low-experienced group, 9
as hypothesised. This evidence suggests that when on clay, players with high previous 10
experience are better able to accommodate to the court, through additional biomechanical 11
responses, highlighting the importance of court familiarisation. 12
7. References
13
Abel-Aziz, Y., & Karara, H. (1971). Direct linear transformation from comparator 14
coordinates into object space coordinates. Urbana, IL: American Society of 15
Photogrammetry, 1-18. 16
Abrams, G. D., Renstrom, P. A., & Safran, M. R. (2012). Epidemiology of musculoskeletal 17
injury in the tennis player. British Journal of Sports Medicine, 46(7), 492-498. 18
Aitken, R. (1969). Measurement of feelings using visual analogue scales. Proceedings of the 19
Royal Society of Medicine, 62(10), 989. 20
Bastholt, P. (2000). Professional tennis (ATP Tour) and number of medical treatments in 21
relation to type of surface. Medicine and Science in Tennis, 5(2). 22
Brechue, W. F., Mayhew, J. L., & Piper, F. C. (2005). Equipment and running surface alter 23
sprint performance of college football players. The Journal of Strength & 24
20 Carre, M., James, D., & Haake, S. (2006). Hybrid method for assessing the performance of 1
sports surfaces during ball impacts. Proceedings of the Institution of Mechanical 2
Engineers, Part L: Journal of Materials: Design and Applications, 220(1), 31-39. 3
Cham, R., & Redfern, M. S. (2002). Changes in gait when anticipating slippery floors. Gait 4
& Posture, 15(2), 159-171. 5
Chard, M. D., & Lachmann, S. M. (1987). Racquet sports--patterns of injury presenting to a 6
sports injury clinic. British Journal of Sports Medicine, 21(4), 150-153. 7
Chiou, S. Y., Bhattacharya, A., & Succop, P. A. (2000). Evaluation of workers' perceived 8
sense of slip and effect of prior knowledge of slipperiness during task performance on 9
slippery surfaces. American Industrial Hygiene Association Journal, 61(4), 492-500. 10
Clark, A. J., & Higham, T. E. (2011). Slipping, sliding and stability: locomotor strategies for 11
overcoming low-friction surfaces. The Journal of experimental biology, 214(8), 1369-12
1378. 13
Clarke, J., Carré, M. J., Damm, L., & Dixon, S. (2013). The development of an apparatus to 14
understand the traction developed at the shoe-surface interface in tennis. Proceedings 15
of the Institution of Mechanical Engineers, Part P: Journal of Sports Engineering and 16
Technology. 17
Cohen, J. (1977). Statistical power analysis for behavioral sciences (Revised ed.). London: 18
Academic Press. 19
Coren, S., Porac, C., & Ward, L. M. (1979). Sensation and Perception. London: Academic 20
Press. 21
Damm, L., Low, D., Richardson, A., Clarke, J., Carré, M., & Dixon, S. (2013). The effects of 22
surface traction characteristics on frictional demand and kinematics in tennis. Sports 23
Biomechanics, 12, 389-402. 24
Damm, L., Starbuck, C., Stocker, N., Clarke, J., Carré, M., & Dixon, S. (2012, 4th April ). 25
Plantar pressure depends on the playing surface in tennis. Paper presented at the 26
BASES Biomechanics Interest Group, University of Ulster. 27
Damm, L., Starbuck, C., Stocker, N., Clarke, J., Carré, M., & Dixon, S. (2014). Shoe-surface 28
friction in tennis: influence on plantar pressure and implications for injury. Footwear 29
21 Dixon, S. J., Collop, A. C., & Batt, M. E. (2000). Surface effects on ground reaction forces 1
and lower extremitykinematics in running. Medicine & Science in Sports & Exercise, 2
32, 1919-1926. 3
Dowling, A. V., Corazza, S., Chaudhari, A., & Andriacchi, T. (2010). Shoe-Surface Friction 4
Influences Movement Strategies During a Sidestep Cutting Task: Implications for 5
Anterior Cruciate Ligament Injury Risk. American Journal of Sports Medicine, 38(3), 6
478-485. 7
Durá, J. V., Hoyos, J. V., Martínez, A., & Lozano, L. (1999). The influence of friction on 8
sports surfaces in turning movements. Sports Engineering, 2(2), 97-102. 9
Farley, C. T., Glasheen, J., & McMahon, T. A. (1993). Running springs: speed and animal 10
size. The Journal of Experimental Biology, 185(1), 71-86. 11
Ferris, D. P., Liang, K., & Farley, C. T. (1999). Runners adjust leg stiffness for their first step 12
on a new running surface. Journal of Biomechanics, 32(8), 787-794. 13
Fleming, P., Young, C., Roberts, J., Jones, R., & Dixon, N. (2005). Human perceptions of 14
artificial surfaces for field hockey. Sports Engineering, 8(3), 121-136. 15
Fong, D., Mao, D., Li, J., & Hong, Y. (2008). Greater toe grip and gentler heel strike are the 16
strategies to adapt to slippery surface. Journal of Biomechanics, 41(4), 838-844. 17
Gecha, S., & Torg, E. (1988). Knee injuries in tennis. Clinics in sports medicine, 7(2), 435. 18
Gescheider, G. A., & Bolanowski, S. J. (1991). Final comments on ratio scaling of 19
psychological magnitudes. In G. A. Gescheider & S. J. Bolanowski (Eds.), Ratio 20
Scaling of Psychological Magnitude: In Honor of the Memory of S. S. Stevens. 21
Hillsdale, New Jersey: Lawerence Erlbaum Associates. 22
Girard, O., Eicher, F., Fourchet, F., Micallef, J. P., & Millet, G. P. (2007). Effects of the 23
playing surface on plantar pressures and potential injuries in tennis. British Journal of 24
Sports Medicine, 41(11), 733-738. 25
Girard, O., Micallef, J. P., & Millet, G. P. (2010). Effects of the Playing Surface on Plantar 26
Pressures During the First Serve in Tennis. International Journal of Sports Physiology 27
22 Godi, M., Turcato, A. M., Schieppati, M., & Nardone, A. (2014). Test-retest reliability of an 1
insole plantar pressure system to assess gait along linear and curved trajectories. 2
Journal of Neuroengineering and Rehabilitation, 11(95), 3-11. 3
Goldstein, B. (1999). Sensation and Perception (5th ed.). London: Brooks/Cole. 4
Grood, E. S., & Suntay, W. J. (1983). A joint coordinate system for the clinical description of 5
three-dimensional motions: application to the knee. Journal of Biomechanical 6
Engineering, 105, 136. 7
Heiden, T. L., Sanderson, D. J., Inglis, J. T., & Siegmund, G. P. (2006). Adaptations to 8
normal human gait on potentially slippery surfaces: The effects of awareness and 9
prior slip experience. Gait and Posture, 24(2), 237-246. 10
Hurkmans, H., Bussmann, J., Benda, E., Verhaar, J., & Stam, H. (2006). Accuracy and 11
repeatability of the Pedar Mobile system in long-term vertical force measurements. 12
Gait & Posture, 23(1), 118-125. 13
Kong, P. W., & De Heer, H. (2009). Wearing the F-Scan mobile in-shoe pressure 14
measurement system alters gait characteristics during running. Gait & Posture, 29(1), 15
143-145. 16
Kristianslund, E., Bahr, R., & Krosshaug, T. (2011). Kinematics and kinetics of an accidental 17
lateral ankle sprain. Journal of Biomechanics, 44(14), 2576-2578. 18
Lockhart, T. E., Woldstad, J. C., Smith, J. L., & Ramsey, J. D. (2002). Effects of age related 19
sensory degradation on perception of floor slipperiness and associated slip 20
parameters. Safety Science, 40(7-8), 689-703. 21
Lynch, S. A., & Renström, P. (2002). Foot problems in tennis Tennis (pp. 155-164). Oxford: 22
Blackwell. 23
Marigold, D. S., & Patla, A. E. (2002). Strategies for Dynamic Stability During Locomotion 24
on a Slippery Surface: Effects of Prior Experience and Knowledge. Journal of 25
neurophysiology, 88(1), 339-353. 26
Milani, T. L., Hennig, E. M., & Lafortune, M. A. (1997). Perceptual and biomechanical 27
variables for running in identical shoe constructions with varying midsole hardness. 28
23 Miller, S. (2006). Modern tennis rackets, balls, and surfaces. British Journal of Sports 1
Medicine, 40(5), 401-405. 2
Miller, S., & Capel-Davies, J. (2006). An initial ITF study on performance standards for 3
tennis court surfaces. Paper presented at the SportSurf 2nd Workshop. 4
Mills, K., Blanch, P., & Vicenzino, B. (2010). Identifying Clinically Meaningful Tools for 5
Measuring Comfort Perception of Footwear. Medicine & Science in Sports & 6
Exercise, 42(10), 1966-1971. 7
Mündermann, A., Nigg, B. M., Stefanyshyn, D. J., & Humble, R. N. (2002). Development of 8
a reliable method to assess footwear comfort during running. Gait and Posture, 16(1), 9
38-45. 10
Nigg, B. M., & Segesser, B. (1988). The Influence of Playing Surfaces on the Load on the 11
Locomotor System and on Football and Tennis Injuries. Sports Medicine, 5(6), 375-12
385. 13
O'Donoghue, P., & Ingram, B. (2001). A notational analysis of elite tennis strategy. Journal 14
of Sports Sciences, 19(2), 107 - 115. 15
Orendurff, M., Rohr, E. S., Segal, A. V., Medley, J. D., Green, J. R., & Kadel, N. J. (2008). 16
Regional Foot Pressure During Running, Cutting, Jumping, and Landing. The 17
American Journal of Sports Medicine, 36(3), 566-571. 18
Pavailler, S., & Horvais, N. (2015). Trunk and lower limbs muscular activity during tennis-19
specific movements: effect of sliding on hard and clay court. Footwear Science, 20
7(sup1), S68-S70. 21
Price, C., Parker, D., & Nester, C. J. (2014). Validity and repeatability of three commercially 22
available in-shoe pressure measurement systems. Journal of Foot and Ankle 23
Research, 7(Suppl 1), A67. 24
Reid, M. M., Duffield, R., Minett, G. M., Sibte, N., Murphy, A. P., & Baker, J. (2013). 25
Physiological, Perceptual, and Technical Responses to On-Court Tennis Training on 26
Hard and Clay Courts. The Journal of Strength & Conditioning Research, 27(6), 27
1487-1495. 28
Sherwood, L. (1993). Human Physiology: from Cells to Systems. St. Paul, MN: West 29
24 Soutas-Little, R. W., Beavis, G. C., Verstraete, M. C., & Markus, T. L. (1987). Analysis of 1
foot motion during running using a joint co-ordinate system. Medicine & Science in 2
Sports & Exercise, 19, 285-293. 3
Starbuck, C. (2015). Player Perceptions and Biomechanical Responses to Tennis Court 4
Surfaces: The Implications to Technique and Injury Risk. University of Exeter, 5
Exeter. 6
Stiles, V. H., & Dixon, S. J. (2007). Biomechanical response to systematic changes in impact 7
interface cushioning properties while performing a tennis-specific movement. Journal 8
of Sports Sciences, 25(11), 1229-1239. 9
Trepman, E., Mizel, M. S., & Newberg, A. H. (1995). Partial rupture of the flexor hallucis 10
longus tendon in a tennis player: a case report. Foot & Ankle International, 16(4), 11
227-231. 12
Willems, T. M., Witvrouw, E., Delbaere, K., Philippaerts, R., De Bourdeaudhuij, I., & De 13
Clercq, D. (2005). Intrinsic risk factors for inversion ankle sprains in females – a 14
prospective study. Scandinavian Journal of Medicine & Science in Sports, 15(5), 336-15
345. 16
Yang, Z. (2010). Connecting tennis court surface characteristics to players’ perception. The 17
University of Sheffield. 18
19
20
25
8. Tables with captions
1
[image:26.595.129.467.158.325.2]2
Table 1: Means and standard deviations for mechanical data collected on the acrylic and clay court 3
Mechanical test Acrylic Clay
Frictional measures
Pendulum (COF) 0.710 ± 0.027 0.578 ± 0.034*
Crab III (COF) 1.29 ± 0.05 0.85 ± 0.15*
Hardness measures
SERG Impact hammer
Peak force (N) 1751.55 ± 5.87 1723.9 ± 22.15*
Stiffness (kN/m) 302.75 ± 20.44 279.46 ± 12.96*
26 Table 2: Means and standard deviations for kinematic data during the turning movement on each tennis court for both experience groups
Variable Acrylic court Clay court ES
Experience
group
Low-experience
group
Total Experience
group
Low-experience
group
Total
Ankle dorsi flexion
At impact (o) -2.5 ± 7.7 3.3 ± 8.3 0.4 ± 8.1 7.7 ± 9.4 3.3 ± 8.3 2.5 ± 10.2 0.562 i
Peak (o) -20.4 ± 12.8 -27.6 ± 12.8 -24.0 ± 11.9 -14.4 ± 5.0 -22.3 ± 9.2 -18.3 ± 8.1
Time of peak (s) 0.11 ± 0.09 0.20 ± 0.054 0.16 ± .1 0.29 ± 0.13 0.27 ± 0.09 0.28 ± 0.10 0.694*
Ankle inversion
At impact (o) -0. 3 ± 6.6 -1.7 ± 7.0 -1.0 ± 6.5 3.5 ± 6.7 -4.9 ± 6.1 -0.7 ± 7.5
Peak (o) -14.3 ± 10.1 -10.3 ± 4.1 -12.3 ± 7. 6 -8.6 ± 4.4 -11.4 ± 3.3 -10.0 ± 4.0
Time of peak (s) 0.08 ± .01 0.12 ± 0.01 0.08 ± 0.03 0.11 ± 09 0.11 ±0.03 0.11 ± 0.02
Knee Flexion Angle
At impact (o) 17.3 ± 9.5 24.3 ± 12.7 20.8 ± 11.2 28.1 ± 9.1 37.0 ± 8.2 32.5 ± 9.4 0.476*
Peak (o) 31.2 ± 18.2 49.6 ± 9.7 40.4 ± 16.8 51.2 ± 17.6 42.7 ± 23.7 47.0 ± 20.2
Time of peak (s) 0.16 ± 0.12 0.12 ± 0.10 0.14 ± .10 0.36 ± 0.11 0.15 ± 0.12 0.26 ± 0.16 0.456 g
27 Table 3: Means and standard deviations for whole foot pressure data during the turn for each tennis court
Variable Acrylic court Clay court ES
Impact force
Peak (BW) 2.86 ± 0.78 2.14 ± 0.59 1.688*
Time of peak (s) 0.13 ± 0.06 0.12 ± 0.03
Active force
Peak (BW) 2.92 ± 0.75 2.37 ± 0.46 1.055*
Time of peak (s) 0.17 ± 0.09 0.29 ± 0.12 0.985*
Loading rate
Average (BW/s) 32.69 ± 11.44 21.43 ± 6.20 1.110*
Peak (BW/s) 83.62 ± 12.74 65.48 ± 28.50 0.767*
Impulse (BW.s) 11.47 ± 3.80 8.11 ± 2.00 1.22*
Whole foot pressure
Maximum pressure (kPa) 49.31 ± 10.56 49.5 ± 10.74
Mean pressure (kPa) 14.29 ± 18.49 13.23 ± 17.29
28
[image:29.595.120.365.140.284.2]9. Figure Captions
Figure 1. Depicts the perception scales including the descriptive end phrases
Figure 2. Joint coordinate system marker locations: 1) hip (greater trochanter) , 2)
medial knee (medial femoral epicondyle), 3) lateral knee (lateral femoral
epicondyle), 4) shin (anterior aspect of shank), 5) Achilles 1 (proximal bisection of
posterior shank), 6) Achilles 2 (distal bisection of the posterior shank), 7) calcaneus
1 (proximal bisection of the calcaneus), 8) calcaneus 2 (distal bisection of the
calcaneus), 9) lateral malleolus, 10) toe (base of 2nd metatarsal), 11) 5th metatarsal
[image:29.595.114.211.532.737.2]29 Figure 3. A representation of the eight masks (right foot) used; P1: hallux, P2: lesser
toes, P3: medial forefoot, P4: lateral forefoot P5: Medial mid foot, P6: lateral
midfoot, P7: medial heel, P8: lateral heel.
Figure 4. Means and SD for the perception parameters and comparison between the
[image:30.595.126.405.421.648.2]30 Figure 5. A schematic diagram representing attack angle, where attack angle is
defined as the angle between the horizontal axis and calcaneus to hip vector. a)
Represents a greater attack angle reported for the acrylic court, b) presents a more
upright position observed on the clay court, with a greater hip height compared to the
acrylic court.
Figure 6. Maximum pressures for the eight masks on acrylic and clay court. *
[image:31.595.166.445.246.368.2] [image:31.595.124.424.510.707.2]31 Figure 7. Mean pressures for the eight masks on acrylic and clay court. * Denotes (P