This is a repository copy of
Difficulties in the determination of post-liquefaction strength for
sand
.
White Rose Research Online URL for this paper:
http://eprints.whiterose.ac.uk/109370/
Article:
Chu, J and Wanatowski, D orcid.org/0000-0002-5809-0374 (2014) Difficulties in the
determination of post-liquefaction strength for sand. Géotechnique Letters, 4 (1). pp.
57-61.
https://doi.org/10.1680/geolett.13.00076
[email protected] https://eprints.whiterose.ac.uk/
Reuse
Unless indicated otherwise, fulltext items are protected by copyright with all rights reserved. The copyright exception in section 29 of the Copyright, Designs and Patents Act 1988 allows the making of a single copy solely for the purpose of non-commercial research or private study within the limits of fair dealing. The publisher or other rights-holder may allow further reproduction and re-use of this version - refer to the White Rose Research Online record for this item. Where records identify the publisher as the copyright holder, users can verify any specific terms of use on the publisher’s website.
Takedown
If you consider content in White Rose Research Online to be in breach of UK law, please notify us by
Difficulties in the determination of post-liquefaction strength for
sand
J. CHU* and D. WANATOWSKI{
Static liquefaction has been considered one of the commonest failure mechanisms for granular soil slopes or tailings dams. One of the design approaches adopted is based on the so-called post-liquefaction strength as a design parameter. However, determination of the post-post-liquefaction strength by laboratory tests is problematic. In this paper, experimental data are used to illustrate that the post-liquefaction strength cannot be determined properly or uniquely in the laboratory. The assumption of an undrained condition is also questionable for sand or tailings with relatively high permeability under static loading conditions. Due to the above deficiencies, it is recommended that engineers stop using the post-liquefaction strength as a design parameter in practice.
KEYWORDS: laboratory tests; liquefaction; sands; shear strength
ICE Publishing: all rights reserved
INTRODUCTION
Slope failures or landslides are common geotechnical hazards. These include failures of tailings dams of mine waste or mineral sands due to a lack of either adequate shear strength or excessive soil deformation. Liquefaction under either static or dynamic conditions has been considered one of the commonest failure mechanisms for granular soil slopes or tailings dams (Ishihara, 1993; Lade, 1993; Dawson
et al., 1998; Hightet al., 1999; Martin & McRoberts, 1999; Fourieet al., 2001; Davieset al., 2002; Pastor et al., 2002; Chuet al., 2003a; Jefferies & Been, 2006; Psarropoulos & Tsompanakis, 2008). As explained by Davieset al.(2002), failure of loose granular soil slopes or some tailings dams is often considered to be triggered by liquefaction occurring under undrained conditions, as shown in Fig. 1. According to Martin & McRoberts (1999), two approaches – effective stress analysis and undrained strength analysis – have been adopted in the design of tailings dams.
In the effective stress analysis method, effective stresses during shear are assumed to be unchanged from those that existed immediately prior to the onset of shear. In other words, failure is calculated as the failure shear stress corresponding to in situ effective stresses using the effective failure envelope, at point F, as marked in Fig. 1(a). This method may be applicable to dense, dilative soil where the excess pore pressure generated during shear is very small or negative. However, for loose, contractive soil where positive excess pore pressure is generated, this method is unconservative, as failure occurs at point P, not at point F, as shown in Fig. 1(a).
In the undrained strength analysis method, the undrained shear strength is defined as the steady-state strength, or the post-liquefaction strength,Sus (Fig. 1(a)).
This method is similar to the steady-state approach (Poulos
et al., 1985). As elaborated by Martin & McRoberts (1999), for contractive materials, design analyses must include both
the undrained strength analysis and the effective stress analysis, with design controlled by the analysis type giving the lowest factor of safety. For dilative or fully drained materials, only effective stress analysis is required.
It needs to be pointed out that a typical behaviour of loose sand observed by Bishop & Henkel (1962) in an undrained triaxial test on a Brasted sand specimen that has entered the geotechnical canon shows only a slight decrease in deviatoric stress after a peak value. The stress path meets the failure line at one single point and almost stays there. According to Bishop & Henkel (1962), the specimen was prepared by water sedimentation. For clean sand, it is difficult to achieve a fully softened state when samples are prepared by water sedimentation methods (Ishihara, 1993). Thus, complete static liquefaction did not occur in this test. This was also testified by the pore water pressure behaviour observed in this test – the pore water pressure began to decrease after 2% axial strain while the peak deviatoric stress was achieved at about 14% axial strain. This behaviour is different from that shown in Fig. 1 where the pore pressure increases continuously until the end of test and static liquefaction is observed.
When the post-liquefaction undrained strength is used in practice, there are problems in determining of the design value by laboratory tests. Experimental data obtained from triaxial or plane-strain tests on sand are used in this paper to illustrate that the post-liquefaction strength cannot be determined properly or uniquely in the laboratory. The assumption of an undrained condition is also questionable for sand or tailings with relatively high permeability under static loading conditions. Researchers and engineers should be aware of these deficiencies when they use the post-liquefaction strength in practice. It should also be noted that the post-liquefaction undrained strength of sand is different from the residual strength defined for clay (Skempton, 1964; Budhu, 2000).
PROBLEMS WITH MEASUREMENT OF POST-LIQUEFACTION STRENGTH
As a property of liquefied soil, the post-liquefaction strengthSusshould be measured from a test in which soil
liquefies. However, once a soil liquefies, the specimen collapses suddenly from the point where liquefaction is
Manuscript received 19 October 2013; first decision 12 December 2013; accepted 26 February 2014.
Published online at www.geotechniqueletters.com on 1 April 2014.
*Department of Civil, Construction and Environmental Engineering, Iowa State University, Ames, IA, USA
{Department of Civil Engineering, Faculty of Science and
initiated (e.g. from the peak point P in Fig. 1(a)). Thus, the stresses and strains in the post-peak region cannot usually be measured properly. Because of this, the post-liquefaction strength is often measured as the remaining (i.e. ultimate) strength after the post-peak strain softening behaviour, as shown in Fig. 1(b). It should be noted that, during strain softening, the shear stress is reduced gradually and the
specimen does not collapse. Thus liquefaction does not occur in this test and theSusobtained in this way may not be
relevant to soils or tailings that liquefy. The concept of post-liquefaction strength is clear. However, how to measure the
Effective stress σ′
Shear strain γ
(a)
(b)
Shear stress
τ
Shear stress
τ
Collapse surface
Unstable zone
Flow failure
Post-liquefaction strength
τst
τst
P F
φcv
Monotonic
Monotonic Peak
Cyclic Sus
Sus
[image:3.595.319.548.60.361.2]σ′r
Fig. 1. Response of loose saturated cohesionless tailings under monotonic and cyclic loading
Cross beam
External LVDT
PWP transducer Load
Cell
LVDT Pressure transducer
Pressure transducer
Pressure transducer
Data acquisition
system
Demodulator
Computer DPVC-1
DPVC-2 Force
actuator
Control box
Pressure transducer
[image:3.595.64.290.61.334.2]Specimen
Fig. 2. Plane-strain apparatus
200
150
100
50 250
0
20
15
10
Axial strain
ε1
: %
5
0
0 150 200
(a) (b)
(c) (d)
Peak state (no shear band)
Peak state (no shear band)
Peak state (no shear band) Peak state (no shear band) Instability line
Critical state line A A
C B
C
B
A
C U05L
U05 B
A
C U05 U05L
B Load-controlled (U05L)
Deformation-controlled (U05)
Load-controlled Deformation-controlled
Load-controlled Deformation-controlled
Load-controlled Deformation-controlled
U05 (strain softening)
U05L (instability) (ηcs = 1.16)
100
Mean effective stress p′: (kPa)
50 250
0 50 100 150 200
0 100 150 200
Time t: min
Time t: min
50
0 100 150 200
Time t: min 50
Deviatoric stress
q
: kPa 200
150
100
50 250
0
150
100
50
Excess PWP
D
u
: kPa
0
Deviatoric stress
q
: kPa
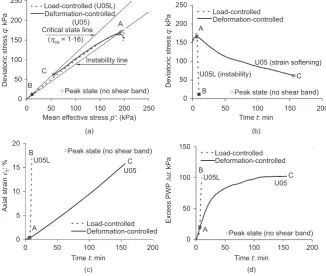
Fig. 3. Behaviour of undrained plane-strain tests on loose sand conducted under deformation-controlled and load-controlled
loading conditions: (a) effective stress paths; (b) deviatoric stress–time curves; (c)e1–time curves; (d)Du–time curves
[image:3.595.140.467.472.748.2]post-liquefaction strength using laboratory tests needs to be discussed.
A set of plane-strain tests on Changi sand, a marine-dredged sand fill used for a land reclamation site in Singapore, was conducted by Wanatowski (2005) using a plane-strain apparatus (Fig. 2). A plane-strain condition was imposed using two steel vertical platens, fixed in position by two pairs of horizontal tie rods. The lateral stress in this direction (i.e. intermediate principal stress, s2) was
measured by four submersible total pressure transducers. More detail on the soil tested, the plane-strain apparatus and the testing procedure is given by Wanatowski & Chu (2006, 2007, 2012). The results of two plane-strain tests are shown in Fig. 3. Both tests wereK0consolidated undrained tests.
The void ratios for the two tests were almost the same, 0?915
and 0?911 for test U05 and test U05L, respectively. The test
conditions for the two tests were also almost identical except that test U05 was carried out under a deformation-controlled loading condition and test U05L under a load-controlled loading condition. The difference in the loading conditions led to different post-peak behaviours in the two tests. Liquefaction occurred in test U05L and the specimen collapsed upon initiation of liquefaction at point A. This is shown by the sudden decrease in the deviatoric stress (Fig. 3(b)) and the abrupt increase in the axial strain from point A (Fig. 3(c)). The excess pore water pressure (PWP) in test U05L also shot up suddenly, as shown in Fig. 3(d). From this test, the post-liquefaction strength can be determined as point B in Fig. 3. However, as more than 15% strain developed within seconds and the specimen had collapsed or distorted significantly after liquefaction occurred, the stress and strain measured after the specimen had collapsed did not represent element behaviour anymore. Thus, the stress condition at point B is not well-defined and the post-liquefaction strength determined using point B is not reliable.
In test U05, strain softening occurred. This is shown by a gradual decrease in deviatoric stress with time in Fig. 3(b) and a gradual increase in axial strain with time in Fig. 3(c). If we use this test to determine the post-liquefaction strength, it will be the ultimate state, point C, in Fig. 3. This point is well-defined. However, as liquefaction did not occur in this test, the strength given by point C will not be the post-liquefaction strength. Furthermore, point C is different from point B. Thus, the post-liquefaction strength determined by test U05 is different from that by test U05L. Therefore, the post-liquefaction strength may not be determined as the ultimate state in a test exhibiting strain softening behaviour. In conclusion, the post-liquefaction strength is difficult to measure properly using either a load-controlled or deformation-load-controlled test.
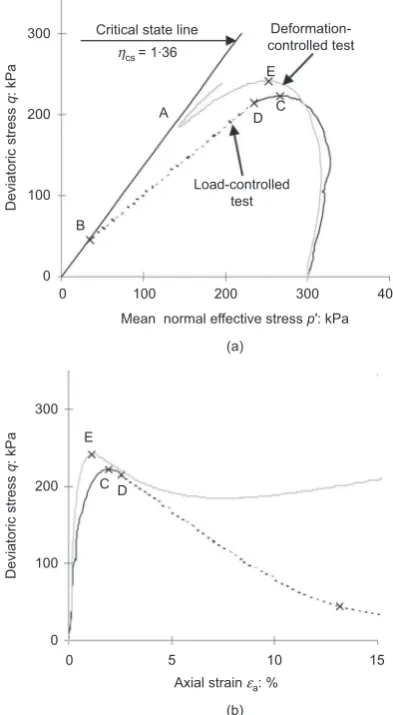
The same observation was made from undrained triaxial tests. An example is given in Fig. 4 where the results of two isotropically consolidated undrained tests on two nearly identical loose sand specimens are compared. In Fig. 4, one test was conducted using load-controlled mode and static liquefaction occurred; the other test used deformation-controlled mode and strain softening was observed. It can be seen that the post-liquefaction strength obtained from the deformation-controlled test at point A is different from that obtained from the load-controlled test at point B.
Even if one wants to determine the post-liquefaction strength using the ultimate state obtained from an undrained test with strain softening behaviour, the varia-tion inSuscan be too large for a small variation in void
ratio. One example is shown in Fig. 5 where the data of three isotropically consolidated undrained triaxial tests are presented. With a small change in the void ratio from 0?849
in test U2 to 0?839 in test U3, the ultimate state and thus
theSusvalue has more than doubled (from point B to point
A). In practice, the void ratio of a soil cannot be determined precisely and it usually varies within a certain range. This makes determination of the Sus value very
difficult for practical design.
Finally, it should be pointed out that the post-liquefaction strength determined from a triaxial test is different from that
200
100
Deviatoric stress
q
: kPa
300 Critical state line Deformation-controlled test
E
C D
Load-controlled test A
B
E
CD
ηcs = 1.36
0 0
200
100
Deviatoric stress
q
: kPa
300
0 0
300 200
(a) 100
15 10
Axial strain εa: %
(b) 5
[image:4.595.316.513.64.422.2]Mean normal effective stress p′: kPa 400
Fig. 4. Behaviour of undrained triaxial tests on loose sand conducted under deformation-controlled and load-controlled loading conditions: (a) effective stress paths; (b) stress–strain curves
400
300
200
q
′ =
σ1
′ –
σ3
′: kPa
100 500
600 500 400 300 U1, e = 0.876 A
B
U3, e = 0.839
U2, e = 0.849
200
100 700
0 0
p′ = σ1′ + 2σ3′: kPa
3
[image:4.595.306.528.578.744.2]obtained from a plane-strain test, given that the other conditions are the same. It can be seen from Figs 3(a) and 4(a) that the slope of the critical state line for plane-strain conditions (gcs 5 1?16) is different from that for
axisym-metric conditions (gcs51?36). This has been well-established
by Wanatowski & Chu (2007) and Chu & Wanatowski (2008). Therefore, post-liquefaction strength determined using triaxial tests will not be applicable directly to slope stability problems that are analysed under plane-strain or three-dimensional conditions.
OTHER CONCERNS
There are several other problems or concerns associated with the use of post-liquefaction strength for stability analysis of granular soil slopes or tailings dams.
First, granular soils or tailings have to be very loose to exhibit static liquefaction or strain softening behaviour as shown in Fig. 1. Many granular soils at in situ density do not liquefy under static undrained conditions, as has been shown by Beenet al.(1988), Vaid & Thomas (1995), Vaid
et al.(1999), Fourieet al.(2001), Chu & Leong (2003) and Chu et al. (2003b). In this case, the post-liquefaction strength may not be relevant if liquefaction does not occur at in situ density under assumed undrained conditions. However, this does not preclude the occurrence of static liquefaction as sand can still become unstable under other than undrained conditions, such as drained or ‘non-undrained’ (i.e. where pore water pressure and volume change occur simultaneously) conditions, as discussed in detail by Chuet al.(1993, 2003a).
Second, for granular soils or tailings with relatively high permeability (higher than 1026m/s), the assumption of
‘undrained’ under static loading conditions may not be reasonable. There are cases where instability or static liquefaction occurred under essentially drained conditions. In recent re-analysis of the Wachusett dam failure in 1907, Olsonet al. (2000) concluded that the failure was mainly triggered by static liquefaction that occurred under completely drained conditions. Through laboratory model tests, Eckersley (1990) observed that the pore water pressure increase in the gentle granular soil slope was a result of, rather than the cause of, flowslide. In other words, flowslide took place under a drained condition. In these cases, failures appear to be triggered by a mechanism similar to static liquefaction, although the drainage condition prior to failure is not undrained (Chu et al., 2003a). It should be pointed out that the equilibrium analysis method using the peak friction angle of sand may not be applicable in this case as the failure may not be controlled by the peak strength of sand (Chuet al., 2003a).
It has been demonstrated experimentally that instability or liquefaction of sand can occur under drained or ‘non-undrained’ (i.e. other than undrained) conditions (Chu
et al., 1993; Chu & Leong, 2001). Failure mechanisms related to a redistribution of void ratio within a globally undrained sand layer (Fig. 6(a)) and spreading of excess pore pressure with global volume changes (Fig. 6(b)) have been envisaged by the US National Research Council (NRC, 1985) as mechanisms B and C respectively. The possibility of dilating behaviour of soil masses prior to slope collapse was also observed in several case studies. Beenet al.(1987) argued that the Nerlerk berm failure case might have occurred for dilative sand that lies below the steady-state line. Several other cases of flowslide failure in dilative sand have also been presented by Beenet al.(1987). The use of post-liquefaction strength may therefore not necessarily ensure the stability of granular slope or tailings dams. Further studies on the different failure mechanisms and new design methods to replace the post-liquefaction strength approach are required.
CONCLUSIONS
Post-liquefaction undrained shear strength,Sus, defined as the
remaining strength of a liquefied soil in an undrained test, has been used for the design of granular soil slopes or tailings dams. However, this approach is problematic. The main problem is thatSuscannot be determined properly in a laboratory using
either load-controlled undrained tests where liquefaction occurs or deformation-controlled undrained tests where strain softening occurs. The assumption of the undrained condition is also questionable for sand or tailings with relatively high permeability. For this reason, it is suggested that engineers move away from the use of post-liquefaction strength in design until a better method can be developed to allow reliable design parameters to be determined.
REFERENCES
Been, K., Conlin, B. H., Crooks, J. H. A., Fitzpatrick, S. W., Jefferies, M. G., Rogers, B. T. & Shinde, S. (1987). Discussion on ‘Back analysis of the Nerlerk berm liquefaction slides’.Can. Geotech. J.24, No. 1, 170–179.
Been, K., Crooks, J. H. A., Conlin, B. H. & Horsfield, D. (1988). Liquefaction of hydraulically placed sand fills. Geotechnical special publication 21: Hydraulic fill structures(Van Zyl D. J. A. and Vick S. G. (eds)), pp. 573–591.
Bishop, A. W. & Henkel, D. J. (1962). The measurement of soil properties in the triaxial test. London: Edward Arnold. Budhu, M. (2000).Soil mechanics and foundations. New York: Wiley. Chu, J. & Leong, W. K. (2001). Pre-failure strain softening and pre-failure instability of sand: a comparative study.Ge´otechnique51, No. 4, 311–321.
Effective stresses reduced, cracking
Looser
Denser
Sand loosened by outward flow
(a) (b)
[image:5.595.162.449.64.178.2]Sand with high pore pressure
Fig. 6. Failure mechanisms identified by NRC (1985): (a) mechanism B for the situation where void redistributes within a globally undrained sand layer; (b) mechanism C for the situation where failure is induced by spreading of excess pore pressure with global volume changes
Chu, J. & Leong, W. K. (2003). Reply to discussion by A. Eliadorani and Y.P. Vaid on ‘Effect of undrained creep on instability behaviour of loose sand’.Can. Geotech. J.40, No. 5, 1058–1059. Chu, J. & Wanatowski, D. (2008). Instability conditions of loose sand in plane-strain.J. Geotech. Geoenviron. Engng ASCE134, No. 1, 136–142.
Chu, J., Lo, S.-C. R. & Lee, I. K. (1993). Instability of granular soils under strain path testing.J. Geotech. Engng ASCE119, No. 5, 874–892.
Chu, J., Leroueil, S. & Leong, W. K. (2003a). Unstable behaviour of sand and its implication for slope stability.Can. Geotech. J. 40, No. 5, 873–885.
Chu, J., Leong, W. K. & Loke, W. L. (2003b). Discussion on ‘Defining an appropriate steady state line for Merriespruit gold tailings’.Can. Geotech. J.40, No. 2, 484–486.
Davies, M., McRoberts, E. C. & Martin, T. E. (2002). Static liquefaction of tailings – fundamentals and case histories.
Tailings Dams 2002: Proceedings of the Joint ASDSO/USSD Specialty Conference, Las Vegas, NV, USA, pp. 233–255. Dawson, R. F., Morgenstern, N. R. & Stokes, A. W. (1998).
Liquefaction flowslides in Rocky mountain coal mine waste dumps.Can. Geotech. J.35, No. 2, 328–343.
Eckersley, J. D. (1990). Instrumented laboratory flowslides.
Ge´otechnique40, No. 3, 489–502.
Fourie, A. B., Blight, G. E. & Papageorgiou, G. (2001). Static liquefaction as a possible explanation for the Merriespruit tailings dam failure.Can. Geotech. J.38, 707–719.
Hight, D. W., Georgiannou, V. N., Martin, P. L. & Mundegar, A. K. (1999). Flow slides in micaceous sands.Problematic soils
(Yanagisawa, E., Moroto, N. and Mitachi, T. (eds)). Rotterdam: Balkema, pp. 945–958.
Ishihara, K. (1993). Liquefaction and flow failure during earth-quakes.Ge´otechnique43, No. 3, 349–415.
Jefferies, M. & Been, K. (2006).Soil liquefaction. A critical state approach. London: Taylor and Francis.
Lade, P. V. (1993). Initiation of static instability in the submarine Nerlerk berm.Can. Geotech. J.30, 895–904.
Martin, T. E. & McRoberts, E. C. (1999). Some considerations in the stability analysis of upstream tailings dams.Tailings and Mine Waste 1999: Proceedings of the 6th International
Conference on Tailings and Mine Waste, Fort Collins, CO,
USA, pp. 287–302.
NRC (National Research Council) (1985).Liquefaction of soils during earthquakes. Washington, DC: Committee on Earthquake Engineering, Commission on Engineering and Technical Systems, National Research Council, National Academy Press.
Olson, S. M., Stark, T. D., Walton, W. H. & Castro, G. (2000). 1907 static liquefaction flow failure of the north dike of Wachusett dam.J. Geotech. Geoenviron. Engng ASCE126, No. 12, 1184–1193.
Pastor, M., Quecedo, M., Fernadez Merodo, J. A., Herrores, M. I., Gonzalez, E. & Mira, P. (2002). Modeling tailings dams and mine waste dumps failures.Ge´otechnique52, No. 8, 579–591. Poulos, S. J., Castro, G. & France, J. W. (1985). Liquefaction
evaluation procedure. J. Geotech. Engng. ASCE 111, No. 6, 772–792.
Psarropoulos, P. N. & Tsompanakis, Y. (2008). Stability of tailings dams under static and seismic loading.Can. Geotech. J. 45, No. 5, 663–675.
Skempton, A. W. (1964). The long-term stability of clay slopes.
Ge´otechnique14, No. 2, 77–101.
Vaid, Y. P. & Thomas, J. (1995). Liquefaction and post liquefaction behaviour of sand. J. Geotech. Geoenviron. Engng ASCE121, No. 2, 163–173.
Vaid, Y. P., Sivathayalan, S. & Stedman, D. (1999). Influence of specimen-reconstituting method on the undrained response of sand.Geotech. Test. J. ASTM22, No. 3, 187–195.
Wanatowski, D. (2005).Strain softening and instability of sand under plane-strain conditions. PhD thesis, Nanyang Technological University, Singapore.
Wanatowski, D. & Chu, J. (2006). Stress–strain behavior of a granular fill measured by a new plane-strain apparatus.
Geotech. Test. J. ASTM29, No. 2, 149–157.
Wanatowski, D. & Chu, J. (2007). Static liquefaction of sand in plane-strain.Can. Geotech. J.44, No. 3, 299–313.
Wanatowski, D. & Chu, J. (2012). Factors affecting pre-failure instability of sand under plane-strain conditions,Ge´otechnique
62, No. 2, 121–135.
WHAT DO YOU THINK?