This is a repository copy of
How I reduce fuel consumption: An experimental study on
mental models of eco-driving
.
White Rose Research Online URL for this paper:
http://eprints.whiterose.ac.uk/83835/
Version: Accepted Version
Article:
Pampel, SM, Jamson, SL, Hibberd, DL et al. (1 more author) (2015) How I reduce fuel
consumption: An experimental study on mental models of eco-driving. Transportation
Research Part C: Emerging Technologies, 58 (D). pp. 669-680. ISSN 0968-090X
https://doi.org/10.1016/j.trc.2015.02.005
© 2015, Elsevier. Licensed under the Creative Commons
Attribution-NonCommercial-NoDerivatives 4.0 International
http://creativecommons.org/licenses/by-nc-nd/4.0/
[email protected] https://eprints.whiterose.ac.uk/ Reuse
Unless indicated otherwise, fulltext items are protected by copyright with all rights reserved. The copyright exception in section 29 of the Copyright, Designs and Patents Act 1988 allows the making of a single copy solely for the purpose of non-commercial research or private study within the limits of fair dealing. The publisher or other rights-holder may allow further reproduction and re-use of this version - refer to the White Rose Research Online record for this item. Where records identify the publisher as the copyright holder, users can verify any specific terms of use on the publisher’s website.
Takedown
If you consider content in White Rose Research Online to be in breach of UK law, please notify us by
Title. How I reduce fuel consumption: An experimental study on mental models of eco-driving.
Article Type ‘ P T ‘ P C “ I T
Author names and affiliations. Sanna M. Pampela (+447500868089, [email protected]), Samantha L. Jamsona ([email protected]), Daryl Hibberda ([email protected]), Yvonne Barnarda ([email protected])
a
Institute for Transport Studies, University of Leeds, University Road 34-40, LS2 9JT Leeds, UK
Abstract
Eco-driving has the potential to reduce fuel consumption and therefore emissions considerably. Previous research suggests that drivers have a certain level of eco-driving knowledge and skills, which they refrain from practising in their everyday lives. At the same time misconceptions and ambiguous messages from eco-driving support systems can confuse and demotivate. This research aimed to identify the mental models of eco-driving that regular drivers have. A driving simulator experiment with a varied road layout comprising urban and motorway sections was designed. The
“ D D D
fuel- B loud protocols and interviews were compared and
analysed. The emphasis of this study was on eco-driving relevant indicators such as accelerating, braking, coasting and car-following. The results show that the participants do have mental models of eco-driving, which they did not use in the Baseline drive, when D
M
communication with the driver about the momentary efficient speed as well as resulting time losses and fuel savings. In addition, in-vehicle guidance can increase driving safety compared to practicing eco-driving without them.
Highlights
Mental models of eco-driving were investigated in a driving simulator experiment
The approach combined behavioural data, think aloud protocols and interviews
Behaviour and focus changed when participants were asked to drive fuel-efficiently
List of figures
Figure 1: Fuel consumption and total time for the urban section of the experimental drives Figure 2: Speed profile in the acceleration scenario
Figure 3: Speed profile of the long-range braking scenario
Figure 4: Distribution of the mean time headway for the car-following scenario in the Baseline and Eco drives
List of tables
Table 1 Experimental design Table 2 Driving scenarios
Table 3: Overall results for the urban, motorway and cruising sections Table 4: Results for the acceleration scenario
Table 5: Results for the long-range braking scenario Table 6: Results for the short-notice braking scenario Table 7: Results for the cruising scenario
1.
Introduction
1.1
Background
In 2012 road transport accounted for 19% of the total carbon dioxide emissions in the EU (European Environment Agency, 2014). Eco-driving can facilitate a decrease in fuel consumption and therefore carbon dioxide emissions of conventional internal combustion engines by 5 - 10% (Barkenbus, 2010). Eco-driving is a set of behaviours that drivers can practise to save fuel and reduce emissions (Mensing et al., 2014). Hof et al. (2012) summarised a number of effective practises. In their wider scope, they include regular vehicle maintenance, tyre pressure checks and an optimal route choice. When the vehicle and route are given, eco-driving is about maintaining a constant speed, avoiding unnecessary braking and accelerating where possible by anticipating traffic situations, using higher gears and optimal acceleration.
In order to achieve a considerable reduction in emissions, the behaviour of a large proportion of drivers needs to be changed. These large-scale behavioural changes cannot be achieved by educational material alone (Delicado, 2012, Martin et al., 2012). In addition, recent research suggests that monetary savings may not be a sufficient motivator for people to take on the effort of practising a new driving style (Stillwater and Kurani, 2013, Tulusan et al., 2012). A study by Harvey et al. (2013) conducted with focus groups and questionnaires, revealed that the perceived costs of eco-driving can outweigh the comparably small monetary benefits. One of these perceived costs is the potential for increased travel time.
Despite these educational and motivational hindrances, behavioural change can be attained by in-vehicle technology providing continuous real-time feedback on parameters such as pedal pressure, gear or miles per gallon (e.g. Kim and Kim, 2012, Nouvelière et al., 2012, van der Voort et al., 2001). A growing body of research focusses on the psychological processes behind eco-driving to further improve the human-machine interaction (Stillwater and Kurani, 2013). Because there is a need to rstanding of eco-driving and to identify their information requirements, mental model research is the chosen approach in this study.
1.2
Mental models
M (Johnson-Laird,
1988). As they are retrieved and brought into use, these schemas or scripts guide perceptions and actions (Schank and Abelson, 1977). Mental models are organised on different levels of cognitive control and therefore include strategic and easily accessible knowledge, goal-oriented subroutines (rules) and highly automated action sequences referred to as skills (Anderson, 1982, Rasmussen, 1983). Researchers (e.g.(Morgan et al., 2002, Vogt and Schaefer, 2012) have explored and measured mental models in order about risks. Moreover, studying mental models is useful for exploring cognitive processes that people are unable to access with introspection (Rasmussen, 1983).
2003, Henning et al., 2008). Adding think aloud protocols to an experiment allows the capture of momentary thoughts while actions are carried out. For these protocols the participants are instructed to speak out loud whatever is going through their minds. They are neither asked to explain nor focus on anything (Ericsson and Simon, 1980, van Someren et al., 1994).
1.3
Eco-driving support systems
Numerous studies have evidenced that in-vehicle eco-driving support systems (EDSS) can be effective in reducing fuel consumption. A proven strategy is the correction and maturation of the F N (2012) found that EDSS that communicate with the driver instead of manipulating the vehicle encourage the driver to participate, expend more
A -driving proficiency (Wada et
al., 2011) or making it obvious where the driver is standing in relation to their goal (Stillwater and Kurani, 2013) can further improve fuel savings, acceptance of the technology and interest in eco-driving.
Still, EDSS have their limitations. In most studies considerable fuel savings are achieved, while it
-driving proficiency triggered by the system or experimental situation (Birrell et al., 2014, Tarkiainen et al., 2014). A control condition in which participants are asked to eco-drive without any feedback has been effective in accounting for these unwanted effects (van der Voort et al., 2001). Furthermore, it is not always clear to drivers which actions are most effective in improving their eco-driving scores (Man et al., 2010). For example, a miles per gallon measure alone can be misleading, because it does not take kinetic energy into account and therefore encourages suboptimal acceleration and deceleration (Stillwater, 2011).
1.4
The current study
In this research eco-driving mental models were investigated in a driving simulator experiment supplemented with think-aloud protocols and open interviews. This research aimed to identify the mental models regular drivers have of eco-driving by measuring changes in their behaviour and thoughts after being asked to drive in an eco-friendly manner. The measures were contrasted to their usual (Baseline) driving, but also safe driving behaviour. The Safe condition was added to enable distinguishing eco-driving mental models from driving with special instructions and therefore possibly increased attentional resources. Specifically, longitudinal driving behaviour was examined. It includes accelerating, car-following, cruising (free flow driving) as well as decelerating using braking and coasting. Coasting was described by Beusen et al. (2009) as smooth deceleration by releasing the accelerator pedal while not pressing the brake pedal.
2.
Methodology
2.1
Design
Sa E Baseline 2 Table 1. The Baseline conditions were always conducted as the first
F
behaviour as well as to evaluate practice or boredom effects by comparing Baseline 1 with Baseline
2. F “ E or fuel-efficiently,
N
[image:9.595.69.529.256.386.2]-the instructions. The between factor Group (2 levels) refers to -the sequence in which -the second and third drives were completed. These were counterbalanced to account for order effects and the participants were randomly assigned to a Group.
Table 1 Experimental design
Simulator
Drive Group 1 Group 2
1 D Baseline 1) D Baseline1)
2 D Safe) D Eco)
3 D Eco) D Safe)
4 D Baseline 2) D Baseline2)
2.2
Driving scenarios
A varied test layout was created with an urban and a busy motorway section. The urban section
junctions. The posted speed limit was 40 mph (64 km/h). The motorway section comprised three lanes in each direction and busy traffic driving slightly slower than the posted speed limit of 70 mph (113 km/h). Four scenarios were developed, Table 2.
Table 2 Driving scenarios
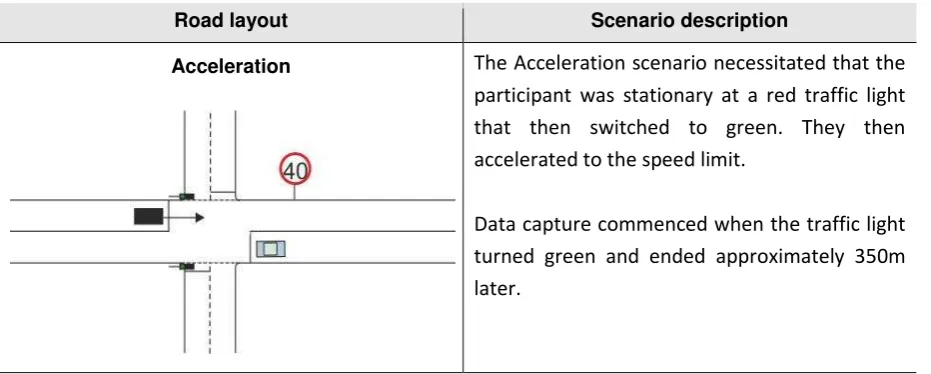
Road layout Scenario description
Acceleration The Acceleration scenario necessitated that the participant was stationary at a red traffic light that then switched to green. They then accelerated to the speed limit.
[image:9.595.67.533.550.737.2]Road layout Scenario description
Braking
The Braking scenario required drivers to bring the vehicle to a stop at a red traffic light. The traffic lights were timed in two different ways. In the long-range braking scenario, the traffic lights were red from the point where the participant was 350m before them, whilst in the short-notice braking scenario turned red when the time to collision (TTC) with them was 3.5 seconds. The scenario ended when the traffic lights turned green.
Cruising
The cruising scenario consisted of road sections with slight curves, 250m long. This scenario occurred several times in each urban section and had the secondary purpose to create space between the scenarios involving junctions. Cruising involved free flow driving with no traffic lights present.
Motorway
On the motorway the participants were required to drive into the middle lane and follow a lead vehicle. This motorway section included ten scenarios whereby adjacent vehicles cut into the participants lane ahead of them.
2.3
Dependent variables
The data recorded in this study included objective, behavioural measures as well as subjective, recorded verbalisations. Speed and x- and y-position of the vehicle on the roadway were used to model the fuel consumption. Objective measures were recorded for entire road layouts, except for the start and end sections, as well as for the distinct scenarios taking place within each drive, which are relevant for each of the longitudinal measures of interest. Mean and standard deviation values for speed, acceleration, deceleration and headway data were extracted. For the accelerator pedal angle and brake pedal pressure, maximum values were also identified.
uttered during driving, thus in the think-aloud protocols, in each experimental condition. In addition, regularly mentioned eco-driving strategies were counted.
2.4
Apparatus
T B “ U L D
Simulator (UoLDS). According to the AIDE project (Rimini-Döring et al., 2005) the simulator can be classified as a type A, or low-level, system, which was equipped with a plasma screen, a game-like steering wheel and pedals. A sound system with a speaker mimicked t
engine and other road noise. The simulator collected data at 60 Hz, which included data inferred
angle, data describing the movement and position of the vehicle in the form of speed, acceleration and deceleration. Data related to other vehicles on the simulated roads included time to collision and time headway to preceding vehicles. A Sony voice recorder was placed next to the simulator to
A I T “
arranged on a separate table.
2.5
Participants
Participants were recruited utilising the simulator database, printed adverts placed in different locations in the University of Leeds as well as snowball sampling. The group consisted of 16 drivers, between 26 and 43 years old (mean age 33.8 years, SD 5.7 years), 8 of them male (mean age 37.0 years) and 8 of them female (mean age 30.6 years). Every participant drove at least 5000 miles per year (mean annual mileage was 8750 miles), and held a full EU license for at least two years (mean driving experience was 13.3 years). Eight of the 16 drivers had previous experience with a driving simulator, but none of them had driven the desktop simulator used in this study before. As a gesture of appreciation all participants were entered into a prize draw.
2.6
Procedure
D
mentioning the eco-driving focus, to prevent the participants preparing for the study. At the beginning of a session the participants were briefed and asked to sign a consent form. They were then given a puzzle with pictures representing letters. To practise the think aloud protocol, the participants were instructed as described by Ericsson and Simon (1980) and van Someren et al. (1994). Accordingly, they were asked to speak their thoughts out loud, while performing the simple,
logical task I T “ Subsequently, the
participants performed a test drive to become familiar with the desktop driving simulator and with speaking during driving. For the experimental drives, each participant was asked to drive through an urban and a motorway section four times, according to the assigned Group. Each drive lasted around
20 minutes. After W
W A
2.7
Data analysis
The raw data collected by the driving simulator was processed in Matlab to extract the dependent variables, for the whole drives and separately for each scenario. Because the start and end sections had been implemented on roads where drivers would usually not stop, they were excluded from the analysis. Fuel consumption was approximated with the microscopic Passenger car and Heavy-duty Emission Model PHEM (Rexeis et al., 2005), assuming a Ford Mondeo Ghia with a 16V, Euro 5 petrol engine.
For the analysis of the verbal recordings the think aloud protocols and interviews were transcribed. The transcriptions were then further processed in NVivo. A bottom-up approach with Initial Coding (Charmaz, 2006) and Subcoding (Miles and Huberman, 1994) was performed to organise the nodes into trees. Simultaneous Coding (Miles and Huberman, 1994) needed to be applied, because several statements were relevant for different categories. The percentage of words coded in a category within the total verbalisations during driving in a condition was extracted. The number of participants who mentioned a particular technique to eco-drive was subjected to a simple non-statistical comparison and discussion.
In order to account for fatigue and boredom effects, the Baseline 1 and the Baseline 2 drives were compared across all objective performance measures with paired-samples, two-tailed t-tests. Subsequently, a mixed methods ANOVA with Bonferroni corrected post hoc pairwise comparisons was performed, with within-subjects factor Instruction and between-subjects factor Group. For violations of the sphericity assumption, the Greenhouse-Geisser correction was applied, because it is the most conservative method (Greenhouse and Geisser, 1959). When assumptions of parametric testing were violated, non-parametric methods were used with Wilcoxon on within-subjects factors, and the Mann-Whitney U-test on between-subjects factors. Statistical significance was accepted at p < 0.05.
3.
Results
There were sporadic significant differences in 4 comparisons, none of which suggested a consistent change in behaviour between Baseline 1 and Baseline 2. Therefore the Baseline 1 drive was excluded from further analysis. One participant remained silent during the Baseline 2 drive and was therefore excluded from the analysis of the verbal protocols. Baseline 2 is referred to as Baseline from now on.
3.1
Fuel consumption and travel time effects
scenario the reduction for the Eco drive was relatively high with 12.6%. The main effect was significant [F(2,28) = 4.05, p = .029 2 = .224], although post-hoc comparisons did not reveal a significant difference. There was a main effect of Group, with the Group having the Safe before the Eco drive consuming less fuel in every drive than the Group doing the Eco drive first [F(1,14) = 5.98, p = .028].
[image:13.595.72.407.278.473.2]With regards to travel times in the urban areas, when instructed to eco-drive, longer times were recorded [F(1.4,19.6) = 9.06, p = .004 2 = .393] compared to the Baseline drive. In the motorway section the Eco drive took longer than the Safe drive [Z = -2.482, p = .039], but because the length of the motorway section depended on the completion of the cut-in events, this result should be regarded with caution. The Eco drive resulted in a longer time compared to Baseline and Safe drives in the cruising scenario [F(2,28) = 10.12, p < .001 2 = .419], see Figure 1 and Table 3.
Figure 1: Fuel consumption and total time for the urban section of the experimental drives
Table 3: Overall results for the urban, motorway and cruising sections
Variable Safe Eco Baseline Post-hoc tests p p
2 /r
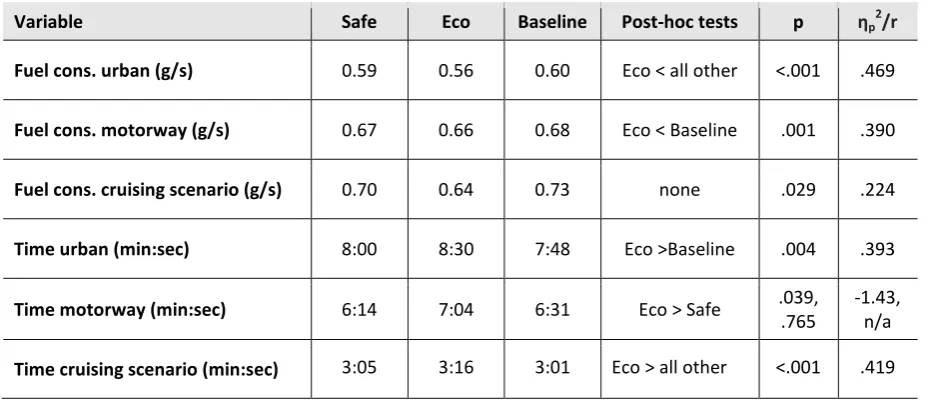
Fuel cons. urban (g/s) 0.59 0.56 0.60 Eco < all other <.001 .469
Fuel cons. motorway (g/s) 0.67 0.66 0.68 Eco < Baseline .001 .390
Fuel cons. cruising scenario (g/s) 0.70 0.64 0.73 none .029 .224
Time urban (min:sec) 8:00 8:30 7:48 Eco >Baseline .004 .393
Time motorway (min:sec) 6:14 7:04 6:31 Eco > Safe .039,
.765
-1.43, n/a
[image:13.595.65.532.535.738.2]3.2
Acceleration scenario
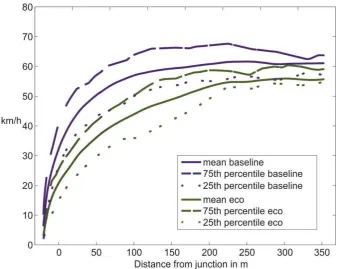
[image:14.595.71.415.205.474.2]Main effects were found for all three measures of accelerator pedal angle, with drivers in the Eco condition accelerating with a lower standard deviation (sd.) [F(2,28) = 10.81, p = <.001 2 = .436], less harshly on average [F(2,28) = 12.92, p =<.001 2 = .480] and, according to the maximum accelerator pedal angle, down [F(2,28) = 8.05, p = .002 2 = .365], compared to the other drives. The speed profiles for the acceleration scenario are shown in Figure 2.
[image:14.595.67.526.536.648.2]Figure 2: Speed profile in the acceleration scenario
Table 4: Results for the acceleration scenario
Variable Safe Eco Baseline Post-hoc tests p p
2 /r
Mean acceleration (m/s2) 1.03 0.73 1.07 Eco < all other <.001 .480
Max. accelerator pedal angle (°) 44 27 47 Eco < all other .002 .365
Sd. of acceleration (m/s2) 0.93 0.70 0.97 Eco < all other <.001 .436
3.3
Braking scenario
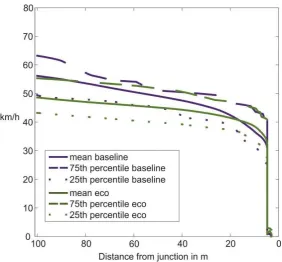
it was significantly lower in the eco-drive condition compared to all others, Table 5. Similar results were found for variation in deceleration with drivers instructed to drive fuel-efficiently braking more smoothly than when instructed to drive normally [F(1.4,19.6) = 7.67, p = .007 2 = .354]. No significant effects were found for measures relating to activation of the brake pedal (mean speed at braking initiation or maximum brake pressure).
Figure 3: Speed profile of the long-range braking scenario
Table 5: Results for the long-range braking scenario
Variable Safe Eco Baseline Post-hoc tests p p
2 /r
Mean deceleration (m/s2) -0.68 -0.56 -0.72 Eco < all other <.001 .480
Sd. of deceleration (m/s2) 0.95 0.76 1.01 Eco < Safe .007 .354
Mean speed at braking initiation
(m/s) 10.28 8.74 9.95 none .084 n/a
Max. brake pressure (N) 136 108 150 none .150,
.072
n/a, n/a
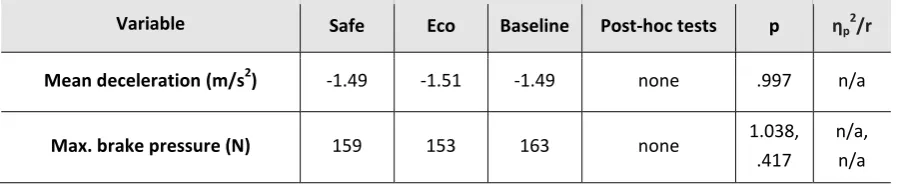
Table 6: Results for the short-notice braking scenario
Variable Safe Eco Baseline Post-hoc tests p p
2 /r
Mean deceleration (m/s2) -1.49 -1.51 -1.49 none .997 n/a
Max. brake pressure (N) 159 153 163 none 1.038,
.417
n/a, n/a
3.4
Cruising scenario
[image:16.595.67.522.355.473.2]The results for the cruising scenario are summarised in Table 7. There was a significant main effect of Instruction on mean speed [F(2,28) = 22.8, p < .001 2 = .619]. Post-hoc analysis indicated that for the Eco drive the mean speed was significantly slower than for all other conditions. There was no main effect on the standard deviation of speed. However, there was a main effect of Instruction on the standard deviation of acceleration [F(2,28) = 15.2 2 = .521]. Post-hoc comparisons revealed that the acceleration was smoother during eco-driving than in the other drives.
Table 7: Results for the cruising scenario
Variable Safe Eco Baseline Post-hoc p p
2 /r
Mean speed (m/s) 17.5 16.6 17.9 Eco < all other <.001 .619
Sd. of speed (m/s) 1.40 1.54 1.36 none .402,
.189
n/a, n/a
Sd. of acceleration (m/s2) 0.36 0.28 0.41 Eco < all other < .001 .521
3.5
Car following scenario
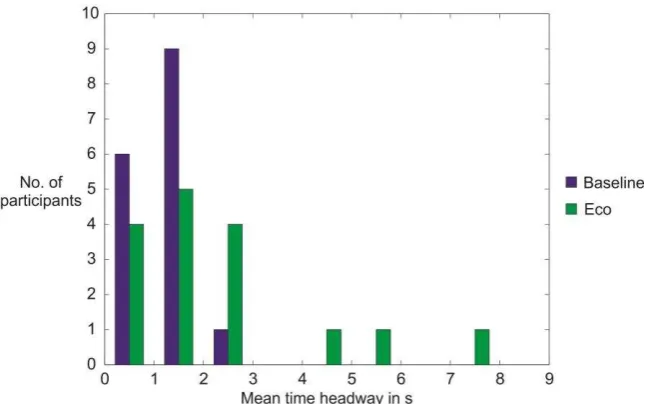
Figure 4 shows the distribution of mean time headways, split into bins with the length of 1 second, in the Baseline, Safe and Eco conditions. It can be seen that there is a greater range of headways in the Eco condition, and a main effect of Instruction was found [Eco/Safe: Z = -2.637, p = .024; Eco/Baseline: Z = -3.154, p = .006], Table 8. The standard deviation of time headway was significantly larger during the Eco drive compared to the Safe and Baseline drives [Eco/Safe: Z = -2.534, p = .033; Eco/Baseline: Z = -3.258, p = .003]. However, by limiting the analysed data to headways with a maximum of 6 seconds, which is an approximation for car-following using findings by Vogel (2002), the effect diminished. Accelerations were smoothest in the Eco condition [F(2,28) = 11.40, p < .001,
2
Figure 4: Distribution of the mean time headway for the car-following scenario in the Baseline and Eco drives
Table 8: Results for the car-following scenario
Variable Safe Eco Baseline Post-hoc tests p p
2 /r
Sd. of speed (m/s) 1.29 1.22 1.30 none 1.314,
.363
n/a, n/a
Mean headway (s) 1.37 2.37 1.22 Eco > all other .024,
.006
-1.522, -1.821
Sd. of headway (s) 0.67 1.89 0.73 Eco > all other .033,
.003
-1.463, -1.881
Sd. of acceleration (m/s2) 0.31 0.25 0.35 Eco < all other < .001 .449
Sd. of deceleration (m/s2) .22 .15 .21 Eco < Safe .045,
.078
-1.403, n/a
Analysing cut-in events on the motorway, as shown in Table 9, it was found that the standard deviation of speed was significantly lower during the Eco compared to the Baseline condition [Z = -2.999, p = .009]. Mean time headway was larger during the Eco drive [Z = -2.844, p = .012]. Further examination of the data revealed that mean time headway when braking was terminated was significantly lower for the Eco drive compared to the other drives [Eco/Safe: Z = -2.497, p = .039; Eco/Baseline: Z = -2.803, p = .015] and higher for the Group performing the Safe before the Eco drive (U = 4.00, p = .012).
Table 9: Results for the cut-in scenario
Variable Safe Eco Baseline Post-hoc tests p p
2 /r
Sd. of speed (m/s) 1.74 1.40 2.08 Eco < Baseline .078,
.009
[image:17.595.74.518.700.757.2]Variable Safe Eco Baseline Post-hoc tests p p 2
/r
Mean headway (s) 0.89 1.06 0.82 Eco > Baseline .132,
.012
n/a, -1.642
Mean speed at braking initiation
(m/s) 29.5 29.1 29.6 none .473 n/a
Mean speed at braking
termination (m/s) 26.6 25.4 25.9 none .701 n/a
Mean headway at braking
initiation (s) 0.93 1.71 0.79 none
2.634, 1.938
n/a, n/a
Mean headway at braking
termination (s) 0.54 0.36 0.48 Eco < all other
.039, .015
-1.442 -1.618
3.6
Verbal recordings
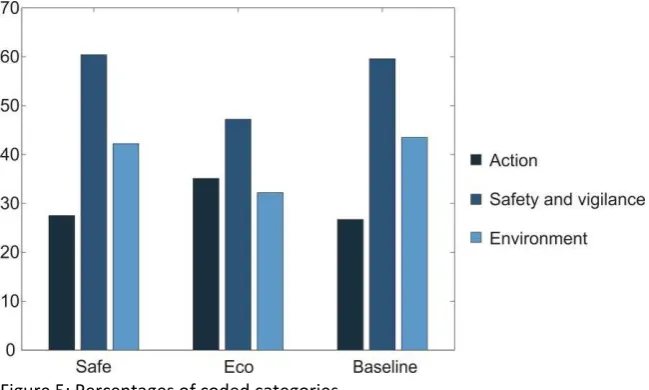
During detailed coding and subsequent categorisation four relevant categories were established. The category FUEL EFFICIENCY AND ECO DRIVING contains statements about eco-driving, which were counted and regarded in detail. A statistical analysis was conducted with the remaining three categories, ACTION, SAFETY AND VIGILANCE and ENVIRONMENT, as illustrated in Figure 5 and listed in Table 10. The order of instructions did not have significant effects on the percentage of the categories in each drive.
FUEL EFFICIENCY AND ECO DRIVING provided clues about the explicit eco-driving know-how on the
knowledge- and rule- ‘ (Rasmussen, 1983).
During the drives and the interviews afterwards people talked about their eco-driving strategies and evaluated their actions accordingly. Most references were made to verbalisations during the Eco condition in the experiment, and the number of references made in the other drives was not sufficient for a statistical analysis. Instead, common strategies were counted. Fourteen of 16 participants said that they tried to avoid large speed fluctuations at traffic lights and 11 when other cars were cutting in front of them on the motorway. Ten said specifically that they try to closely control their speed by keeping their foot steady on the throttle, for example. Eight participants mentioned a longer headway during the motorway part in the Eco I
T t during the urban
T I
Nine drivers said that they wanted to drive slower than the speed limit of 70 mph on the motorway. One participant explained that he had not planned to drive slower during the Eco drive, but his mild acceleration unintentionally resulted in a lower speed. Thirteen drivers mentioned slower
acceleration in the urban section I M
participants declared that they wanted to avoid stepping on the brake, 13 at junctions in the urban
part of the Eco T s
The ACTION category includes every statement related to what the participant was doing, either at
It comprises Just getting used to the controls
and decisions for and agains I A
category is about speed maintenance, car following and the selection of speed including increasing and decreasing it. For the percentage of the think aloud protocols coded in ACTION it was found that for the Eco drive the percentage of verbalisations coded in ACTION was significantly higher than for the Safe condition [F(2,26) = 4.03, p = .030 2 = .237].
The node SAFETY AND VIGILANCE includes statements about the driving environment as well as the
“ I
D
surprise. A repeated measures ANOVA indicated that for the Eco drive the percentage of verbalisations coded in SAFETY AND VIGILANCE was significantly lower than for the Safe condition [F(2,26) = 4.21, p = .026 2 = .245].
The ENVIRONMENT category is a subcategory of SAFETY AND VIGILANCE and includes any features
in the environment that H
Y
[image:19.595.72.397.426.621.2]To investigate the shares of the ENVIRONMENT category within the think aloud protocols a repeated measures ANOVA clarified that for the Eco drive the percentage of verbalisations coded in ENVIRONMENT was significantly lower than for the other conditions [F(2,26) = 3.74, p = .037 2 = .223].
Figure 5: Percentages of coded categories Table 10: Results for the verbal categories
Variable Safe Eco Baseline Post-hoc tests p p
2 /r
Action (%) 27.5 35.1 25.0 Eco > Safe .030 .237
[image:19.595.68.520.661.743.2]Variable Safe Eco Baseline Post-hoc tests p p 2
/r
Environment (%) 42.2 32.2 40.8 Safe > Eco .037 .223
4.
Discussion
It can be ascertained that the participants changed their behaviour when they were asked to eco-drive, which is consistent with previous studies (Birrell et al., 2010, van der Voort et al., 2001, Waters and Laker, 1980). This behaviour was not just different from the normal drives, but also from what they did when asked to drive safely. In fact, for no measure, instructing the participants to drive safely resulted in significant differences to the normal condition. Hence, the behaviour change in the Eco drives cannot solely be explained by an allocation of additional attentional resources to the driving task. The participants applied their eco-driving knowledge and managed to reduce fuel consumption, although the reduction was not significant in the cruising scenario and was relatively low in the motorway sections (only changed by 2.8%).
The speed during cruising and car-following was not kept more constant in the Eco condition, although 10 participants mentioned a steady speed as part of their strategy and lower variations in speed can indeed affect fuel savings positively (Nairn and Partners et al., 1994, cited in Haworth and Symmons, 2001). Drivers can have problems consciously influencing the usually highly automated control of the accelerator pedal (Goodrich and Boer, 2003, Rasmussen, 1983) and the sensitive controls of the simulator can add to the lack of behavioural change. A haptic pedal is able to correct speed variations on the skill level with low attentional demand (Birrell et al., 2013, Hibberd et al., 2013). The only exception was the cut-in scenario on the motorway, where the participants managed to keep their speed more constant during the Eco drives compared to the Baseline condition. This could have been made possible by the longer headways in the Eco condition. In this scenario drivers also tended to terminate their braking actions at lower time headways during eco-driving compared to the other conditions. This implies that they braked, but with less effect and accepted lower safety margins during eco-driving in order to retain a steadier speed.
them from eco-driving. In several experiments where participants used in-vehicle, eco-driving feedback devices, time losses were either low or not present at all (Birrell et al., 2010, Birrell and Young, 2011, Birrell et al., 2014, van der Voort et al., 2001). However, it has been found that asking people to eco-drive may cause an increased workload which can contribute to a reduction in speed (Haigney et al., 2000). This implies that EDSS need to inform drivers of the actual efficient speed as well as time losses. Their guidance may also reduce workload and therefore increase driving safety.
The mean acceleration in the acceleration scenario was lowered during eco-driving and 13 participants said they would do so. It has indeed been found that lower acceleration rates can result in fuel reductions (Ericsson, 2001, Waters and Laker, 1980). At the same time, the maximum accelerator pedal angle decreased and the acceleration was less erratic for the Eco drive than for the other drives. In the braking scenario the mean deceleration decreased significantly during the Eco drives and the participants attempted to avoid stopping at the traffic lights, which is an effective way to save fuel (Johansson et al., 2003). The lack of behavioural changes at the short-notice braking scenario suggests that in this critical situation participants prioritise safety over eco-driving.
The results of analysing the verbal data indicate a shift in the focus of the drivers when they attempted to eco-drive, although most significant differences were found between the Eco and the
Safe T rom unrelated thoughts can
denote an increased workload. In fact, Birrell et al. (2010) found that asking people to eco-drive without further support can have such an effect. ‘
brought mental models of the rule- and skill-level that would otherwise not have been considered into consciousness. At the same time the focus was partly taken off the environment and other safety-critical themes, which could mean a safety risk for unassisted eco-driving.
One limitation of this study is the sensitive nature of the desktop simulator controls. These could have caused the participants to drive in more erratic ways than they would in more realistic vehicles (Jamson and Jamson, 2010). The simulator required the model PHEM to approximate fuel consumption with a small number of input variables and therefore possible estimation errors. This study was conducted with a small sample of 16 participants to allow a rich data collection per participant. Its findings have to be validated with a larger sample size and more realistic driving conditions. The mental model approach is focussed on
I
this approach is sufficient, although there is still a need to further understand other factors that influence behaviour. The think aloud protocol was a valuable part of this study and aided to the understanding of eco-driving mental models. The downside of the method is the incompleteness of the verbalisations and in some places a mismatch between what the drivers said they intended to do and the behavioural data.
5.
Summary and conclusions
smoother ways as well as driving slower. They were not, however, keeping the cruising and car-following speed more constant than in other driving styles. The results suggest that many drivers do have mental models of eco-driving in place, which they usually do not usually use when instructed to
drive normally ED““ T
misconceptions about costs and benefits by informing drivers of actual efficient speeds and resulting
time losses. Imparting eco-
system works (Kieras and Bovair, 1984) and presenting the positive outcomes of their efforts can further motivate drivers to practise this driving style (Harter, 1978, White, 1963). Ultimately, constant reminders are effective in reinforcing behaviour change (Seligman et al., 1981). It has to be taken into account that some drivers may prioritise fuel efficiency over safety, which can increase the crash-risk in some instances. Further study is needed to identify these instances. It may be necessary to provide active safety systems that offset the risk, for example by monitoring following distances or reminding drivers of safety. This study was a step towards understanding the cognition of drivers by measuring mental models with behavioural and verbal data. Further studies will be necessary to validate design implications for EDSS.
References
Anderson, J. R. 1982. Acquisition of cognitive skill. Psychological review, 89, 369-406.
Barkenbus, J. N. 2010. Eco-driving: An overlooked climate change initiative. Energy Policy, 38, 762-769.
Bellet, T., Bailly, B., Mayenobe, P. & Georgeon, O. 2007. Cognitive Modelling and Computational Simulation of Drivers Mental Activities. In: Cacciabue, P. C. (ed.) Modelling driver behaviour in automotive environments. Springer London.
Beusen, B., Broekx, S., Denys, T., Beckx, C., Degraeuwe, B., Gijsbers, M., Scheepers, K., Govaerts, L., Torfs, R. & Panis, L. I. 2009. Using on-board logging devices to study the longer-term impact of an eco-driving course. Transportation Research Part D: Transport and Environment, 14, 514-520.
Birrell, S. A., Fowkes, M. & Jennings, P. A. 2014. Effect of Using an In-Vehicle Smart Driving Aid on Real-World Driver Performance. Intelligent Transportation Systems, IEEE Transactions on, 15, 1801-1810.
Birrell, S. A. & Young, M. S. 2011. The impact of smart driving aids on driving performance and driver distraction. Transportation Research Part F: Traffic Psychology and Behaviour, 14, 484-493. Birrell, S. A., Young, M. S. & Weldon, A. M. Delivering smart driving feedback through a haptic pedal.
In: Martin Anderson FIEHF, E. a. C., ed. Proceedings of the International Conference on Contemporary Ergonomics and Human Factors 2010, 2010 Keele, UK. Taylor & Francis, 431-439.
Birrell, S. A., Young, M. S. & Weldon, A. M. 2013. Vibrotactile pedals: provision of haptic feedback to support economical driving. Ergonomics, 56, 282-292.
Charmaz, K. 2006. Constructing grounded theory: A practical guide through qualitative analysis, Thousand Oaks, CA, Sage.
Delicado, A. 2012. Environmental education technologies in a social void: the cas G Environmental Education Research, 18, 831-843.
Ericsson, E. 2001. Independent driving pattern factors and their influence on fuel-use and exhaust emission factors. Transportation Research Part D: Transport and Environment, 6, 325-345. Ericsson, K. A. & Simon, H. A. 1980. Verbal reports as data. Psychological review, 87, 215-251.
European Environment Agency 2014. Annual European Union greenhouse gas inventory 1990 2012 and inventory report 2014. EEA Technical report. Luxembourg.
Goodrich, M. A. & Boer, E. R. 2003. Model-based human-centered task automation: a case study in ACC system design. Systems, Man and Cybernetics, Part A: Systems and Humans, IEEE Transactions on, 33, 325-336.
Greenhouse, S. W. & Geisser, S. 1959. On methods in the analysis of profile data. Psychometrika, 24, 95-112.
Haigney, D. E., Taylor, R. G. & Westerman, S. J. 2000. Concurrent mobile (cellular) phone use and driving performance: task demand characteristics and compensatory processes. Transportation Research Part F: Traffic Psychology and Behaviour, 3, 113-121.
Harter, S. 1978. Effectance Motivation Reconsidered. Toward a Developmental Model. Human Development, 21, 34-64.
Harvey, J., Thorpe, N. & Fairchild, R. 2013. Attitudes towards and perceptions of eco-driving and the role of feedback systems. Ergonomics, 56, 507-521.
Haworth, N. & Symmons, M. 2001. The relationship between fuel economy and safety outcomes. Victoria, Australia: Monash University Accident Research Centre.
Henning, M. J., Georgeon, O., Wynn, T. & Krems, J. F. Modelling driver behaviour in order to infer the intention to change lanes. Proceedings of European Conference on Human Centred Design for Intelligent Transport Systems, 2008. 113.
Hibberd, D., Jamson, H., Jamson, S., Pauwelussen, J., Obdeijn, C., Stuiver, A., Hof, T., van der Weerdt, C., Paradies, G., Brignolo, R., Barberi, C., Iviglia, A. & Mazza, M. 2013. D12.2: Multi-modal in-vehicle and nomadic device eco-driving support for car drivers and truck drivers. ecoDriver Project.
Hof, T., Conde, L., Garcia, E., Iviglia, A., Jamson, S., Jopson, A., Lai, F., Merat, N., Nyberg, J., Rios, S., Sanchez, D., Schneider, S., Seewald, P., Weerdt, C. v. d., Wijn, R. & Zlocki, A. 2012. D11.1: A
ecoDriver project.
Jamson, S. L. & Jamson, A. H. 2010. The validity of a low-cost simulator for the assessment of the effects of in-vehicle information systems. Safety Science, 48, 1477-1483.
Johansson, H., Gustafsson, P., Henke, M. & Rosengren, M. Impact of EcoDriving on emissions. Transport and Air Pollution. Proceedings from the 12th Symposium, 16-18 June 2003 Avignon.
Johnson-Laird, P. N. 1988. The computer and the mind: An introduction to cognitive science, Cambridge, Massachusetts, Harvard University Press.
Kieras, D. E. & Bovair, S. 1984. The Role of a Mental Model in Learning to Operate a Device. Cognitive Science, 8, 255-273.
Kim, S. Y. & Kim, Y. S. 2012. A Virtual Driving System for Enhancing Efficient Driving Style. International Journal of Multimedia and Ubiquitous Engineering, 7, 291-296.
Man, W., Bie, J. & van Arem, B. User needs in Green ITS: the Result of a Questionnaire Survey on Dutch and Japanese drivers. Proceedings 17th ITS World Congress 25 to 2010-10-29 2010 Busan, South Korea.
Martin, E., Chan, N. & Shaheen, S. 2012. How Public Education on Ecodriving Can Reduce Both Fuel Use and Greenhouse Gas Emissions. Transportation Research Record: Journal of the Transportation Research Board, 2287, 163-173.
Mensing, F., Bideaux, E., Trigui, R., Ribet, J. & Jeanneret, B. 2014. Eco-driving: An economic or ecologic driving style? Transportation Research Part C: Emerging Technologies, 38, 110-121. Miles, M. B. & Huberman, A. M. 1994. Qualitative data analysis, Thousand Oaks, CA, Sage.
Morgan, M. G., Fischhoff, B., Bostrom, A. & Atman, C. J. 2002. Risk communication: A mental models approach, Cambridge, UK, Cambridge University Press.
Nouvelière, L., Mammar, S. & Luu, H. T. Energy saving and safe driving assistance system for light vehicles: Experimentation and analysis. Networking, Sensing and Control (ICNSC), 2012 9th IEEE International Conference on, 11-14 April 2012 2012 Beijing. 346-351.
Nozaki, K., Hiraoka, T., Takada, S., Shiose, T. & Kawakami, H. Effect of active effort in eco-driving support system on proficiency of driving skill. SICE Annual Conference (SICE), 2012 Proceedings of, 20-23 Aug. 2012 2012. 646-651.
Rasmussen, J. 1983. Skills, rules, and knowledge; signals, signs, and symbols, and other distinctions in human performance models. Systems, Man and Cybernetics, IEEE Transactions on, SMC-13, 257-266.
Rexeis, M., Hausberger, S., Riemersma, I., Tartakovsky, L., Zvirin, Y. & Cornelis, E. 2005. Heavy-duty vehicle emissions. Final report of WP 400. ARTEMIS (Assessment and Reliability of Transport Emission Models and Inventory Systems); DGTREN Contract 1999-RD.10429.
Rimini-Döring, M., Keinath, A., Nodari, E., Palma, F., Toffetti, A., Floudas, N., Bekiaris, E., Portouli, V. & Panou, M. 2005. Considerations on Test Scenarios. AIDE deliverable 2.1.3
Samaras, Z. & Ntziachristos, L. 1998. Average hot emission factors for passenger cars and light duty trucks. Methodologies for estimating air pollutant emissions from transport (MEET) - Deliverable 7. Thessaloniki, Greece: Lab. of Applied Thermodynamics, Aristotle University of Thessaloniki.
Schank, R. C. & Abelson, R. P. 1977. Scripts, plans, goals and understanding: An inquiry into human knowledge structures, Hillsdale, NJ, Lawrence Erlbaum Associates.
Seligman, C., Becker, L. J. & Darley, J. M. 1981. Encouraging residential energy conservation through feedback. In: Baum, A. & Singer, J. E. (eds.) Advances in environmental psychology. Hillsdale, New Jersey: Lawrence Erlbaum Associates.
Stillwater, T. 2011. Comprehending Consumption: The Behavioral Basis and Implementation of Driver Feedback for Reducing Vehicle Energy Use. Davis, California: Institute of Transportation Studies, University of California, Davis.
Stillwater, T. & Kurani, K. S. 2013. Drivers discuss ecodriving feedback: Goal setting, framing, and anchoring motivate new behaviors. Transportation Research Part F: Traffic Psychology and Behaviour, 19, 85-96.
Tarkiainen, M., Peltola, H., Koskinen, S. & Schirokoff, A. 2014. Trafisafe - Feedback for novice drivers. 10th ITS European Congress. Helsinki, Finland.
Taylor, M., Lynam, D., Baruya, A. & Britain, G. 2000. The effects of drivers' speed on the frequency of road accidents, Transport Research Laboratory Crowthorne.
Tulusan, J., Staake, T. & Fleisch, E. 2012. Providing eco-driving feedback to corporate car drivers: what impact does a smartphone application have on their fuel efficiency? Proceedings of the 2012 ACM Conference on Ubiquitous Computing. Pittsburgh, Pennsylvania: ACM.
van der Voort, M., Dougherty, M. S. & van Maarseveen, M. 2001. A prototype fuel-efficiency support tool. Transportation Research Part C: Emerging Technologies, 9, 279-296.
van Someren, M. W., Barnard, Y. F. & Sandberg, J. A. 1994. The think aloud method: A practical guide to modelling cognitive processes, London, Academic Press Limited.
V K W Transportation Research Part F:
Traffic Psychology and Behaviour, 5, 15-29.
Vogt, C. & Schaefer, M. 2012. Seeing things differently: Expert and consumer mental models evaluating combined oral contraceptives. Psychology and Health, 27, 1405-1425.
Wada, T., Yoshimura, K., Doi, S. I., Youhata, H. & Tomiyama, K. Proposal of an eco-driving assist system adaptive to driver's skill. Intelligent Transportation Systems (ITSC), 2011 14th International IEEE Conference on, 5-7 Oct. 2011 2011 Washington, DC, USA. 1880-1885. Waters, M. H. L. & Laker, I. B. 1980. Research on Fuel Conservation for Cars. Crowthorne, England:
Transport and Road Research Laboratory.
Acknowledgements