©P0p©G][D Dmw©8ö[]Lu©mö
B G E B I
[l(!D(oMJii(öiücs[A]¥(o)(o)in}i?^ \ É \ m m w @ m m
(DgMôlQÎI© llQil(?@^)é©oi)(n)© (ol'OCn)^@ßfl§©©(JiiQ©(iöß
® ë m m (ioa(i®(ô)©a ^ m gOö OiJD^sioìnxMififi
No 37-February 1984
ISSN 0250-3891EiB financing readies almost 6 biilion ECUs in 1983
Financing operations carried out by the European Investment Banic to help economic development in the EEC Member States and in other countries linked to the Community, mainly in the developing world, grew to almost 6 billion ECUs in 1983. This Is an
overall 27% rise on the previous year (4.7 billion) or 20% in real terms, i.e. after allowing for the effects of inflation.
Key features of the Bank's operations in the Com-munity (almost 5.5 billion ECUs) during 1983 included:
M a concentration of lending for investment in probleni regions; over 60% went to areas lagging behind in their development or needing to tackle serious industrial decline, and confronted with high unemploy-ment;
M a substantial rise in lending for industrial modernisation, marked mainly by a considerable increase in providing finance for small and medium-scale ventures — some 3 250 vyere helped to set up, expand or modernise (1983 was the Euro-pean Year of the Small and Medium-scale Enterprise); there was an ac-cent on improving firms' productiv-ity with a higher technology input, and on reinforcing Europe's stake In several fields of forward-looking technology;
^ an expansion in lending for a broad range of investment aimed at reducing the Community's depen-dence on oil imports, particularly by making more efficient use of energy;
M a strengthened commitment to environmental protection (in 1983 the Bank signed the United Nations Declaration on Environmental Policies and its loans for investment along these lines more than doub-led);
^ a vigorous contribution from New Community Instrument re-sources: 1.2 billion of the total came from these funds, which the EIB (ends on the Community's behalf for investments furthering specific ob-jectives — currently mainly to help investment by small and medium-scale firms and bolster energy de-velopment.
The ElB's activities have grown steadily since 1977 when the Euro-pean Council called for increased Community action to support invest-ment, combat unemployment and reduce disparities between national economic performances. Lending in 1983, including New Community In-strument loans, was some 110% up in real terms on the amount lent in 1977.
Three months ago the EIB organised an international symposium in Lux-embourg entitled "Investing in Europe's future", and sponsored a book with the same title written by leading economists, to stress the urgency of fostering recovery of in-vestment in the EEC.
Outside the Community: 1983 saw the Bank pursuing its financing under Community agreements to as-sist economic development in Por-tugal and Spain in preparation for their accession to the EEC.
The EIB helped to fund development aid projects in over 25 other coun-tries. In the Mediterranean region there was an increase in activity with funds Qoing to development in Yugoslavia and the start of lending under the new financial protocols to the EEC's cooperation agreements with Morocco, Egypt, Jordan and the Lebanon.
In African, Caribbean and Pacific countries — signatories to the sec-ond Lomé Convention — the rhythm
of lending was less pronounced. In-vestment slowed as a result of the difficult economic and financial situ-ation of the ACP countries, many of them afflicted also by adverse clima-tic conditions.
In total, the Bank's operations out-side the Community amounted to 480 million ECUs.
Borrowings which the EIB made during the year to resource its lend-ing operations came to the equiv-alent of some 3.6 billion ECUs, a 13% rise on 1982's total; the funds were raised mainly through public bond issues. Community currencies represented just over half the bor-rowings headed by the Deutsche Mark (almost 20%) and the guilder (10.5%). There was also a marked increase in borrowings in ECU. Non-Community currencies were, as be-fore, headed by United States dol-lars (over 25%) but the yen rose to almost 13% of borrowings.
Strengthened support
The EIB was able to strengthen its support for priority investments in Europe.
There was a significant expansion of lending in Italy (up 28%) and France (almost doubled), a strong recovery of activity in the United Kingdom (up 40% after a slack 1982), and appreci-able rises in Denmark and Germany;
in Greece activity held more or less steady, but in Ireland demand for loans dropped somewhat.
Projects supported during the year involved an estimated 18 billion ECUs of new fixed investment in the EEC (about 12 billion in 1982), with the loans therefore contributing some 30%. Finance was heavily con-centrated in those parts of the Com-munity with the most severe struc-tural problems: for example loans in Greece can be calculated as corres-ponding to about 5.8% of gross fixed capital formation during the year, in Ireland 6.9% and in the Italian Mezzogiorno 8%.
Estimates are that investments sup-ported by the EIB in 1983 should lead to the direct creation of some 33 500 jobs, mainly in industry. There is also the aspect of safe-guarding employment: loans for modernisation in industry, princi-pally in smaller scale ventures, have helped to improve productivity and strengthen firms employing about 195 000 people. Moreover, there are the temporary employment effects during construction (often for leng-thy periods) and in thé supply of necessary services and materials — this mainly concerns large-scale energy and infrastructure works. The total effect of projects assisted in 1983 should be equivalent to 480 000 man-years of work, which corresponds to some 145 000 jobs through 1983 and 1984, with pro-gressively fewer thereafter. If similar calculations made in earlier years are taken into account, it can be estimated that vyork on projects which the EIB has backed with its own and NCI funds have helped to maintain the jobs of 475 000 people during 1983.
Regional development
ECU
Below are the ECU'S values in nation-al currencies, as at 30 December 1983; these rates are applied to the present quarter in preparing financial statements and operational statistics of the Bank:
DM 2.25748 Bfrs 46.0969 £ 0.570600 Lfrs 46.0969 Ffrs 6:90358 Dkr 8.18269 Lit 1 371.99 Dr 81.7773 Fl 2.53713 IRE 0.728961
US$ 0.827370 N.B.: ECU/national currency conver-sions given in this article for oper-ations in 1983 are based on different exchange rates, applicable at the time of each contract signature.
Main thrust of the Bank's lending was to help regional development, a priority established for the Bank by the Treaty of Rome. Over 3.3 billion ECUs concerned investment in as-sisted areas which are lagging be-hind in their development or under-going severe conversion problems.
High unemployment zones ben-efited the most: 75% of the lending went to areas where the jobless fig-ures are 25% or more above the Community average.
Seen in a different way, Ireland, the Italian Mezzogiorno, Greece, North-ern Ireland and iSreenland — which are recognised by the Community as having particularly serious regional development problems — ac-counted for over 70% of the lending.
Regional financing was focused on infrastructure needed to improve conditions for development, in par-ticular:
— expanding and up-dating tele-communications in line with modern technology, and development of transport facilities^ which took roughly a third of the total;
— strengthening of electricity and gas supplies in the regions;
— sewerage, water supply and irri-gation schemes (many of the sewer-age schemes were also important in reducing pollution);
— layout and improvement of in-dustrial zones;
— reconstruction work in areas of Southern Italy damaged by earth-quakes in 1980.
A feature of particular interest was the granting of global loans to finan-cial institutions in Greece and France to support a series of local infrastructure works (e.g. secondary road improvements, harbour works, lighting and drainage schemes) Which would normally be too small for the EIB to deal with directly.
Over a quarter of regional financing went to industry, and also agricul-ture and services, mainly in the form of global loans to assist small and medium-scale ventures in assisted areas.
Industry
One of the major developments in 1983 was the increase in financing productive investment — mainly in industry ^ ^ which rose to 1 565 mil-lion ECUs (1 300 milmil-lion in 1982).
There was a more than 40% increase in global loans to banks and other financial institutions to on-lend in credits for small and medium-scale investments. In fact, nearly 3 250 credits went out during the year to help firms set up, expand, moder-nise, or make more efficient use of energy. This compares with about 1 200 credits in 1982, and 860 credits in 1981.
Over half these smaller scale invest-ments were carried out in assisted areas, so contributing to regional development. But the big difference in 1983 was the launching of New Community Instrument global loans in Denmark, France, Italy and the United Kingdom specifically ear-marked to help small and medium-scale firms in non-assisted areas.
The EIB attaches particular import-ance to expansion of global loan facilities, channelling funds to a stratum of modest-sized industry which it would be difficult for the Bank to deal with directly. Roughly a third of the firms assisted via global loans last year were concerns with under 20 employees; more than 60% had less than 50. About 525 credits went to set up new enterprises.
The European Council has repeat-edly stressed the importance of sup-porting investment by small and medium-scale firms, particularly those with high innovative potential, adopting advanced technology in their production processes òr manu-facturing high technology goods or components.
Unfortunately, the thrust of extra financing to SMEs was partially off-set by a drop in loan demand for larger industrial projects. This came to slightly more than 370 million ECUs (460 million in 1982), although there was an encouraging element in the kind, of investment financed, as several of the projects were in forward-looking sectors, especially electronics and their application in machine tools ahd industrial robots.
Energy
Another main EIB objective is to support Community aims to reduce oil import dependence by;
— improving efficiency in energy utilisation;
— development of Europe's own energy resources;
The Bank estimates that projects of. this kind that it financed during 1983 — once all are fully operational — should serve to replace 22 million tonnes of oil per year.
Taking the calculation back to 1977, the Bank has contributed (on its own and NCI resources) to energy invest-ments with a combined potential impact on oil imports of some 100 million tonnes of oil per annum. As a comparison, this is equivalent to over 20% of the Community's oil import total in 1978 (470 million tonnes).
The energy sector as such —; i.e the production and transmission of energy — took over 1 680 million ECUs, about 50% up on 1982's level.
Almost 1 billion went to energy pro-duction. Projects concerned con-struction of coal-fired, hydro and geothermal power stations, conver-sion of oil-burning plant to coal-firing, development of gas and oil fields and lignite mining. Demand for funds to finance nuclear plant continued at a lowish level (about 440 million ECUs, much the same as in the previous year, whereas finan-cing totalled some 700 million in 1981).
The main area of growth in energy sector financing (more than tripling compared with the previous year to about 700 million ECUs) lay on the transmission side, with key stretches of pipelines to reinforce the inte-gration of the European gas -net-works, and power line projects, in-cluding the under-Channel link be-ing laid between the French and British grids. There was also an ex-pansion in global-loans for funding mixed smaller infrastructure works leading to a more rational use of energy.
In fact, this last aspect — the general promotion of more efficient energy consumption — has grown steadily in importance over the last few years. Counting all the loans arid" global loan credits for industry's energy rationalisation, the total which the EIB has directed into energy efficiency investment over the past five years amounts to more than 2 billion ECUs, of which over 610 million in 1983.
Environment, European transport
Two other European alms adhered, to by the European Investment Bank are environmental protection and developing European communi-cations.
1983 saw loans for environmental protection and preservation of cul-tural heritage rise to about 130 mil-lion ECUs (against 60-(- rpilmil-lion in 1983 and 20-f million the previous year). Funds went to installations to deal, with effluent problems in the Bay of Naples, and the River Tiber and coastal zone near Rome, as well as similar projects to reduce effluent pollution at different points on the Greek and Danish coasts. A loan was also made for restoration and pro-tection of the Doge's Palace in Ven-ice, Italy's third main tourist monu-ment; part of this loan was awarded an interest subsidy from the Com-munity budget.
European communications were supported with loans worth about 125 million ECUs, split between completion of a stretch of thé Friuli motorway (link between Italian, Aus-trian, and by extension, German motorway systems), expansion of Birmingham airport.in the UK (60% of traffic is to and from other Euro-pean countries), and strengthening of the Air France fleet by purchase of five new jetliners for use on intra-Community routes.
Country breakdown
In Italy loans totalled over 2 610 million ECUs (Lit 3 515 billion), up 28% on 1982. Some 60% — 1 590 million ECUs (Lit 2 140 billion) — went to investment in the Mez-zogiorno, and this included 270 mil-lion ECUs (Lit 365 bilmil-lion) earmarked specifically for reconstruction of the earthquake-devastated regions in Basilicata and Campania.
Over a third of the loans in Italy - ^ worth about 925 million ECUs (Lit 1 240 billion) — carried a 3% interest subsidy paid from the Community budget under both arrangements agreed when Italy joined the Euro-pean Monetary System, and meas-ures to help the earthquake-hit zones.
Lending to the productive sector grew by almost 30% during the year, reaching some 1 040 million ECUs (Lit 1 400 billion). Over two-thirds of this was in the form of global loans destined for small and medium-sized investments principally in in-dustry, including equipment to im-prove energy efficiency. During the year about 1 500 credits were pro-vided from such global loans.
Larger industrial projects supported by the Bank included substantial investment in the car industry; for example introduction of advanced
automation in factories in Piedmont. Several other high technology pro-jects were supported, such as a biotechnology-based plant near Mi-lan for the production of antibiotics, manufacture in Campania of optical fibres for telecommunications, pro-duction of data and worid-proces-sing systems at factories in Pied-mont, and manufacture of auto-mated production lines by a com-pany in Emilia Romagna. ,
In the energy sector lending totalled close on 500 million ECUs (Lit 660 billion), nearly double the 1982 level. Funds vyere made available for de-velopment of oilfields both onshore and offshore in the Adriatic, ongoing work on the Algeria-Italy gasline, natural gas underground storage, construction of geothermal and hy-dro-electric power stations and con-version of an oil burning power sta-tion to coal-firing, as well as for restructuring refineries (achieving energy economies), the construc-tion of the Alto Lazio nuclear power station, and improvements to elec-tricity transmission and distribution networks, including an undersea cable linking Sicily to the mainland grid. Global loans were granted to finance smaller-scale infrastructure works such as hydro-electric
instal-lations, district heating and natural gas networks.
For better communications, loans worth almost 420 million ECUs (Lit 560 billion) went to improve and extend telecommunications, con-struction work on the Friuli motor-way (connected with the Austrian and German motorway grid) plus motorway, road, railway and tele-communications repair work in the earthquake-hit areas.
Other activity included loans for wa-ter supply and sewerage projects with treatment schemes to reduce pollution in the Gulf of Naples and River Tiber at Rome; irrigation in Molise and South Latium; layout of industrial estates in the earthquake areas and repairs to damaged uni-versity and other public service buildings, sewers, and construction of an operational base for civil de-fence and emergency services. A loan was granted for restoration of the Doge's Palace, Venice.
Lending in France practically doub-led to almost 895 million ECUs (some Ffrs 6 090 million).
develop-^ The pattern of lending within the Community from EIB own and NCI resources in 1983 and 1982 Breakdown by location, economic policy objective and sector
. ^983 · ' · 1982 Increase/decrease 1983/1982
million ECUs ^ million ECUs % Own Own Own _ _ : resources NCI Total % resources NCI Total % resources Total
LOCATION , _ .
Belgium _ _ _ _ 60.5 60.5 1.4
-Denmark 259.7 105.4 365.1 6.7 209.3 96.0 305.3 7.2 -i- 24 +• 20
Germany 152,2 - 152.2 2.8 20.8 - 20.8 0.5 + 6 3 1 +631 Gi'eece 364.3 85.3 449.6 8.2 333.6 124.9 458.5 10.8 + 9 - 2 France 707.9 186.2 894.1 . 16.4 · 424.3 37.6 461.9 10.9 + 67 + 9 4 Ireland 234.6 69.4 304.0 5.6 Λ 325.4 83.1 408.5 9.6 - 28 - 26 I'aly 1945.7 665.4 2 611.1 47.7 1588.7 449.4 2 038.1 48.0 + 2 2 + 2 8 United Kingdom . ' 591.3 ioo,1 691.4 12.6 490.6 - 490.6 11.6 + 2 1 + 4 1 Total 4 25S.7 1 2 1 1 . 8 5 467.5 100.0 3 453.2 791.0 4 244.2 100.0 23 ι 29 ECONOMIC POLICY OBJECTIVE
Regional d e v e l o p m e n t 2 843.2 507.5 3 350.7 61.3 2 626.4 467.3 3 093.7 72.0 + 8 + 8 C o m m o n European i n t e r e s t / m o d e r n i s a t i o n - c o n v e r s i o n of
u n d e r t a k i n g s 1922.1 830.9 2 753.0 50.3 1 4 4 0 . 2 466.9 1907.1 44.9 + 3 3 + 4 4 energy objectives (1) 1505.9 315.4 1821.3 33.3 1210.5 131.4 1341.9 31.6 + 2 4 + 3 6 communications, environment and other Community infrastructure 223.1 30.2 253.3 4.6 165.9 105.3 271.2 6.4 + 3 4 - 7
niodérnisation and conversion of undertakings 193.1 485.3 678.4 12.4 63.8 230.2 294.0 6.9 + 2 0 3 + 1 3 1 deduct(2) - 5 0 9 . 5 - 1 2 6 . 6 - 6 3 6 . 1 - 1 1 . 6 - 6 1 3 . 4 - 1 4 3 . 1 - 7 1 8 . 9 - 1 6 . 9
SECTOR
I n f r a s t r u c t u r e 3 1 7 9 . 5 722.7 3 902.2 71.4 2 413.1 529.7 2 942.8 69.3 + 3 2 + 3 3 energy . . . , , - 1 4 0 2 . 5 279.0 1 6 8 1 . 4 30.8 1 0 4 3 . 2 100.3 1 1 4 3 . 5 26.9 + 3 4 + 4 7 communications 1 0 4 1 . 9 82.9 1 1 2 4 . 8 20.5 830.1 228.6 1 0 5 8 . 7 24.9 + 2 5 - 6 waterschemes 255.5 - 255.5 4.7 324.7 120.8 445.5 10.5 - 21 - 43 other 204.5 293.0 497.5 9.1 153.7 80.0 233.7 5.5 + 33 + 1 1 3 globalloans 275.1 67.8 342.9 6.3 61.4 - 61.4 1.5 + 3 4 8 + 4 5 9 I n d u s t r y , a g r i c u l t u r e a n d s e r v i c e s 1 0 7 6 . 2 489.1 1 5 6 5 . 3 28.6 1 0 4 0 . 1 261.3 1 3 0 1 . 4 30.7 + 3 ι 20
individualloans(3) - - 368.5 3.8 372.3 6.8 447.2 12.2 459.4 10.8 - 18 - 19 globalloans 707,7 485.3 1193.0 21.8 592.9 249.1 842.0 19.9 + 1 9 .^ 42 Allocations from current global loans (697.8) (518.8) (1 216.6) (22.3) (518.4) - (5184) (12 2) (+ 3 5 ; ( + 7 3 5 ;
' " ^ ' ^ ^ " y (560.8) (482.4) (1043.2) (19.1) (453.5) - (453.5; (10.7) ( i 24) ( i 1 3 0 ) infrastructure : (137.O) (36.4) (173.4) (3.2) (64.9) . (64.9) (1.5) ( i l 11) ( , 1 6 7 ) (1 ) development of indigenous resources, diversificalion of imports and rational use of energy (RUE).' excluding energy-related capital investment contributing more to regional development ttian to attainment of tfie Community's energy obiectives as sucti (2) to allovK for duplication of financing justified on the basis of several objectives,
ment, e.g. improvements to the sec-ondary road system and local power lines. Larger transport projects sup-ported during the year included im-provements to the Bordeaux ring-road, and road improvement schemes in West and South West France, Lorraine and Corsica. Loans went to construction of a coal ter-minal at Montoir-de-Bretagne on the Loire Estuary to provide supplies for power stations, the modernisation and expansion of the regional tele-phone network in Nord-Pas-de-Calais and the national telecom-munications trunk system, particu-larly in the West and South-West regions, and also for purchase of five new aircraft by Air France.
Almost all the financing for indus-trial development (total almost 260 million ECUs/Ffrs 1 770 million) went as global loans, and during the year over 1 360 credits were drawn to finance smaller-scale productive investments throughout the country. At the same time, global loans for financing more efficient use of en-ergy in industry, public buildings and infrastructure, gave rise to a further 230 credits. There was also a loan for modernising a drop-forge steel mill at Ariège.
Energy sector developments totalled over 250 million ECUs (Ffrs 1 710 million) with loans backing a wide range of projects. These included work on laying a 2 000 MW cable linking the French and British elec-tricity grids under the English Chan-nel; the development of a lignite mine near Aix-en-Provence, and ex-pansion of a nearby power station to burn the fuel; modernisation of a coal-fired district heating system near Lyon, and development of geothermal resources for a district heating system in Seine-et-Marne; construction of nuclear plant (Flamanville near Cherbourg, and NERSA, Rhône Valley, power sta-tions).
In the United Kingdom lending rose by over 40% to rnore than 690 lion ECUs (slightly over £ 410 mil-lion). A substantial increase in in-dustry's take-up of funds plus de-mand from the energy sector were mainly responsible.
Industry took over 120 million ECUs (£ 70 million) principally in the form of global loans for onlending to small and medium-scale ventures; the Bank also supported a major project in Northern Ireland — de-velopment of a new aircraft produc-tion line in Belfast — and dairy modernisation, also in Belfast, as well as a glassworks in Nottingham-shire.
Energy financing totalled 300 million ECUs (£ 180 million) and went to-wards the UK end of the cross-Channel link with the French elec-tricity grid; development of the Mag-nus North Sea oil field and a section of the North Sea oil and gas pipeline grid linking Magnus and other fields; construction of the nuclear power station at Torness, East Loth-ian, and improvement of effluent treatment and disposal facilities at Sellafield, Cumbria.
Infrastructure improvements — mainly to support regional develop-ment — took over 270 million ECUs (£ 160 million). Funds went towards modernisation and extension of tele-communications in Scotland and Hull; expansion of Manchester and Birmingham airports; coal handling equipment at Workington harbour, Cumbria; road improvements in De-von, Lancashire, Merseyside, Lot-hian, the Western Isles and South Wales. Other infrastructural works included water and sewerage facilities, improved coastal de-fences, construction of small indust-rial units — carried out in Humber-side, Lancashire, Northumbria, Tyneside, Strathclyde, the Western Isles and South Wales — and two interesting methods of dealing with waste disposal: a refuse-burning plant for a district heating system in Newcastle-upon-Tyne and a plant at Hull to compact rubbish into fuel for industrial boilers.
Greece, in its third year of Commun-ity membership, saw EIB financing operations amount to about 450 mil-lion ECUs (over Dr 35 bilmil-lion), a 19% increase in Drachma, but in ECUs approximately the same amount as in 1982.
Infrastructure works assisting re-gional development accounted for more than half — almost 245 million ECUs (Dr 19 billion). Communi-cations improvements were a prime objective with loans going to wide-spread improvements to the national and provincial road networks and the Patras-Olympia highway, and ex-tension and modernisation of tele-communications. Work on sewerage schemes, many of which will have a significant impact in reducing pollu-tion, were carried out near Athens,
in Thessaloniki, in Volos and other smaller towns, and iri Crete. Loans also went to back irrigation schemes in the Boida-Mavri and Konitsa plains, Epirus, and on the South-Eastern coast of Crete, as well as to equip and extend industrial estates in the Thessaly, Epirus, Macedonia, Thrace and Peloponneso regions.
Two global loans were granted for financing mixed small-scale infra-structure works in less developed regions.
Energy investment took close to 145 million ECUs (over Dr 11 billion). Funds went to construction of hy-dro-electric power stations (total 780 MW) in Epirus, West Central Greece, and South Macedonia; for a 600 MW thermal power station in Western Macedonia and associated working of, a nearby lignite mine to fuel the plant. The Bank also funded energy saving improvements at a refinery complex.
Industrial and agricultural develop-ment were supported through global loans. for financing small and medium-scale ventures, and for farm investments and local irrigation works.
In Denmark lending rose 20% to more than 365 million ECUs (Dkr 2 955 million).
Energy investment absorbed over 85%, almost 320 million ECUs (Dkr 2 575 million). Loans went to bring natural gas from the Danish sector of the North'Sea to the mainland, to integrate the Danish gas transmis-sion system with the rest of the European gas grid by linking up with the German network, construction of gas treatment plants, and com-pressor stations, and the supply of natural gas to the Island of Fu nen; a pipeline bringing oil from North Sea fields to Jutland; improvements to a district heating grid at Esbjerg, South West Jutland; and for utilising heat from a waste incinerator on Falster Island. Global loans were made to back small-scale local in-frastructure works focusing on en-ergy production and distribution, particularly district heating systems.
Industrial development was sup-ported mainly through global loans for small and medium-scale produc-tive investments throughout the country and to encourage energy saving by firms. There was also a loan for warehouse construction in Greenland. Other projects funded during the year were sewage treat-ment works at Kalundborg (of Euro-pean significance because it pro-motes objectives of the Helsinki Convention to reduce pollution in the Baltic Sea) and harbour im-provements at Bornholm Island.
System arrangements. The year's lending showed a drop of 26% on the 1982 level, largely reflecting gov-ernment policy on public expendi-ture controls.
Three quarters of the loans, 220 million ECUs (IR£ 158 million), went ' into infrastructure improvements, the majority in communications: modernisation and extension of tele-communications; major road im-provements including urban relief and by-passes in the Dublin and Cork areas; electrification of the Dublin suburban railway. Water sup-ply and sewerage projects were as-sisted in many areas.
In the energy sector, loans went towards Ireland's first large coal-fired power station in County Clare, and extensions to the national elec-tricity grid. Industrial development was backed by loans for construc-tion or extension of advance and custom-built factories in the West of Ireland and global loans granted to help small and medium-scale indus-trial ventures, improve tourism facilities and support on-farm invest-ments.
One new aspect: the EIB agreed to make its first global loan to a com-mercial bank in Ireland — the Bank of Ireland — which will come into operation this year.
In Germany, financing totalled over 150 million ECUs (about DM 345 million). About 130 million ECUs (DM 295 million), nearly 60% of which in the form of guarantees from the EIB to enable loans to be obtained from other sources, went to energy projects; nuclear power stations at Philippsburg and Gun-dremmingen, and an East-West gas-line across Germany to supply gas from the Soviet Union to both Ger-man and French consumers. A guarantee w^as provided for a loan for a central coking plant in the Saar, and loans were made for de-velopments at a pharmaceutical concern and a new hotel in Lower Saxony.
Operations outside the Community
EIB financing operations in coun-tries outside the Community came to just over 480 rnillion ECUs in 1983, compared with about 450 million in 1982. This was made up of some 430 million from the Bank's own re-sources (covered by special Com-munity guarantees) and 50 million in finance from budgetary funds which the Bank manages on the Commun-ity's, behalf (primarily risk capital
from the European Development Fund to help industrial development in African, Caribbean and Pacific countries).
About 40% of the total lent outside the EEC —190 million ECUs —went to investment in the Community can-didate countries, Spain and Portug-al. Loans also helped development in five other Mediterranean basin countries, 18 African, Caribbean and Pacific states under the Lomé Con-vention, and 3 Overseas Countries and Territories.
SPAIN AND PORTUGAL
In Spain, 105 million ECUs were made available as part of the Com-munity's pre-accession financial co-operation arrangements. Two thirds went as global loans for small and medium-scale industrial and tourism ventures, and local public infrastruc-ture works in the less developed regions. Larger projects assisted during the year concerned improve-ments to important railway links bet-ween the port of Gijon and Leon,
and basic infrastructure improve-ments (roads, electrification, waste disposal plants and tourist facilities) in Andalusia.
In Portugal, the Bank provided loans totalling 85 million ECUs, as part of the Community's pre-accession aid package, for investments in airport improvements at Oporto and Faro, up-rating of a coal-fired power sta-tion and as global loans for small-scale investments in industry and tourism, including measures to achieve energy savings.
MEDITERRANEAN
In Yugoslavia the BanJ< helped to finance five sections of the trans-Yugoslav highway, a project very much to the benefit of the EEC as well as Yugoslavia, since the high-way will improve communications between Greece and other Member Countries, and give the Community as a whole speedier access to Tur-key and the Middle East. The loan was worth some 67 million ECUs.
O p e r a t i o n s i n t h e A C P a n d OCT
Africa .. . Botswana Cameroon
Central African Republic Congo . . . . Ivory Coast Djibouti Gabon Gitana Madagascar Malawi Nigeria Rwanda Senegal Soudan Zimbabwe Regional West Africa East Africa . Caribbean Belize Pacific . Kiribati Papua-New Guinea Total ACP OCT .
Falkland Islands .. St Kitts-Nevis French Polynesia .
Total Loans from own resources 88.00 4 00 25 00 4 00 40 00 15.00 2.00 2 00 90.00 90.00 in 1983 Risk capital opera-tions 42.26 0.40 5 10 0 48 2 43 0 05 2 50 6 00 5 00 3 40 0 70 0 50 0 20 5 00 10 00 0 50 0.60 0 60 2.00 0 20 1 80 44.86 2.70 0 20 1 00 1 50 47.56 Total 130.26 4 00 25 40 5 1 0 4 48 2 43 0 05 2 50 6.00 5 00 3 40 40 00 0 70 0 50 0 20 20 00 10 00 0 50 2.60 2 60 2.00 0 20 1 80 134.86 2.70 0 20 1 00 1 50 137.56
(
inausiry 77.26 4 00 0 40 5 1 0 4 48 2 43 0 05 2 50 6 0 0 i ) 5 00 0 40 40 00 0 70 0 50 0 20 5 00 0 50 2.60 2 60 79.86 2.70 0 20 100 1 50 82.56"'η million ECUsi
Energy 28.00 25 00 3 00 28.00 28.00 Sectors . Infra structure, 25.00 ;
'-'
i5:oo 10 00 2.00 0,20 . , 1,,80 27.00 ί ,27.00' niinmq project
In Morocco a total of 36 million ECUs went towards extending pet-roleum handling facilities at the port of Mohammedia and in building a dam in the High Atlas to serve irri-gation, water supply and hydro-elec-tric needs.
In Egypt a 25 million ECUs global loan went fo finance small and medium-scale industrial ventures.
A total 20 million ECUs (of which 5.5 million ECUs from budgetary re-sources) financing in Jordan went towards improvements and exten-sions to the electricity distribution network in Amman, and as global loans for small and medium-scale industrial, tourism, craft and on-farm investments.
In Lebanon, 5 million ECUs went towards equipping a thermal power station.
ÂCP COUNTRIES
Since the beginning of the first Lomé Convention in 1976, the EIB has carried out financing operations in 54 signatory states in Africa, the Caribbean and the Pacific, as well as several Overseas Countries and
Ter-ritories (OCT) which benefit from similar aid provisions.
The Bank's operations last year ex-tended to 18 ACP countries plus three OCT and totalled close on 140 million ECUs (90 million from the
Bank's own resources, the rest in risk capital from budgetary funds). The relatively low level of new lend-ing reflects the impact of the world economic situation on the ACP gen-erally, and the additional hardship arising — in many cases — from harsh climatic conditions. These have restricted development, and led to increasing delays in project preparation.
Manufacturing industry took more than half of the total lent in 1983. This was mainly in the form of global loans to development finance com-panies to support small-scale invest-ments, usually making the most of local products, and to enable the dfcs to finance small feasibility studies on industrial development proposals.
Energy came next, with more than 20% of the funds, essentially for hydro-electric schemes which will help several ACP countries meet their rising energy needs without worsening their oil import burden. Loans also went to telecommuni-cations and shipping improvements, mining development and several feasibility studies on mining and energy investment proposals.
EIB borrowing operations in 1983
The European Investment Bank raised just over 3.6 billion ECUs on
the capital markets in 1983 as against 3.2 biilion the previous year. (N.B. borrowings to resource the New Community Instrument are separate and are made in the name of the European Economic Com-munity).
Nearly 64% of the ElB's borrowings — over 2.3 billion — was through public bond issues. Private place-ments secured about 1.2 billion, while slightly over 110 million came from the sale to third parties of participations in EIB loans, guaran-teed by the Bank.
Borrowings were concluded for just over half the total in Community currencies, including the ECU:
— Deutsche Mark 19.9% (equiv-alent 721 million ECUs), guilder 10.5% (380 million ECUs); ECUs 6.4% (230 million); pound sterling 4.8% (176 million ECUs); Belgian francs 4.4% (161 million ECUs); French francs 4 . 1 % (149 million ECUs); Luxembourg francs 1 % (35 million ECUs);
and in non-Community currencies:
— United States dollars 25.1% (908 million ECUs); yen 12.9% (468 mil-lion ECUs); Swiss francs 7.9% (285 million ECUs); Canadian dollars 2.1% (76 million ECUs); Schillings 0.9% (32 million ECUs).
new lease of ecoriomic life for Europe?
by Professor J.H.P. Paelinck*
Although there have been signs of late of an improve-ment in the economic situation, one thing Europe does not lack is forebodings about its long-term future. We are still being assailed by reports of Japanese imports and the steps being taken to contain them. Over the longer term, we are con-fronted with the fact that, between 1970 and 1980, the United States managed to create 21 million jobs while we in Europe achieved only 400 ODD. Indeed, over a longer period still - 1963 to 1983 - they notched up several dozen million new posts while we were in the process of losing a round million.
Statistics like these and other glaring facts — in 1981, Europe's technology balance with the rest of the world was in deficit; Philips is to include the
Japan-ese VHS system in the range of videotape recorders it produces — beg the question: in what direction can Europe develop over the years to come — in what direction must it develop? Which way, in other words, should we steer production to gain a new lease of economic life, for the countries of the European Community, and what should be the main thrust of our future investment policy, remembering not least just how much Investment has declined over the last ten years? The problem of steering productive activ-ity in EEC countries into new growth was an apt choice of theme by the European Investment Bank for its 25th Anniversary Symposium (November 83), when it commissioned a Netherlands Economic Insti-tute (NEI) study on potential future European invest-ment strategies.
The problem is anything but simple; there are no ready solutions. By what yardstick can the effectiveness of guidelines for future production be measured? How might we choose between any that appear promising? One of the things very
much to be borne in mind would be
those trumps that the countries of the EEC might be able to play in answer to the stakes put up by the Americans and the Japanese, the "big bidders" in the world trade game. This article is an attempt to explore one of the possible ap-proaches to this problem, and to
come up with various conclusions of concrete operational value.
Future activity
Clearly, the first question to be tack-led is that of establishing which activities actually hold promise: the serious business of restructuring potential in the agricultural, indus-trial and service sectors in the years to come.
Economists have identified various sources of information. Firstly, there is international trade, and in partic-ular statistics on relative rates of expansion in world markets: infor-mation from that quarter, although valuable, does have its limitations — it relates only to the past, and does not necessarily lend itself to ex-trapolation; it is confined to pro-ducts (omitting services, on which there is a relative dearth of statistics) and only covers part of productive or consumption activity, inasmuch as it stems from particular factors, espec-ially those which dictate compara-tive advantages in international trade.
Hence the need to supplement infor-mation from these sources by studies and statistics directly con-nected with the probabilities for the expansion of certain types of pro-duction. This in fact, means
economic studies with a technolo-gical bias, calling for more direct knowledge of the activities in ques-tion. Experts with a specialist inter-est in given types of products ahd services are in a position to predict which areas of production are likely to attract the most effort in the fut-ure and what market potential exists in research and development laboratories and services. This sort of information can be confirmed by analysis of those categories of goods and services that have come to be dubbed "leading edge", i.e. those which feature or deploy the latest, most promising technological developments.
This involves a very delicate sifting process: the critical assessment of economic and technological find-ings and a modicum of the most objective possible appraisal of those very few hard facts that can be pick-ed out of all the wealth of literature that exists. The following table is the result of a series of such sifting operations, presenting the data available for 1983 according to the "chains of distribution" in each case, i.e. showing the connections between a range of basic, physical productive activities and the ulti-mate service-sector activities steni-ming from them.
[image:8.589.54.539.337.817.2]Certain remarks are in order here. Table 1 in fact systematically fea-tures those very activities that so often come up in discussions on prospects for the distant future, namely mechanical engineering (e.g. robotics), chemicals (e.g. biotechnology) and energy (new sources). Also appearing are those services that emanate from recent developments, such as the use of microprocessors (a case in point: teleinformatics), but of still greater interest are the other elements that the tabulation brings to light. It draws a distinction between three phases (the "upstream", "intermed-iate" and "downstream" phases) in each of the chains identified: the component phase (e.g. microchips), the structural phase (a microcom-puter is such a structure) and finally the service phase, making use of what is produced in the structural phase (e.g. teleinformatics). A furth-er point that emfurth-erges from the sche-ma is the distinction between pro-duct innovation and process innova-tion, the latter being a phenomenon apparent in both new and ; estab-lished activities (much mentioned, in this connection, is the introduction of robotics, or in more general terms, of FAS — flexible automation-systems). Agricultural activity is not
Table 1
Cham Phase I (upstream) Phase II (intermediate)
Transport equipment. Electncal assemblies. Domestic appliances, Precision instruments
Phase III (downstrearr)
1
2.
3
4.
5.
6.
Aeronautics
Railways
Energy
(modern forms)
Electronics
Chemicals
Mechanical engineering
Aircraft components
Railway equipment components
Construction of generating units
Components (microprocessors, bubble memories, etc )
New basic chemical combinations
Components (including 4)
Aircraft construction
Railway equipment manufacturing
Energy distribution. District heating
Office systems. Informatics.
Process applications. Domestic appliances
Glass.
Parachemical products (fibres, plastics, etc ) Pharmaceuticals
Machine tools, Industrial equipment.
Air transort and allied activities
Rail transport and allied activities
Trade
Trade, Repairs,
Telecommunications
Trade
Trade, Repairs
7. Civil engineering Materials
(especially new ones substrates, etc )
Services to construction companies.
Works
Infrastructure. Housing
8. Health
9 Communications
Pharmaceuticals. Equipment
Equipment
Medical services
Telecommunications, Other service activities
mentioned specifically, but it does of course have affinities with modern biotechnology (enzyme fertilizers and new, highly robust vegetable strains like IR-30 rice etc.).
These products, or rather, in more general terms, these new activities, have reached different stages of de-velopment in different countries around the world. Japan and the United States are frequently to the fore, but into the picture also come the "newly industrialised" countries like Hong Kong, Taiwan, South Korea, Brazil and Mexico, which are involved too in the technological treasure hunt. Just where in the field do the Community countries life as that race, which should sweep the world economies well into the twenty-first country, gets under way? It is to that question that the following section is addressed.
Europe's strong points
The reasons why economies should show the faster or slower rates of growth described above have been the subject of considerable re-search. But our immediate concern here is specific goods and services, and this calls for a novel approach, to arrive at an explanation for the positions occupied by those vying for the laurels in the world of pro-ductive enterprise. That approach is based on the idea of the "profile", i.e. quite simply a range of features pertaining to a given unit, such that the components of the profile are determined by the unit analysed and the aim of the analysis. The present study however represents a new de-parture, inasmuch as simultaneous use is made of two such profiles, one relating to the product and the other to the country of production: any non-congruence between the two would explain why a country might be relatively low-placed on the "league table". Equally, congruence or non-congruence between the two profiles might vary in extent accord-ing to the product under consider-ation: a country might be well suited to production of a certain range of goods, or it might be less so.
In constructing and quantifying this model, the object of the exercise was to arrive at an assessment of the relative importance of the compon-ents of these profiles — more details of which will be furnished presently — as means of explaining the way different countries — the United States, Japan, those of the EEC and the newly-industrialised countries — are placed in the running when it
comes to the drive for new products, which was the subject of the central study. Of course, the development of this model is still at an early stage, where — hopefully, only for the time being — it remains static, or rather "comparatively static", in the sense that it endeavours to explain the relative positions occupied by the various countries for those items of production taken into consider-ation; at a later stage in the re-search, it should be possible to in-troduce dynamic factors that will explain movements in those relative positions over time.
This is not the place to dwell on the mathematical and econometric minutiae of this model*, which has been applied to a range of products corresponding to the activities schematised in Table 1. The figures are those for 1980. What the exer-cise does is to relate to one another the following: capital intensiveness, the degree of specialisation in the activity concerned, research and de-velopment and energy intensive-ness, the scale of production (sec-ondary sector), the general level of industrial production in the country concerned, its home market, the skill· level of its workforce, a "busi-ness environment risk index", the ratio of residual income to Gross Domestic Product, a research and development yardstick and the de-gree of self-sufficiency in energy that the country enjoys. These vari-ables were selected partly according to the needs dictated by the study and partly on the basis of the statis-tics available.
Table 2 (page 10) sets out the first findings to emerge from this study.
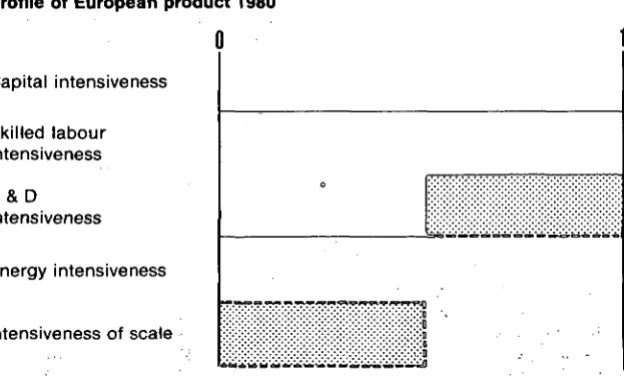
The breakdown yields four groups, the first being the "Big Three", those
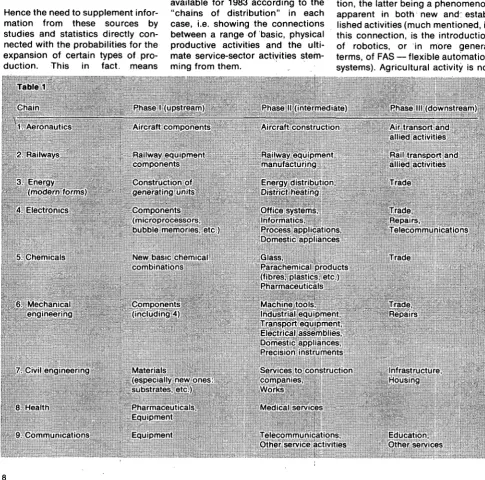
Profile of European product 1980
Capital intensiveness
Skilled labour intensiveness
R & D intensiveness
Energy intensiveness
countries that dominate the compet-ition in world markets: Germany as a Community country, the United States and Japan (whose experts consistently compare its perform-ance with those of Germany and the USA). Then comes a group of coun-tries that are industrially quite well placed (France, Italy, the Nether-lands, Belgium and Luxembourg — linked by their economic union, the BLEU — and the United Kingdom). These are followed by the main group of newly industrialised coun-tries — Singapore, Argentina, Hong Kong and Mexico (with Brazil hard on its heels) — and, bringing up the rear, a miscellany: Denmark, Pakis-tan, India, South Korea, Ireland, Greece, Malaysia and Thailand. It should here be repeated that this ranking relates only to those pro-ducts that were analysed and that the "residue" remaining after the "explanation" furnished by the mod-el serves to explain the positions occupied on the list by certain coun-tries. An econometric model can in fact never offer 100% explanations, whereas it is only the "explained" part of a phenomenon that can be used for derivations like those in Table 2. Secondly, if one takes those groups of products for which the EEC countries are not competing in the market with the newly industrial-ised countries, but are holding their own with the United States and Ja-pan*, then their profiles show that all have a low or medium elasticity of scale of production and a low en-ergy input, a high skilled labour requirement, a high to medium R & D content and a generally low capi-tal input.
* Brief particulars of the structure are provided in the technical annex to this article, which can be obtained on request from the EIB Docu-mentation and Library Division.
0
0
^ ^ , „
Intensiveness of scale
(the dark blue section consistently emerges with all products; the dotted light blue section only with some.)
[image:9.589.219.531.579.767.2]Table 2: Ranking of the analysed
Country
West Germany United States Japan
France Italy Netherlands
countries
calci foi
Value jiated • each country profile*
Belgium - Luxembourg United Kingdom
Singapore Argentina Hong-Kong Mexico
Brazil Denmark Pakistan India
South Korea Ireland Greece Malaysia Thailand
3.55 3.53 3.50
1.53 1.47 1.40 1.19 1.19
1.05 1.03 1.02 1.00
0.95 0.93 0 91 0.90 0.67 0.66 0.57 0.51 0.39
• The numencal scale that here emerges IS one of the products of the model used, and as far as interpretation is concerned tho size of the figures is the only con-sideration of interest
Such would appear to be the profile for activities offering promise in the various Member Countries of the EEC, based on an analysis of the situation in 1980 and using the mathematical model already de-scribed. That profile does in fact seem to accord with the general pattern of the EEC countries' pro-files: moderate investment
incen-* In order to single out those products with which Europe stands a real chance of success at the present time.
fives, more than adequate R & D, a none-too-abundant supply of ener-gy, a relatively well trained work-force and isolated national markets: The typical profile for such a leading edge activity in the EEC countries in 1980, illustrated in terms of extreme contrasts, would thus be as shown in the diagram on page 9.
Such a "battle product" we might dub "long-nosed", after this physical profile (in contrast with the "wide-brimmed", "big-footed" profile that emerges for the products typical of the past upiswing, during the post-war period, with their high intensive-ness of capital and scale), although this is just a terminological ploy for expressing know-how or product values having a high service con-tent.
To put it another way, these pro-ducts do not arrive "free on board": there is a service content, of greater or lesser proportions, running from operating instructions through to maintenance and operator training throughout their useful life. In domestic appliances and motor veh-icles, these do hot amount to very much, whereas with computers soft-ware represents a service of consid-erable value. The econometric analysis carried out seems to indi-cate that thé EEC Member Countries could make real progress in the field of advanced services and carve out a commanding position (i.e. a com-parative advantage) by virtue of a policy designed to produce an economic upswing.
Instructive also is the position oc-cupied by Germany (see Table 2): it ranks first for industrial production, for the size of. its home market, for its trading conditions and for re-search and development; second for energy (after the United Kingdom); third for unearned income (after Greece and Italy), and fourth for the calibre of its workforce (after the United Kingdom and the Benelux, although this depends on the
yard-Table 3: Improved performance ratings
Ranking under Table 2 New ranking
1. West Germany 3.55 4. France 1.53 5. Italy 1.47 6. Netherlands 1.40
7. Belgium/Luxembourg . . . 1.19
8. United Kingdom 1.19 14. Denmark 0.93 18. Ireland 0.66 19. Greece 0.57
1. 4. 5. 6. 7. 8. 9. 10. 15.
3.96 1.94 1.88 1.81 1.60 1.60 1.34 1.07 0.98
stick used). Moreover, its industrial production and its home market are not much smaller than those of Ja-pan (about 95% and 80% respective-ly). All of which seems to point to the existence of a threshold value for sustaining production levels and market potential, a value that Ger-many has apparently reached. That same fact could also explain why Japan, with a domestic market 25% greater than that of Germany; is putting every effort into scaling up its potentialities through its aggres-sive export policies. Germany's bril-liant export performance would seem to bear out this interpretation.
By way of probing further the impact of the sum total of factors referred to above, a further simulation using the model described was run, but this time with the following variables for the EEC countries modified as fol-lows:
a) allowance was made for progress in the economic integration of Europe by weighting production, markets and research and develop-ment at the European level, so as to have these variables express the Community's integration of input and output markets and denote ac-cess to the results of European-level research and development;
b) the "business environment risk index" — expressing the likelihood of a project achieving success^^ was set at the optimum: 100 f o r a l i EEC countries.
For the immediate future, this is of course a far from realistic assump-tion, but it does not affect the overall outcome, as will presently become clear.
Making these adjustments produced a marked improvement in the rank-ing of the EEC countries, as the Table 3 shows.
Bearing in mind also that the United States and Japan were placed sec-ond (3.53) and third (3.50), the, fol-lowing points should perhaps , be made:
a) 75% of the additional impact is attributable to the opening-up of new markets (probably an under-estimate), 20% to access to Euro-pean research and development, and only 5% to improved marketing prospects, including.integrated pol-icy measures, to the extent that it was possible to include these in the index used in the model;
b) the overall impact is probably an under-estimate, as it does not reflect
[image:10.589.55.377.607.789.2]the workings of. other variables, such as improvements in marketing strategy designed to exploit the op-portunities: presented by the three abovementioned factors;
c) a further result is that new pro-duct profiles, especially those cal-ling for the.broadening of scale, will also become accessible to the EEC countries' production potential: this can be proved by the simulation described below.
There is obviously still a consid-erable gap between the "Big Three" and the nine EEC Member Countries other than Germany, ,and it must now be equally clear that better in-tegration of the economies of Europe could give a further boost to growth. A further simulation was in fact run, this time for the EEC as a whole, setting both industrial pro-duction and final markets at the European level, pitching labour skills and business environment at the highest level in Europe, profit-ability at the Japanese level, R & D at the U.S. level and energy supply at the level for Europe as a whole. The outcome was as might be expected: for the products under considera-tion, the EEC comes out with a rating of 5.0, as compared with 3.5 for the United States and Japan, with by far the largest share of the in-creaise traceable to integrated pro-duct and market access, though in comparison with Japan, the increase in energy supply also impinges. Once again, it is abundantly clear that closer European integration of-fers new lines of production a better fighting chance.
This brings us to the final section of the study: pinpointing those act-ivities that stand a real chance of achieving growth for the countries of the EEC.
Alternatives for Europe
To establish the field of choice be-fore Europe, a number of viewpoints can be taken, with the aim oif con-ducting a later selection.
To return, firstly, to Table 1: the selection could bemadefrom Phase I ("upstream" activities). Phase II. ("intermediate" activities) or Phase III ("downstream" activities). This in turn requires knowledge of the re-spective merits of addressing one-self to any particular one of these points of departure.
The thing to bè gained from stimulating downstream activities is
the creation of a market for inter-mediate and upstream activitieSi but this is not to guarantee that the stimulus will operate in Europe, apart from which the regional im-pact-will probably 'be greater in those areas where potential "access is greater and where technical in-novation finds more fertile ground.
Stimulation of intermediate act-ivities could indirectly trigger up-stream activities — with the same reservations as before — but would not necessarily create final markets; the' same argument applies, a for-tiori, to'upstream activities as such.
All this seems to point at starting with downstream activities — an ap-proach consistent with certain as-pects of what Japan practises — especially if those activities are of European scale, to the extent that their effects work through to inter-mediate and upstream activities throughout the ten EEC Member Countries, and thus in turn tend to stimulate increased demand there from the technology and trade view-point. Furthermore, it will be neces-sary to isolate and analyse each and every obstacle, whether financial, human, commercial or perhaps technological. If this idea is squared with that of the typical European "leading edge" activity profile, we might well be left with the following chains:
a) air transport and space projects requiring European-type construc-tion facilities;
b) new rapid rail links (inter-city, inter-regional and international);
c) integrated energy systems and their applications (urban, regional, international);
d) telecommunications and data-base services;
e) civil engineering projects (coas-tal, environmental and urban);
f) health projects^
One major area for expansion here comes to the fore: the downétream activities here in all cases are service functions—once, that is, the investments have been carried through ^ -for which reason they are fully con-sistent with the 1980 "European pro-file" for highly labour-intensive ac-tivities using a skilled workforce. A programme —again vertically integ-rated through the upstream and
in-termediate phases also — could be developed to launch service act-ivities to be .pursued in non-Com-munity countries. It is recommended that thought be given to the scope for getting such projects off the ground and formulating operational plans for that purpose. The develop-ing countries in particular need in-frastructure of the kind referred to above, while it is a known fact that the OPEC countries too are general-ly interested in this kind of project.
For the two groups of activities de-scribed above, the study cites vari-ous concrete activities not repro-duced in this summing-up.
There' is also a third line of thought concerning what happens when advanced processes are introduced into Europe's conventional sectors of activity, i.e. process innovation, as opposed to product innovation. The point at issue is a familiar one, that the direct effect on employment of the introduction of these activities is generally considered negative. The real question however is whether that is the actual case, when every-thing is taken into account, includ-ing indirect and multiplier effects. Take the competitiveness of Euro-pean activity (in industry, agriculture and services) on both home and foreign markets, and the known fact that that quality is related to the introduction of such technology (robotics and FAS). Thus seen, the deployment of new methods may not only guarantee employment levels, but may also serve to raise them, especially if the European market as a whole is taken into account. The simulations to which reference has already been made well illustrate this important consid-eration. In this respect, the findings tally with those drawn from the mod-el discussed previously: the line of argument referred to above stem-med from another model in which there were brought together both the direct and the multiplier effects of the production processes in ques-tion.
Fourthly, there is the whole field of upstream products (components and' parts) already alluded to as parts of an integrated strategy — indeed, any "intermediate" activity is vitally dependent on the availability of advanced building units, such as;
— electronic components: micro-processors, sensors, bubble memories, superconductors and biochips;
— Chemical and biochemical mate-rial: new fibres, composite plastics, new ceramics, "synterials", new al-loys, metallic glasses, enzymes and recombinant DNA.
As far as the latter group is con-cerned, it should be pointed out that chemical and biochemical.products did not appear in the list; of Com-munity-profile products, although the chemicals industry is currently in transition, going over from heavy chemicals to fine or special chemi-cals and biological "engineering". For these products — most of them integrated into the structures al-ready referred to — which accord with the 1980 "European profile", there is certainly scope for produc-tion in EEC countries. They form a voluminous series, only some elem-ents of which appear above.
Finally, thought was given to the regional impact of future activities, especially as they will affect regions whose development is lagging, along the lines explored in the chap-ter on the development of backward regions in "Investing in Europe's future", the book published by the EIB to mark its twenty-fifth anniver-sary. For regions where access and receptivity to innovatory activity is limited, the logical thing to recom-mend is action at the base, i.e. up-stream. This could be in support of innovatory and technological centres (leading to the creation and deployment of new technology), sci-ence parks, local concentrations of innovatory companies (like the ZIRST near Grenoble), activities tending to facilitate technology transfer from one firm to another, the dissemination of information and access to networks. Japan for instance does not confine itself en-tirely to downstream activities, but is at present exploring the concept of a "technopolis", which would be a kind of advanced form of the tech-nological "growth centre" idea.
The list that now emerges begins to look quite impressive in its scope, but this then raises the question of the batting order: how great or how small is the chance of success in each case, and how should the priorities therefore be ranked? It was to this question that a final study was addressed, of the "multi-criteria" variety: the rest of this arti-cle takes up its main points.
Ranking Europe's chances
In the light of the analytical studies described above, an evaluation was
made of the chances that "emer-gent" activities have of achieving breakthrough, applying the follow-ing criteria:
a) the requisite scale of production and of the market;
b) requirements in the areas, taken separately, of research and develop-ment, professional qualifications and energy;
c) current market positions;
d) contributions to Europe's exter-nal and technological positions;
e) effects on employment and on balanced regional development, taken separately.
If the "employment" criterion is ex-cluded, a priori, and the above criteria are assessed in decreasing order of importance, the following result emerges: the best-placed act-ivity is electronic equipment, fol-lowed by energy structures; medical equipment and optical transmission systems then occupy the middle ground, while export projects, auto-matic guidance systems and science parks or high-tech estates come in an average-to-weak position. At the bottom of the classification come downstream projects, followed by components and "mechatronics".
The exercise was then repeated, with the employment criterion work-ed in, and drawing a distinction bet-ween production and introduction of "mechatronics", assuming also that Europe's production facilities are also functioning at a genuinely European level, i.e. for a European market. The most spectacular result of this operation, compared with the previous findings, stemmed from the introduction of mechatronics, a pro-cedure that is extremely attractive.by virtue of the relatively high scores it achieves in relation to the major criteria. Also, compared with the previous results, optical transmis-sion systems and medical equip-ment move up the optimal project ranking list. Energy structures, on the other hand, remain very much in contention, while electronic equip-ment, perhaps the first choice when related to integrated local European markets, joins the ranks of those projects that perform less well throughout this exercise: the down-stream group, the components programme and production of mechatronic products.
The' study demonstrates once again how fundamental the achievement
of a true European market is to securing Europe's participation in those changes that our countries must join their world partners in making to bring us all to the threshold of the twenty-first century. What remains now is to suggest ways in which the findings of the study might be acted upon, and this would appear to be a question of organised action at European level, with the provision of machinery for;
— the permanent, long-term pool-ing of ideas (promispool-ing groups of products, application of research and development to a broad band of products, rapid response to newly-emerging or embryonic markets);
— analysing the technical and economic minutiae of the findings described above and, to that end, establishing a data bank to make permanent monitoring possible;
— investigating the practical feas-ibility of integrated projects; tech-nical and financial scope and mar-keting possibilities.
America and Japan, with their mar-ket economies, are already equip-ped with institutions responsible for assuming these various tasks, but Europe will have to respond to the challenge by taking a fresh initiative.
EIB-INFORMATION is published pe-riodically by the European Invest-ment Bank in seven different languages (Danish, Dutch, English, French, German, Greek and Italian).
Material which appears in EIB-INFORMATION may be freely repro-duced; an acknowledgement would be appreciated and also a clipping of any article published.
100, bd Konrad Adenauer L-2950 Luxembourg tel. 4379-1 - telex 3530 bnkeu lu
telecopier 43 77 04
Department for Italy: Via Sardegna, 38 - 1-00187 Rome t e i 49 79 41 - telex 611130 bankeu i
telecopier 474 58 77
Representative Office in Brussels: Rue de la Loi 227
B-1040 Brussels
tei 230 98 90 - telex 21721 bankeu b telecopier: 230 58 27
Liaison Office for the United Kingdom: 23, Queen Anne's Gate, Westminster
London SWIH 9BU t e i 222 2933 telex 919159 bankeu g ;
Telecopier 222 2936
Printed in Luxembourg by éditpress luxembourg, 44, r. du canal. Escfi/Alzette