White Rose Research Online URL for this paper: http://eprints.whiterose.ac.uk/88051/
Version: Accepted Version
Article:
Brown, LE, Dickson, N, Carrivick, J et al. (1 more author) (2015) Alpine river ecosystem response to glacial and anthropogenic flow pulses. Freshwater Science, 34 (4). 1201 - 1215. ISSN 2161-9549
https://doi.org/10.1086/683062
eprints@whiterose.ac.uk https://eprints.whiterose.ac.uk/
Reuse
Unless indicated otherwise, fulltext items are protected by copyright with all rights reserved. The copyright exception in section 29 of the Copyright, Designs and Patents Act 1988 allows the making of a single copy solely for the purpose of non-commercial research or private study within the limits of fair dealing. The publisher or other rights-holder may allow further reproduction and re-use of this version - refer to the White Rose Research Online record for this item. Where records identify the publisher as the copyright holder, users can verify any specific terms of use on the publisher’s website.
Takedown
If you consider content in White Rose Research Online to be in breach of UK law, please notify us by
FWS MS 14-043
1 LRH: Alpine river ecosystems L. E. Brown et al.
1
RRH: Volume 34 December 2015
2
3
Alpine river ecosystem response to glacial and anthropogenic flow pulses
4
5
Lee E. Brown1,3, Neil E. Dickson1,4, Jonathan L. Carrivick1,5, Leopold Füreder2,6
6
7
1
School of Geography and water@leeds, University of Leeds, Woodhouse Lane, Leeds, LS2 9JT
8
UK
9
2
Institute of Ecology, University of Innsbruck, Technikerstrasse 25, A-6020, Innsbruck, Austria
10
11
E-mail addresses: 3l.brown@leeds.ac.uk; 4neilsletterbox@gmail.com; 5j.l.carrivick@leeds.ac.uk;
12
6
leopold.fuereder@uibk.ac.at
13
14
Received 3 April 2014; Accepted 16 January 2015; Published online XX Month 2015.
15
2
Abstract: Alpine glacier-fed river hydrology, chemistry, and biology can vary significantly in
17
space and over diurnal to interannual time scales as a function of dynamic inputs of water from
18
snow, ice, and ground water. The sensitivity of biota to these water-source dynamics potentially
19
makes them susceptible to hydrological changes induced by anthropogenic activities, such as
20
flow regulation, but most alpine studies have been focused on intact rivers during summer only.
21
We examined the spatiotemporal dynamics of physicochemical habitat and macroinvertebrate
22
assemblages in a high-altitude (>2000 m) floodplain in the European Alps over an 18-mo period.
23
We present a novel insight into the river system and macroinvertebrate assemblage responses to
24
natural glacier-melt-driven expansion–contraction of unregulated river sites and to intermittent
25
flow pulses caused by hydropower regulation. Mainstem glacier-fed sites had cyclical seasonal
26
dynamics in macroinvertebrate assemblage composition that shifted to be partly reminiscent of
27
groundwater tributaries in winter then back to melt water in the following spring. Significant
28
unimodal relationships were found between glacial influence and macroinvertebrate assemblage
29
density, richness, Simpson's diversity, evenness, and diversity. These relationships suggest that
30
glacial influence can positively affect biodiversity where glacier melt water mixes with
31
nonglacial water and habitat diversity is maximized. Regulation-induced flow pulses led to
32
inconsistent responses among macroinvertebrates, with no significant effects in summer 2008 but
33
increased density and decreased taxonomic richness in 2009. Assemblage composition was
34
unaffected by reservoir releases despite significant increases in water temperature and discharge
35
at these times. The effects of alpine river management for hydropower production on
36
macroinvertebrate assemblages in this river system appear to be relatively minor, but further
37
studies should be undertaken in other alpine locations to assess the generality of this finding.
38
Key words: flood-pulse, glacier, groundwater, hydropower, macroinvertebrate, reservoir
3 Alpine zones are found on all continents between the treeline and permanent snowline,
40
and they host an array of glacier-melt, snowmelt, groundwater, and mixed-source rivers that
41
provide considerable heterogeneity of habitat and biodiversity (Füreder 1999, Brown et al.
42
2003). Recent research has highlighted the potential loss of biodiversity from these systems with
43
glacier retreat via alterations to river flow, water temperature, geomorphology, and water
44
chemistry (Brown et al. 2007, Jacobsen et al. 2012, Cauvy-Fraunié et al. 2014). Alpine aquatic
45
ecosystems appear to be particularly sensitive to environmental change because of strong system
46
linkages between climate, water sources, physicochemical habitat conditions, and biodiversity
47
(Hannah et al. 2007, Brown et al. 2009). Understanding of these linkages has developed mostly
48
from space-for-time approaches, often used along gradients of meltwater contribution, catchment
49
glacial cover, or multivariate glaciality indices (Milner et al. 2009). However, to date, detailed
50
gradient studies on alpine rivers have focused on data collected during the summer melt season
51
only. Thus, such approaches need to be evaluated more thoroughly over annual time scales.
52
Glacial river systems exhibit considerable seasonal physicochemical habitat change
53
associated with the glacial flood pulse (Malard et al. 2006, Cauvy-Fraunié et al. 2014). Increased
54
snow and ice melt during late spring/early summer leads to the lateral expansion of channel
55
networks across floodplains, and melt water mixes with alluvial and hillslope ground water in
56
varying proportions (Malard et al. 2006). Alpine braided flood plains are ideal for studying these
57
hydrological gradients because rivers with different water sources are colocated within short
58
distances and, thus, are not confounded by altitude, meteorological, or geological/pedological
59
effects. For example, Burgherr et al. (2002) showed that high habitat heterogeneity across the
60
Val Roseg, Swiss Alps, supported considerable macroinvertebrate biodiversity. Although a few
61
investigators have examined stream temperature dynamics across floodplains above the treeline
4 (Carrivick et al. 2012, Dickson et al. 2012), the relationships among hydrology, physicochemical
63
habitat, and macroinvertebrate assemblages have yet to be reported for these rivers. These alpine
64
systems lack mature vegetation, so allochthonous detritus inputs to river food webs are relatively
65
low. Groundwater stream dynamics in alpine regions also may differ from those below the
66
treeline because lower vegetation biomass and lower temperatures should mean they are
67
influenced less by evapotranspiration of soil/groundwater.
68
In addition to hydrological dynamics linked to meltwater inputs, many alpine river
69
ecosystems, particularly in Europe, are compromised by anthropogenic regulation for
70
hydropower generation (Füreder et al. 2002, Wehren et al. 2010). However, little is known about
71
anthropogenic regulation effects on alpine rivers because most studies have focussed on
sub-72
treeline rivers below the reflux point of hydroelectricity generating stations (e.g., Brunke 2002,
73
Céréghino et al. 2002, Maiolini et al. 2003). An exception is the study by Petts and Bickerton
74
(1994), which showed that abstraction close to the glacier margin in the Borgne d’Arolla,
75
Switzerland, meant rivers were devoid of fauna because of intermittent flow and frequent turbid
76
purging flows. In contrast, further downstream, the reduction of glacial melt as a proportion of
77
flow (cf. ground water) ameliorated the harsh physicochemical habitat allowing a broader range
78
of macroinvertebrates to colonize. High-altitude reservoir outflows can cause large changes in
79
river discharge (Anselmetti et al. 2007, Wüest 2010) and water temperature (Dickson et al.
80
2012), but no investigators have yet examined the impacts of alpine reservoir releases on benthic
81
macroinvertebrate assemblages. In Europe, such studies are vital to reconcile requirements of the
82
Water Framework Directive (2000/60/EC) with those of the Renewable Energy Directive
83
(2009/28/EC), particularly in alpine systems, which have unique biodiversity but significant
84
potential for hydropower (Alpine Convention 2009).
5 We aimed to address the research gaps outlined above by undertaking a year-round study
86
of macroinvertebrate assemblage distribution and diversity across the Eisboden floodplain, Hohe
87
Tauern, Austria, which at certain times of the year is impacted partially by outflow from a
88
hydropower reservoir. We tested the hypothesis that (H1) the river physicochemical environment
89
and macroinvertebrate assemblages would show a clear seasonal dynamic caused by natural
90
hydrological changes linked to summer glacial meltwater pulses (Malard et al. 2006). We also
91
expected that (H2) benthic macroinvertebrate assemblages would show unimodal responses to
92
physicochemical habitat dynamics linked to spatial dynamics (i.e., from predominantly ground
93
water to glacial sites; Brown et al. 2007) and changes between time periods linked to the annual
94
melt cycle. These responses should be a consequence of meltwater regimes restricting species to
95
cold water/disturbances specialists, but mixing with warmer ground water, thereby maximizing
96
diversity (Jacobsen et al. 2012). Last, we expected that (H3) overspill from a storage reservoir in
97
late summer would disturb the natural flow pulse and unimodal patterns of H2, leading to
98
significant changes in macroinvertebrate assemblages at impacted sites. We discuss our findings
99
in the context of previous work on flood-pulse dynamics, alpine river ecosystems, and the effects
100
of regulation flood flows.
101
102
METHODS
103
Study area and sampling design
104
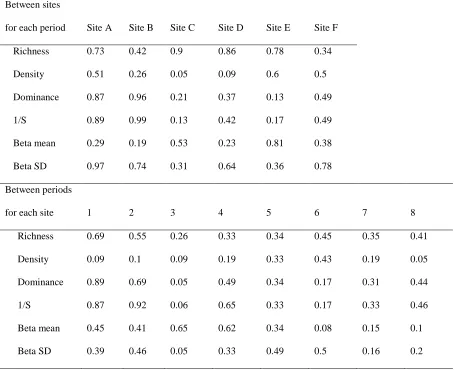
The Ödenwinkelkees catchment (9.2 km2, 19.5% glaciated) is partially within the Hohe
105
Tauern National Park, central Austria (Carrivick et al. 2013). The catchment occasionally
106
receives additional runoff from basins to the west via the Wei see hydropower storage lake
107
(surface area = 0.5 km2, maximum depth = 51 m, volume = 15.7 Mm3, Dickson et al. 2012). The
6 Weißsee collects runoff directly from the Sonnblick Glacier river and water routed underground
109
in culverts from Amartaler See (4.3 km west-southwest, 2276 m asl) and Salzplattensee (5.3 km
110
west; 2294 m asl). The Weißsee is not used as a direct feed for hydropower generation. Instead,
111
it serves as secondary storage with water routed to a larger downstream lake (Tauernmoossee)
112
predominantly via the Eisboden and, occasionally, via a river and tunnels in an adjacent valley
113
(Fig. 1).
114
We monitored 6 sites along part of the Eisboden River, which is sourced from the
115
Ödenwinkelkees (terminus 2197 m asl). The 6 study sites were arrayed across a floodplain 1.5
116
km downstream from the glacier (2099 m asl; Fig. 2A–D). We selected sites on 3 river types:
117
main glacial river (sites A, B), mixed channels (sites C, D), and groundwater tributaries (sites E,
118
F), so that the contrasting hydrological dynamism would provide a gradient from harsh glacial
119
systems to relatively benign groundwater streams. We selected the 2 main glacial river sites
120
because they defined the main inputs (site A) and output (site B) of the Eisboden, and
121
specifically because site B was known to be periodically affected by dam overspill and active
122
water releases from the Wei see, whereas site A could serve as an unimpacted control. Overspill
123
from the Wei see commenced on day 230 (19 August) in 2008 and 213 (1 August) in 2009, once
124
the capacity of the reservoir was exceeded. Active water releases were more variable depending
125
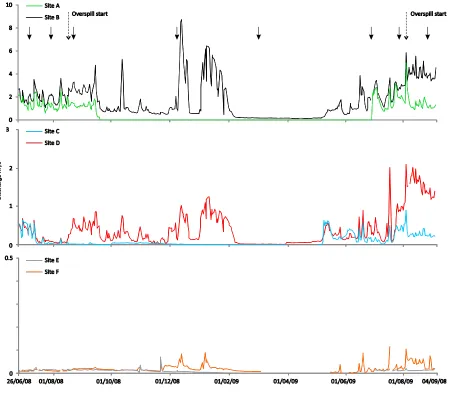
on when valves were opened in winter by the hydropower company (Fig. S1).
126
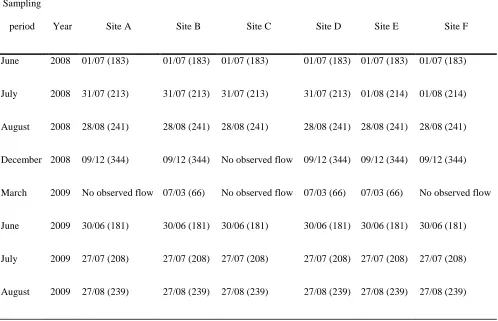
River environmental variables and benthic macroinvertebrate were sampled on 8
127
occasions: 3 times during the northern hemisphere summer of 2008, during December 2008
128
(winter) and March 2009 (spring), and then again 3 times in summer 2009. Summer sampling
129
was undertaken at approximately monthly intervals (Table S1). Sites B and D, and to a lesser
130
extent, site E were affected by overspill from the Wei see immediately before August 2008 and
7 2009 sampling. Overspill elevated water temperatures and discharge (Dickson et al. 2010).
132
A snowpack of up to 2.7 m depth covered the river system from December 2008 to
133
March 2009 at sites unaffected by reservoir drawdown (sites A, C, and F). We used a dual-phase
134
Leica GPS500 differential global positioning system (GPS; Leica Geosystems, Milton Keynes,
135
UK) in real-time kinematic (RTK) mode, with a base receiver positioned at the Hinterer
136
Schafbichl geodetic control point, with x,y accuracy of ± 0.05 m, to relocate snow-covered
137
sampling sites and assess whether the channels had flowing water. At each site, we carefully
138
excavated snow to locate and download data loggers (see below). Thus, we consistently found
139
and sampled the same locations throughout the study. Site C was not flowing in December 2008,
140
and no flow was observed at sites A, C, or F in March 2009. For channels that retained flow, we
141
excavated a short length of channel (5–10 m) carefully to allow access to the river for
142
macroinvertebrate sampling. To mitigate for any disturbance to benthic fauna during excavation,
143
channel sections were covered with a tarpaulin and left undisturbed for 24 h prior to sampling (as
144
per Schütz et al. 2001, personal communication).
145
146
River environmental variables
147
We measured water depth at each site for the duration of the study with either a Trafag
148
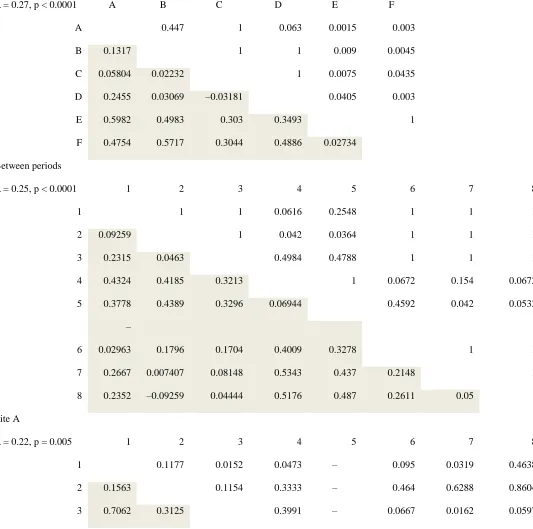
DL/N 70 pressure transducer with integrated data logger (Trafag UK, Basildon, UK), or a Druck
149
PDCR1830 pressure transducer (General Electric Company, Fairfield, Connecticut) connected to
150
a Campbell Scientific CR1000 data logger (Campbell Scientific, Shepshed, UK). Instruments
151
were deployed at river cross-sections where lateral migration was constrained by bedrock or
152
vegetated banks. We used water depth to estimate discharge based on velocity-area or
salt-153
dilution estimates (Dickson et al. 2012), with rating curves for all sites producing R2 values
8 >0.90. We monitored water temperature continuously at each site with a Gemini Tinytag data
155
logger (Gemini, Chichester, UK). All water pressure and water temperature data loggers
156
recorded at 15-min intervals. Data were downloaded and internal clocks checked weekly during
157
summer and every 3 mo during winter. A full description of the river thermal regimes was
158
provided by Dickson et al. (2012). We measured electrical conductivity (EC) and pH at each site
159
with a Hach HQ 40d meter (Hach Lange, Düsseldorf, Germany) immediately before every
160
collection of macroinvertebrates. We collected river water samples (~500 mL) concurrently, and
161
measured suspended sediment concentration (SSC) later in the laboratory by filtering samples
162
through Whatman 0.45- m cellulose nitrate filter papers, drying, and weighing. We assessed
163
channel stability on each sampling visit using the bottom component of the Pfankuch index
164
(Pfankuch 1975). We measured snow depth at each snow-covered site during winter sampling.
165
166
Macroinvertebrate sampling
167
We collected 5 replicate Surber samples (0.05 m2, 250- m-mesh net)randomly from
168
different subhabitats (riffles, glides) at each site except A in December 2008 when the Surber net
169
became clogged with ice because of extremely low water and air temperature and only 3 samples
170
could be collected. We always collected samples in the morning to avoid patches of sediment
171
wetted only during peak diurnal flow in late afternoon/evening. We preserved the samples in the
172
field with 70% ethanol prior to subsequent sorting in the laboratory.
173
We sorted and stored macroinvertebrates in fresh 70% ethanol. We measured ash-free dry
174
mass (AFDM) of benthic particulate organic matter (POM) in the remaining material, including
175
algae, which were not separated from samples, by loss on ignition (Steinman et al. 2006). We
176
initially sorted and counted macroinvertebrates under a light microscope (10× magnification).
9 We subsampled Chironomidae (n = 50/Surber sample), cleared them by soaking in 10% solution
178
of KOH, mounted them ventral side up on slides using Euporal, and examined them at 200 to
179
1000× magnification (Epler 2001). We identified most individuals to species, except Plecoptera
180
(genus), some Chironomidae (subgenus or genus), and most non-chironomid Diptera (family)
181
(see Appendix S1 for keys). We separated taxa that could not be identified confidently to species
182
level, but were clearly distinguishable based on gross morphological features, into
183
morphogroups. We did not count Oligochaeta because of poor preservation.
184
185
Data analysis
186
We summarized spatial and temporal dynamics of the river system by using discharge
187
and water temperature records to derive 3 indices based on continuous 15-min-resolution data
188
over the 7 d prior to sampling dates: 1) = mean discharge, 2) = mean water temperature, and
189
3) Tmax = maximum water temperature. Continuous discharge and water temperature data were
190
not available for site A for the week prior to sampling in June 2009 because a marmot severed
191
the logger cables. We used a linear regression model constructed from 15-min data at sites A and
192
B during the following week to approximate discharge (r2 = 0.94, p < 0.01) and water
193
temperature (r2 = 0.97, p < 0.01) at site A to enable the calculation of indices (1, 2, and 3) for this
194
sampling period. We used 1-way analysis of variance (ANOVA) to compare each of the
195
physicochemical habitat variables between sites. We did not undertake temporal analyses
196
because measurements of these variables were not replicated on each sampling occasion.
197
To illustrate the seasonal dynamics of river physicochemical habitat, we calculated a
198
multivariate glaciality index using , EC, SSC, and Pfankuch stability scores following methods
199
by Ilg and Castella (2006) and Brown et al. (2010). The index provides a synthetic measure of
10 physicochemical harshness in alpine rivers, based on 4 physicochemical variables that are
201
considered to have strong influences on alpine river macroinvertebrate assemblages (Ilg and
202
Castella 2006). We calculated reciprocals of the Pfankuch Index and SSC so that higher values
203
of all constituent data sets equated to low glacial influence, then standardized all data from 0 to 1
204
prior to calculation of the index based on axis 1 scores from a non-centred principal components
205
analysis (nPCA).
206
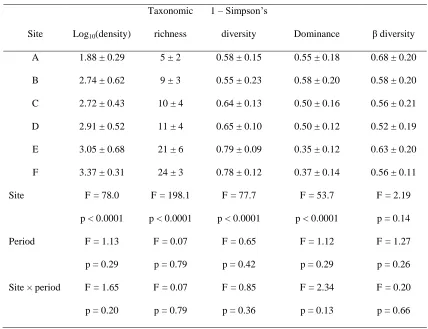
To quantify year-round macroinvertebrate assemblage dynamics at the 6 sites, we used
207
replicate Surber sample data to calculate: 1) density (total number of macroinvertebrates/m2), 2)
208
taxonomic richness (number of taxa), 3) 1 –Simpson’s index of diversity, 4) dominance, 5)
209
mean and standard deviation of -diversity (for each set of 5 replicates) calculated using Bray–
210
Curtis dissimilarities (Whittaker 1972). Abundance data were log10(x + 1)-transformed prior to
211
statistical analysis. We used analysis of variance (ANOVA) to test for differences in assemblage
212
metrics among sites and sampling periods. Prior to statistical analyses, we tested individual data
213
sets and model residuals for spatial (based on straight-line distance) and temporal (based on
214
calendar day) autocorrelation using Mantel tests. This step was necessary because rivers were in
215
close spatial proximity, some possessed direct up–downstream linkages, and some sets of
216
samples (i.e., summer) were collected relatively closely in time. However, these Mantel tests did
217
not reveal any need to correct for either spatial or temporal autocorrelation (Table S2).
218
We used nonmetric multidimensional scaling (NMDS) to visualize the extent to which
219
macroinvertebrate composition across the floodplain followed clear seasonal cycles linked to the
220
annual meltwater production cycle. The analysis was based on √(x)-transformed abundance data
221
with Bray–Curtis dissimilarities in vegan in R (version 2.0-6; R Project for Statistical
222
Computing, Vienna, Austria; Oksanen 2005) with 999 permutations. The replicate samples
11 collected at each site/date were pooled prior to analysis to prevent patch-scale variability from
224
impeding the site-scale comparison over time (Brown et al. 2006). The best 2-dimensional
225
solution was retained following up to 200 restarts. The glaciality index was fitted to the solution
226
post hoc using the envfit procedure with 999 permutations. This approach was preferred over
227
direct ordination approaches such as RDA/CCA because NMDS makes no assumptions about the
228
underlying data structure, and better represents the distances between samples in multivariate
229
ordination space (Legendre and Legendre 1998). We undertook analysis of similarity (ANOSIM)
230
on log10 (x + 1)-transformed abundance data using Bray–Curtis dissimilarities to assess whether
231
the taxonomic composition of macroinvertebrates differed between 1) all sites, 2) all sampling
232
periods, and 3) sampling periods for individual sites.
233
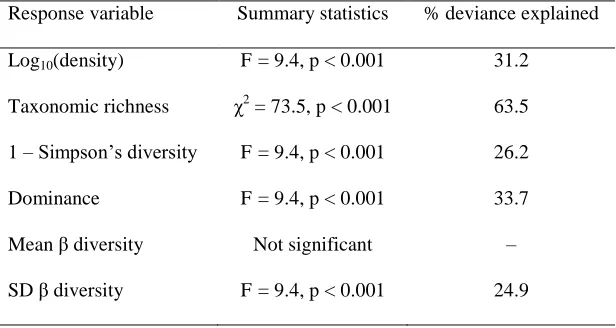
We used generalized additive models (GAMs) to assess whether changes in
234
macroinvertebrate assemblage metrics could be predicted from the physicochemical habitat
235
gradient described by the glaciality index. Negative binomial, quasibinomial, or quasiPoisson
236
distribution parameters were estimated following the recursive approach of Barry and Welsh
237
(Barry and Welsh 2002), with Akaike’s Information Criterion (AIC) values calculated to identify
238
the best model fit (and for comparison with linear models). Optimum smoothing was selected
239
using the cross-validation approach of Wood (2008).
240
Overspill flows from the Weißsee in both 2008 and 2009 provided an experimental
241
framework to assess macroinvertebrate assemblage responses to high-altitude river regulation for
242
comparison to the seasonal dynamics. We assessed the extent of any difference in
243
macroinvertebrate assemblage metrics using general linear models (GLM) based on a
before-244
after-control-impact (BACI) design between sites A and B. Results were Bonferroni corrected
245
for multiple comparisons. ANOSIM was undertaken on log10 (x+1)-transformed abundance data
12 using Bray–Curtis dissimilarities to assess whether: 1) compositional differences between
247
sampling periods were greater than those within periods, and 2) compositional differences
248
between sites were greater than those within sites.
249
250
RESULTS
251
River environmental variables and glaciality gradients
252
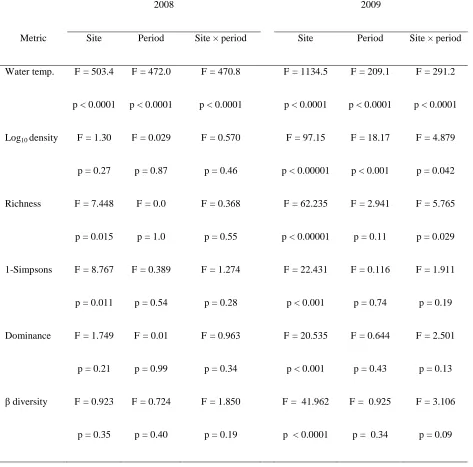
Clear spatiotemporal differences in physicochemical habitat variables were evident
253
between sites (Table 1). Most measured environmental variables showed variability across
254
seasons and sites, with significant differences observed between sites for EC, channel stability,
255
and (Table 1). In general, main-stem sites (A and B) had the harshest physicochemical habitat
256
(i.e., lower maximum water temperature and channel stability, but high and SSC). Sites C and
257
D (mixed channels) had intermediate habitat conditions, and sites E and F (ground water) had the
258
least harsh conditions.
259
Temporal changes in surface hydrological connectivity affected the physicochemical
260
variables and glaciality index scores at our study sites. During summer 2009, a greater proportion
261
of flow from the main channel was routed across to the west side of the floodplain (Fig. 2C, D).
262
This mainly affected sites C and D with higher mean discharges (i.e., in July 2009 vs 2008, site
263
C up from 0.03 to 0.27 m3/s, and Site D from 0.09 to 0.41 m3/s) and lower mean river
264
temperature (i.e., in July 2009 vs 2008, site C down from 4.6 to 3.4°C and site D from 5.3 to
265
3.3°C). The reach in which site E (ground water) was situated became connected with the mixed
266
side channels feeding down the west side of the floodplain, which caused a doubling of mean
267
discharge (0.01 to 0.02 m3/s) and a slight decrease in temperature (5.4 to 5.1°C).
268
Axis 1 of the nPCA, which was used to derive the glaciality index, accounted for 60% of
13 the cumulative variance and was negatively associated with all 4 habitat variables (SSC: –0.804,
270
Pfankuch: –0.442, EC: –0.375, water temperature: –0.134; higher index values equal higher
271
glaciality). A relatively wide gradient of glaciality index scores were generated from the
272
physicochemical habitat data sets, and plots of the index per site over time showed only minimal
273
differences between main-stem and mixed-channel sites A to D during the 2 summer monitoring
274
periods (Fig. 3). Groundwater sites E and F had markedly lower glaciality index scores, but a
275
clear pattern of increasing harshness emerged as both melt seasons progressed.
276
Continuous time-series of river temperature and discharge data sets (e.g., Fig. S1) showed
277
that where rivers were flowing, diurnal variability in discharge and water temperature under
278
snow packs was greatly suppressed during the winter months. , , Tmax, POM, and SSCwere all
279
markedly reduced at sites A and F during winter monitoring periods. Glaciality index scores
280
showed consistently harsh habitats at sites A to D throughout the winter and spring seasons (Fig.
281
3). Site E had high glaciality scores during December 2008, but the site was much more benign
282
in spring 2009. Site F differed from site E in having low glaciality scores during December 2008
283
before it ceased to flow.
284
285
Macroinvertebrate assemblage composition
286
More than 17,900 macroinvertebrates were identified, most of which (89% total
287
abundance, 35 taxa) belonged to the Chironomidae. We also observed 11 non-Chironomidae
288
Diptera taxa, 2 Ephemeroptera (Baetis, Rhithrogena), 7 Plecoptera (including Leuctra,
289
Nemurella, Protonemoura, and Perlodes), and 9 Trichoptera (including Acrophylax, Lithax, and
290
Drusus). Members of the Chironomidae subfamily Diamesinae were the most dominant taxa at
291
sites A to D, except at site A in August 2008 when Cheilotrichia sp. (Limoniidae) dominated the
14 relatively small assemblage (abundance = 40 individuals [ind]/m2 vs total abundance = 56
293
ind/m2). Sixty-six of the 71 taxa observed were found during the summer observation periods.
294
Macroinvertebrate assemblage density, taxonomic richness, dominance, and Simpson’s
295
diversity differed significantly among sites (Table 2), with a clear gradient from
meltwater-296
dominated mainstem sites A and B to groundwater-dominated sites E and F. The composition of
297
macroinvertebrates clearly differed across the river system (ANOSIM, R = 0.27, p < 0.0001; Fig.
298
4). These spatial differences were associated strongly with groundwater-fed sites E and F (Table
299
S4). Glacier-dominated mainstem sites (A and B) generally had the most negative scores on
300
NMDS axis 1, mixed sites (C and D) had slightly negative or neutral scores, whereas
301
predominantly groundwater-fed sites (E and F) had positive scores on axis 1. The negative end of
302
Axis 1 of the NMDS plot was associated strongly with Chironomidae taxa (particularly
303
Diamesinae) and Baetis alpinus. At the positive end of axis 1, groundwater samples were
304
associated with higher abundance of Trichoptera (particularly Drusus monticola) and the
305
Orthocladiinae chironomids Brillia modesta, Tvetenia, and Smittia.
306
Forty-two of the 71 taxa observed were found during winter. Five of these were found
307
only during winter (Diamesa permacer/dampfyi gr., B. modesta, Smittia sp., Nemouridae juv.,
308
and Brachyptera sp.), and B. modesta and Smittia sp. were observed only under snow cover.
309
Assemblage composition for all samples differed over time (ANOSIM, R = 0.25, p < 0.0001).
310
All sites differed from period to period, except site A and site E, for which periods 4 and 5 were
311
similar (Table S3). A clear change in the macroinvertebrate assemblage occurred at sites A to D
312
during winter, when assemblage composition became more closely associated with that at sites E
313
and F along NMDS axis 1 (Fig. 4D). The total abundance of Diamesa fell drastically (>2600
314
ind/m2 in August 2008 vs 660 ind/m2 in December 2008). In contrast to summer sampling
15 periods, Acrophylax zebrus, Parapsectra sp., Heleniella serratosioi, Clinocera sp., and
316
Dicranota sp. were present in the winter assemblages. Overall, abundance and richness observed
317
in the snow-covered groundwater river (Site F) were lower (632 ind/m2, 20 taxa) during
318
December 2008 than during all other sampling periods (abundance >1980 ind/m2, 21–27 taxa).
319
Macroinvertebrate density, taxonomic richness, and Simpson’s diversity had significant
320
unimodal responses along the glaciality index gradient (Fig. 5A–C, Table 3), whereas dominance
321
and the standard deviation of diversity estimates were typically highest at the positive end of
322
the glaciality spectrum and relatively similar across mid to low glaciality conditions (Fig. 5D).
323
324
River ecosystem response to reservoir overspill
325
Water temperature and discharge increased significantly at site B (Figs 6A, S1, Table S4)
326
during periods of overspill, whereas physicochemical conditions at site A were relatively similar.
327
Mean daily discharge increased from 1.93 to 2.66 m3/s (38%) in 2008 and 2.55 to 4.04 m3/s
328
(58%) in 2009. No clear ecological effects of reservoir overspill were observed in 2008, but in
329
2009, abundance increased and taxonomic richness decreased at site B in comparison to site A
330
(Fig. 6B, C, Table S4). diversity also decreased at site B in 2009 (Fig. 6F), but the site × time
331
interaction was not significant. Despite changes in some assemblage-level metrics (Fig. 6C–F),
332
no significant difference was seen in overall assemblage composition (ANOSIM, Table 4).
333
334
DISCUSSION
335
This study has significantly enhanced our understanding of the spatiotemporal dynamics
336
of physicochemical habitat and macroinvertebrate assemblages across a high alpine river–
337
floodplain system throughout the year. It has provided novel insights into the year-round
16 compositional dynamics of alpine river macroinvertebrate assemblages. First, the greatest
339
distinctions among sites were observed in summer when glacial influence was high, whereas
340
sites were more homogenous in winter when glacial influence diminished. These findings are
341
comparable to those from lower altitude, sub-treeline floodplains (Burgherr et al. 2002, Malard et
342
al. 2006). Second, macroinvertebrate assemblage descriptors displayed predominantly unimodal
343
relationships with glaciality index scores and, thus, the gradient of meltwater-groundwater
344
conditions. This finding, based on data collected year-round, adds weight to results of recent
345
studies showing similar relationships from summer sampling campaigns (Jacobsen et al. 2012).
346
Last, despite the widespread nature of regulation for hydropower across the European Alps
347
(Bundi 2010), we found inconsistent or negligible effects of reservoir overspill/regulation on
348
macroinvertebrate assemblages despite significant increases in river flow and water temperature.
349
Each of these novel findings from the study is discussed in turn below.
350
351
Effects of meltwater pulses and glaciality gradients on alpine river ecosystems
352
Our results supported H1 and the prevailing general consensus that during the summer
353
melt season, different alpine floodplain river habitats are characterized by distinct
354
physicochemical conditions and, thus, macroinvertebrate assemblages (Burgherr et al. 2002,
355
Brown et al. 2003, Malard et al. 2006). Channel stability and water temperature arekey
356
physicochemical drivers influencing longitudinal trends in macroinvertebrate assemblages along
357
proglacial rivers (Milner et al. 2001). In our study, these environmental variables varied
358
relatively consistently in space and time in accordance with the glacial flow pulse. The effect of
359
this spatial environmental heterogeneity in the Eisboden was that the lowest macroinvertebrate
360
densities (maximum = 184 ind/m2) and taxonomic richness (6) were observed at site A, which
17 had harsh physicochemical conditions (Tmax < 2.8°C, mean EC < 30 S/cm,and low channel
362
stability; Carrivick et al. 2013). The assemblage at site A during summer was typical of a
363
European glacial river close to the glacial margin (Milner et al. 2001), and consisted
364
predominantly of Diamesa with the occasional Eukiefferiella claripennis and Cheilotrichia sp.
365
Macroinvertebrate density was significantly higher in the predominantly groundwater-fed sites
366
(E and F) than in the main glacial river, and assemblages were more diverse, a finding supported
367
by previous studies (e.g., Füreder 1999, Burgherr et al. 2002, Brown et al. 2007). Across the
368
Eisboden, abundances of Trichoptera (with the exception of Psychomyiidae, the only caseless
369
Trichoptera observed) were associated strongly with groundwater contributions. However, this
370
higher abundance contrasted with a study in the French Pyrénées where Brown et al. (2007)
371
found lower Trichoptera abundance in rivers with large groundwater components. A possible
372
explanation is that, in the Eisboden, habitat conditions were too harsh at sites A to D during the
373
summer melt season for Trichoptera taxa to establish in higher abundance than at sites in nearby
374
groundwater rivers. This finding highlights the need for caution in assuming the generality of
375
taxon–environment gradients across alpine habitats (see also Vaughan and Ormerod 2003).
376
Temperate and subarctic/arctic proglacial floodplains contract during winter as
melt-377
driven inputs are drastically reduced or stop completely, and discharge becomes insufficient to
378
maintain lateral surface connectivity or subsurface pathways feeding groundwater upwellings
379
(Tockner et al. 2000, Malard et al. 2006). At sites on the Eisboden floodplain unaffected by the
380
Wei see (sites A, C, and F), discharge declined drastically during autumn/winter to the extent
381
that no surface water was observed during December at site C, and by March, no surface flow
382
was seen at sites A or F. Sites B, D, and E were perennial and typically possessed low and
383
diurnally stable discharge, river temperature, and SSC during winter when reservoir drawdown
18 operations did not occur, as seen in previous studies (Füreder et al. 2001, Robinson et al. 2001,
385
Schütz et al. 2001). These physicochemical habitat changes were reflected in the winter
386
convergence of glaciality index scores.
387
A distinct shift in macroinvertebrate assemblage composition was observed in December
388
in the main glacial channel at site A, and several taxa not found during summer were observed,
389
including members of the Trichoptera, Plecoptera, Empididae, Pediciidae, and Chironomidae.
390
For example, relatively high abundance of Parapsectra sp. was observed under snow at sites A,
391
E, and F, and we found Chironomidae resembling D. permacer in winter. This species can
392
tolerate extreme cold conditions and remains active when deep snow covers the ground (Hågvar
393
2010). We sampled site A only once during winter and collected only 3 subsamples, so the
394
relatively modest increase in taxonomic richness from summer to winter may be a conservative
395
representation of assemblage change. Nevertheless, these findings are supported by increases in
396
diversity seen under winter snow cover elsewhere (see Burgherr and Ward 2001, Füreder et al.
397
2001, Robinson et al. 2001, Schütz et al. 2001) and are linked to the development of more
398
diurnally benign conditions compared to summer. Thus, the main glacial river macroinvertebrate
399
assemblage more closely resembled groundwater-fed stream assemblages in winter than at any
400
other time of year, providing further support for H1.
401
Relatively predictable expansion and contraction cycles of river ecosystems have been
402
linked to flood and flow pulses (Junk et al. 1989, Malard et al. 2006). In the Eisboden, annual
403
observations dating back to ~2001 suggest the main channel is almost always routed down the
404
east side (S. Carver [University of Leeds, UK], personal communication). However, we observed
405
a more stochastic event in August 2009 (see Fig. 1D and Carrivick et al. 2013) when a large
406
volume of flow was routed down the west side. Site E was inundated with meltwater, especially
19 during August, when previously it had no upstream connection to the main channel and was
408
predominantly groundwater-fed. The macroinvertebrate assemblage responded rapidly to this
409
hydrological shift, and composition became more similar to that in the glacial river than at any
410
other time (NMDS). Concurrently, Heptageniidae and Limnephilidae juv. appeared in the main
411
channel (site B) assemblage. These individuals were likely to have drifted downstream from
412
inundated groundwater or mixed sites (Knispel and Castella 2003). However, the Limnephilidae
413
observed at site B were juveniles, and their development probably would have been restricted in
414
the harsh main-channel habitats (Lavandier and Décamps 1984).
415
Our study of 6 sites over 18 mo provided a broad spectrum of physicochemical
416
conditions from relatively harsh (main channel glacier-fed) to relatively benign (groundwater
417
channels). These harsh–benign (cf. Peckarsky 1983) differences were reflected in significant
418
relationships between glaciality index scores and the responses of benthic macroinvertebrate
419
assemblage density, richness, and Simpson’s diversity, and supported H2. We observed unimodal
420
responses along the gradient, whereas previous investigators using the glaciality index have
421
shown only linear responses (Ilg and Castella 2006, Brown et al. 2010). Similar unimodal
422
findings were reported in a recent meta-analysis of macroinvertebrate assemblage responses to
423
glacier loss. This meta-analysis suggested diversity peaks where glacial cover in catchments
424
ranges from ~5 to 30% (Jacobsen et al. 2012). Our results, together with this previous analysis,
425
further illustrate the potential for significant changes in aquatic biodiversity as glacial influence
426
decreases beyond specific thresholds (Brown et al. 2007).
427
428
Effects of flow regulation on alpine river ecosystems
429
Few investigators have studied the effects of flow regulation on macroinvertebrate
20 assemblages in high alpine rivers (but see Petts and Bickerton 1994). The Wei see affects the
431
flow regime of the Eisboden in late summer/early autumn when overspill occurs once the
432
reservoir reaches capacity, then during winter as a series of planned drawdown events to transfer
433
water via the Eisboden to the Tauernmoossee. We did not study these planned events because the
434
loss of surface flow at site A during winter and reduced sampling frequency meant a lack of
435
suitable data for a before-after–control-impact (BACI) analysis. However, site B showed a major
436
shift along NMDS Axis 1 in March 2009, whereas sites D and E did not. Therefore, these winter
437
flow events warrant further detailed study. The only published study in which the authors
438
investigated the effect of reservoir outflow on a high alpine river is one by Dickson et al. (2012),
439
who showed significant increases in river temperature over the period detailed in our study. For
440
mountain rivers, the effects of drawdown discharges on macroinvertebrate assemblages have
441
been assessed in only subalpine systems (see Céréghino et al. 2002, Robinson et al. 2004,
442
Dickson et al. 2012), and so the results of our represent a significant advance in understanding.
443
Overspill increased by up to 3.2°C and Tmax by up to 2.2°C at site B compared with the
444
immediate regulation period (see Dickson et al. 2012) and discharge by up to 58% of
pre-445
overspill flows. Despite these habitat changes, and in contrast to H3, we found inconsistent
446
evidence for effects on the macroinvertebrate assemblage and changes to density and richness
447
only in 2009. The macroinvertebrates D. bertrami, D. cinerella/zernyi gr., and D. latitarsis
448
increased markedly at site B in August 2009, and overall density increased >10× from before
449
overspill. This increase might have been related to a 58% increase in flow magnitude increase of
450
58%, on average, in 2009 (compared to 26% in 2008) with mean flows >4 m3/s, which may have
451
initiated bed movements. Macrroinvertebrates at site A responded similarly in both years before
452
and after overspill, whereas those at site B lacked the late-summer increase in abundance in
21 2008. This result suggests that the increase in 2009 was not an annual phenomenon arising
454
consistently as a result of overspill but was more likely to be associated with the stochastic
455
rerouting of glacial river flow along the west side of the valley. The overspill did have a more
456
apparent effect on taxonomic richness, which decreased relative to a marginal increase at site A.
457
Some taxa that were unable to exist in the altered hydraulic conditions (Cauvy-Fraunié et al.
458
2014) may have emigrated at this time, thereby enabling the Chironomidae to become more
459
abundant. The differences between years also may have been the result of a relatively large
460
rainfall event that coincided with the commencement of overspill in 2009 such that site A was
461
disturbed in parallel with the release of reservoir water into site B.
462
These findings contrast with decreases in the abundance and loss of some species
463
altogether (e.g., B. muticus; see Céréghino and Lavandier 1998) following hydropeaking in the
464
French Pyrenees. However, this difference might arise from the much higher altitude of our
465
study sites (>2000 m vs 912 m) and its closer proximity to the glacial margin than the River
466
Oriège sites. As such the macroinvertebrate assemblage of the Eisboden probably consisted of
467
taxa better adapted to the extreme levels of disturbance and harsh physicochemical conditions
468
associated with glacial rivers (Ilg and Castella 2006, Brown and Milner 2012). Common taxa
469
included those with flattened (Rhithrogena, Ecdyonurus) or cylindrical bodies (Esolus, Limnius,
470
Limoniidae, Empididae, Chironomidae), or crawlers and clingers (e.g., some Trichoptera), which
471
are typically more tolerant of hydropeaking flows or are able to move to refugia (Maiolini et al.
472
2003). In addition, water temperature decreased as a consequence of water release into the River
473
Oriège, which may have placed a greater physicochemical constraint on the survival and
474
development of macroinvertebrates than the water temperature increases in the Eisboden.
475
Year-round flow was sustained only at sites that were affected by drawdown from the Wei see
22 reservoir. Whether Sites B, D, and E would have ceased to flow in winter without water
477
contributions from the Wei see is impossible to say, but at the Val Roseg floodplain,
478
Switzerland, Malard et al. (2006) found that although surface flow ceased at the upper part of the
479
floodplain, upwelling sustained flow year-round in the lower half. The Wei see certainly did
480
cause discharge to increase significantly at sites B and D and prevented formation of snow packs
481
across the channels at some times. Only after drawdown stopped did snow packs start to
482
accumulate over these river channels. Chironomidae abundance at sites inundated by drawdown
483
waters (B and D) remained relatively high during winter, and this phenomenon has been
484
observed elsewhere under natural flow regime conditions where rivers remain free of snow cover
485
(see Robinson et al. 2001, Burgherr et al. 2002).
486
487
Conclusion
488
We have demonstrated considerable temporal variation in macroinvertebrate assemblages
489
at sub-seasonal and interannual time scales. Quantifying these multiscale variations in alpine
490
aquatic ecosystem dynamics, with a particular emphasis on what happens during winter and
491
summer, is an essential step to understanding the consequences of climate change and
492
anthropogenic modification (Milner et al. 2009). The macroinvertebrate assemblage in mainstem
493
sites changed distinctly during winter. The shift showed that these habitats can support markedly
494
different assemblages from those predicted at other times of the year (Milner et al. 2001).
495
However, the re-imposition of harsh physicochemical conditions during the subsequent summer
496
once again restricts the presence of some taxa from the macroinvertebrate assemblage in glacial
497
rivers. The diversity of river habitats and ecosystems found across the relatively small Eisboden
498
floodplain manifested as unimodal responses of biodiversity measures to glacial influence, a
23 finding that further highlights the potential for significant changes in aquatic biodiversity as
500
glacial influence decreases beyond specific thresholds (Brown et al. 2007, Füreder 2007,
501
Jacobsen et al. 2012).
502
We have provided novel insights into the effects of reservoir overspill on river habitats
503
and macroinvertebrate assemblages because previous studies in these environments were focused
504
only on subalpine river reaches. Regulation has a relatively large effect on the physicochemical
505
conditions in the Eisboden (Dickson et al. 2012), but in general, the macroinvertebrate
506
assemblage seems surprisingly resilient to these disturbances in comparison with reports from
507
subalpine rivers (e.g., Céréghino et al. 2002, Cortes et al. 2002). However, one cannot conclude
508
in general that the effects of reservoir operation are limited because our study was restricted to a
509
sampling program in a single basin, and we analyzed only summer overspill events. The
510
hydropower station served by the Eisboden also has an expansive spatial footprint (see Fig. 1),
511
and affects multiple rivers across several high alpine valleys. Therefore, it is essential that the
512
effects of anthropogenic flow regulation for hydropower generation in alpine systems be
513
assessed more widely to provide a fuller picture of any effects.
514
24
ACKNOWLEDGEMENTS
516
This research was supported primarily by a Natural Environment Research Council
517
(NERC) studentship (NE/H527467/1) to NED. Additional support to LEB was provided by the
518
Royal Society (International Outgoing Grant 2006/R4), and to LEB and JLC by the Royal
519
Geographical Society–Institute of British Geographers with the Royal Institute of Chartered
520
Surveyors (GFG 39/08) and University of Leeds Academic Fund for Learning and Teaching
521
(2008). Steve Carver, Bob Dickson, Andy Evans, Will Hunt, James Farrell, Naomi van der
522
Velden, and Jeff Warburton provided much appreciated field support. Two anonymous referees
523
provided insights that improved significantly an earlier version of this paper.
524
25
LITERATURE CITED
526
Alpine Convention. 2009. Water and water management issues: report on the state of the Alps.
527
Alpine signals. Special edition 2. Permanent Secretariat of the Alpine Convention,
528
Innsbruck, Austria. (Available from:
529
http://www.alpconv.org/en/alpineknowledge/rsa/water/default.html [last accessed 9
530
March 2015])
531
Anselmetti, F. S., R. Buhler, D. Finger, S. Girardclos, A. Lancini, C. Rellstab, and M. Sturm.
532
2007. Effects of alpine hydropower dams on particle transport and lacustrine
533
sedimentation. Aquatic Sciences 69:179–198.
534
Barry, S., and A. H. Welsh. 2002. Generalized additive modelling and zero inflated count data.
535
Ecological Modelling 157:179–188.
536
Brown, L. E., D. M. Hannah, and A. M. Milner. 2003. Alpine stream habitat classification: an
537
alternative approach incorporating the role of dynamic water source contributions. Arctic
538
Antarctic and Alpine Research 35:313–322.
539
Brown, L. E., D. M. Hannah, and A. M. Milner. 2007. Vulnerability of alpine stream biodiversity
540
to shrinking glaciers and snowpacks. Global Change Biology 13:958–966.
541
Brown, L. E., D. M. Hannah, and A. M. Milner. 2009. ARISE: a classification tool for Alpine
542
River and Stream Ecosystems. Freshwater Biology 54:1357–1369.
543
Brown, L. E., D. M. Hannah, and A. M. Milner. 2010. Predicting river ecosystem response to
544
glacial meltwater dynamics: a case study of quantitative water sourcing and glaciality
545
index approaches. Aquatic Sciences 72:325–334.
546
Brown, L. E., and A. M. Milner. 2012. Rapid loss of glacial ice reveals stream community
547
assembly processes. Global Change Biology 18:2195–2204.
26 Brown, L. E., A. M. Milner, and D. M. Hannah. 2006. Stability and persistence of alpine stream
549
macroinvertebrate communities and the role of physicochemical habitat variables.
550
Hydrobiologia 560:159–173.
551
Brown, L. E., A. M. Milner, and D. M. Hannah. 2007. Groundwater influence on alpine stream
552
ecosystems. Freshwater Biology 52:878–890.
553
Brunke, M. 2002. Floodplains of a regulated southern alpine river (Brenno, Switzerland):
554
ecological assessment and conservation options. Aquatic Conservation: Marine and
555
Freshwater Ecosystems 12:583–599.
556
Bundi, U. 2010. Alpine waters. Springer, Berlin, Germany.
557
Burgherr, P., and J. V. Ward. 2001. Longitudinal and seasonal distribution patterns of the benthic
558
fauna of an alpine glacial stream (Val Roseg, Swiss Alps). Freshwater Biology 46:1705–
559
1721.
560
Burgherr, P., J. V. Ward, and C. T. Robinson. 2002. Seasonal variation in zoobenthos across
561
habitat gradients in an alpine glacial floodplain (Val Roseg, Swiss Alps). Journal of the
562
North American Benthological Society 21:561–575.
563
Carrivick, J. L., L. E. Brown, D. M. Hannah, and A. G. D. Turner. 2012. Numerical modelling of
564
spatio-temporal thermal heterogeneity in a complex river system. Journal of Hydrology
565
414/415:491–502.
566
Carrivick, J. L., M. Geilhausen, J. Warburton, N. E. Dickson, S. J. Carver, A. J. Evans, and L. E.
567
Brown. 2013. Contemporary geomorphological activity throughout the proglacial area of
568
an alpine catchment. Geomorphology 188:83–95.
569
Cauvy-Fraunié, S., P. Andino, R. Espinosa, R. Calvez, F. Anthelme, D. Jacobsen, and O.
570
Dangles. 2014. Glacial flood pulse effects on benthic fauna in equatorial high-Andean
27 streams. Hydrological Processes 28:3008–3017.
572
Céréghino, R., P. Cugny, and P. Lavandier. 2002. Influence of intermittent hydropeaking on the
573
longitudinal zonation patterns of benthic invertebrates in a mountain stream. International
574
Review of Hydrobiology 87:47–60.
575
Céréghino, R., and P. Lavandier. 1998. Influence of hypolimnetic hydropeaking on the
576
distribution and population dynamics of Ephemeroptera in a mountain stream. Freshwater
577
Biology 40:385–399.
578
Cortes, R. M. V., M. T. Ferreira, S. V. Oliveira, and D. Oliveira. 2002. Macroinvertebrate
579
community structure in a regulated river segment with different flow conditions. River
580
Research and Applications 18:367–382.
581
Dickson, N. E., L. E. Brown, and J. L. Carrivick. 2010. Hydroclimatological and anthropogenic
582
influences on stream temperature dynamics of the Eisboden glacier-fed river, Austrian
583
Alps. Pages 725–733 in Anon (editor). British Hydrological Society 3rd International
584
Symposium. British Hydrological Society, London, UK.
585
Dickson, N. E., J. L. Carrivick, and L. E. Brown. 2012. Flow regulation alters alpine river
586
thermal regimes. Journal of Hydrology 464/465:505–516.
587
Epler, J. H. 2001. Identification manual for the larval chironomidae (Diptera) of North and South
588
Carolina. Division of Water Quality, North Carolina Department of Enviroment and
589
Natural Resources, Raleigh, North Carolina.
590
Füreder, L. 1999. High alpine streams: cold habitats for insect larvae. Pages 181–196 in R.
591
Margesin and F. Schinner (editors). Cold-adapted organisms: ecology, physiology,
592
enzymology, and molecular Biology. Springer, Berlin, Germany.
593
Füreder, L. 2007. Life at the edge: habitat condition and bottom fauna of Alpine running waters.
28 International Review of Hydrobiology 92:492–513.
595
Füreder, L., C. Schütz, M. Wallinger, and R. Burger. 2001. Physico-chemistry and aquatic
596
insects of a glacier-fed and a spring-fed alpine stream. Freshwater Biology 46:1673–
597
1690.
598
Füreder, L., C. Vacha, K. Amprosi, S. Bühler, C. M. E. Hansen, and C. Moritz. 2002. Reference
599
conditions of alpine streams: physical habitat and ecology. Water, Air, and Soil Pollution:
600
Focus 2:275–294.
601
Hågvar, S. 2010. A review of Fennoscandian arthropods living on and in snow. European Journal
602
of Entomology 107:281–298.
603
Hannah, D. M., L. E. Brown, A. M. Milner, A. M. Gurnell, G. R. McGregor, G. E. Petts, B. P. G.
604
Smith, and D. L. Snook. 2007. Integrating climate–hydrology–ecology for alpine river
605
systems. Aquatic Conservation: Marine and Freshwater Ecosystems 17:636–656.
606
Ilg, C., and E. Castella. 2006. Patterns of macroinvertebrate traits along three glacial stream
607
continuums. Freshwater Biology 51:840–853.
608
Jacobsen, D., A. M. Milner, L. E. Brown, and O. Dangles. 2012. Biodiversity under threat in
609
glacier-fed river systems. Nature Climate Change 2:361–364.
610
Junk, W. J., P. B. Bayley, and R. E. Sparks. 1989. The flood pulse concept in river-floodplain
611
systems. Canadian Special Publication of Fisheries and Aquatic Sciences 106:110–127.
612
Knispel, S., and E. Castella. 2003. Disruption of a longitudinal pattern in environmental factors
613
and benthic fauna by a glacial tributary. Freshwater Biology 48:604–618.
614
Lavandier, P., and H. Décamps. 1984. Estaragne. Pages 237–264 in B. A. Whitton (editor).
615
Ecology of European rivers. Blackwell Scientific, Oxford, UK.
616
Legendre, P., and L. Legendre. 1998. Numerical ecology. Elsevier, Amsterdam, Netherlands.
29 Maiolini, B., L. Silveri, and V. Lencioni. 2003. Hydroelectric power generation and disruption of
618
the natural stream flow: effects on the zoobenthic community. Studi Trentini di Scienze
619
Naturali Acta Biologica 83:21–26.
620
Malard, F., U. Uehlinger, R. Zah, and K. Tockner. 2006. Flood-pulse and riverscape dynamics in
621
a braided glacial river. Ecology 87:704–716.
622
Milner, A. M., J. E. Brittain, E. Castella, and G. E. Petts. 2001. Trends of macroinvertebrate
623
community structure in glacier-fed rivers in relation to environmental conditions: a
624
synthesis. Freshwater Biology 46:1833–1848.
625
Milner, A. M., L. E. Brown, and D. M. Hannah. 2009. Hydroecological response of river systems
626
to shrinking glaciers. Hydrological Processes 23:62–77.
627
Oksanen, J. 2005. Vegan: R functions for vegetation ecologists. R Project for Statistical
628
Computing, Vienna, Austria. (Available from:
629
http://cc.oulu.fi/~jarioksa/softhelp/vegan.html)
630
Peckarsky, B. L. 1983. Biotic interactions or abiotic limitations? A model of lotic community
631
structure. Pages 303–323 in T. D. Fontaine and S. M. Bartell (editors). Dynamics of lotic
632
ecosystems. Ann Arbor Science, Ann Arbor, Michigan.
633
Petts, G. E., and M. A. Bickerton. 1994. Influence of water abstraction on the macroinvertebrate
634
community gradient within a glacial stream system: La Borgne d'Arolla, Valais,
635
Switzerland. Freshwater Biology 32:375–386.
636
Pfankuch, D. J. 1975. Stream reach inventory and channel stability evaluation. United States
637
Department of Agriculture Forest Service, Region 1, Missoula, Montana, USA.
638
Robinson, C. T., S. Aebischer, and U. Uehlinger. 2004. Immediate and habitat-specific responses
639
of macroinvertebrates to sequential, experimental floods. Journal of the North American
30 Benthological Society 23:853–867.
641
Robinson, C. T., U. Uehlinger, and M. Hieber. 2001. Spatio-temporal variation in
642
macroinvertebrate assemblages of glacial streams in the Swiss Alps. Freshwater Biology
643
46:1663–1672.
644
Schütz, C., M. Wallinger, R. Burger, and L. Füreder. 2001. Effects of snow cover on the benthic
645
fauna in a glacier-fed stream. Freshwater Biology 46:1691–1704.
646
Steinman, A. D., G. A. Lamberti, and P. R. Leavitt. 2006. Biomass and pigments of benthic
647
algae. Pages 357–379 in F. R. Hauer and G. A. Lamberti (editors). Methods in stream
648
ecology. Academic Press, New York, USA.
649
Tockner, K., F. Malard, and J. V. Ward. 2000. An extension of the flood pulse concept.
650
Hydrological Processes 14:2861–2883.
651
Vaughan, I. P., and S. J. Ormerod. 2003. Improving the quality of distribution models for
652
conservation by addressing shortcomings in the field collection of training data.
653
Conservation Biology 17:1601–1611.
654
Wehren, B., B. Schädler, and R. Weingartner. 2010. Human interventions. Pages 71–92 in U.
655
Bundi (editor). Alpine waters. Springer, Berlin, Germany
656
Whittaker, R. H. 1972. Evolution and measurement of species diversity. Taxon 21:213–251.
657
Wood, S. N. 2008. Fast stable direct fitting and smoothness selection for generalized additive
658
models. Journal of the Royal Statistical Society Series B: Statistical Methodology
659
70:495–518.
660
Wüest, A. 2010. Downstream relevance of resevoir managment. Pages 235–246 in U. Bundi
661
(editor). Alpine Waters. Springer, Berlin.
662
31
664
32
FIGURE CAPTIONS
666
Fig. 1. Map showing hydropower infrastructure associated with the Tauernmoossee dam, and
667
consequent effects of regulation across numerous Alpine rivers. Boxed area shows
668
location of the Eisboden river study site.
669
Fig. 2. Map (A), and photographs (B–D) of the study area with the locations of the 6 study sites
670
and an overall view of the surface hydrological connectivity within the study area in June
671
2008 (B), and July (C) and August (D) 2009. Note the majority of flow from the
672
Odenwinkelkees (top right) channelled along the east side of the floodplain in (B). The
673
main Eisboden river flows from right to left (i.e., south–north).
674
Fig. 3. Temporal changes in the multivariate glaciality index over the duration of the study at
675
mainstem (A and B), mixed (C and D), and groundwater (E and F) sites. High glaciality
676
index values represent harsher conditions with more glacial influence. Missing data
677
points correspond with the loss of surface flow at study sites during winter. Dates are
678
formatted Mon-last 2 digits of the year.
679
Fig. 4. Nonmetric multidimensional scaling (NMDS) output for the main glacial river at sites A
680
and B (A), mixed-source rivers (B), predominantly groundwater-fed channels (C), and
681
the locations of selected taxa in the NMDS ordination space and the glaciality index
682
vector (R2 = 0.45, p = 0.001) (D). Arrows show the temporal progression of assemblage
683
composition at each site. Broken arrows link successive samples where the river had an
684
intermediate phase with no observed flow. Samples collected in December 2008 and
685
March 2009 are labelled as Dec and Mar, respectively. A.zebrus = Acrophylax zebrus,
686
B.alpinus = Baetis alpinus, B.modesta = Brillia modesta, C.vitellinus = Chaetocladius
687
vitellinus, D.dampfyi = Diamesa dampfyi, D.bertrami = Diamesa bertrami, Diamesa
33 cinerella/zernyi gr., D.latitarsus = Diamesa latitarsus, D.steinboecki = Diamesa
689
steinboecki, D.monticola = Drusus monticola, E.claripennis = Eukiefferiella claripennis.
690
Fig. 5. Relationships between the multivariate glaciality index (positive values = greater glacial
691
influence) and log10(density) (A), taxonomic richness (B), 1 –Simpson’s diversity index
692
(C), dominance (D), mean of pairwise diversity scores per site (E), and the standard
693
deviation (SD) of pairwise diversity scores per site (F). Filled circles are from
694
December 2008 and March 2009, and lines denote generalized additive model (GAM)
695
best fit (solid) and 95% confidence intervals (broken). Ind = individuals.
696
Fig. 6. Interaction plots showing changes in mean values ( ± 1 SD) of water temperature (A),
697
log10(density) (B), taxonomic richness (C), 1 –Simpson’s diversity (D), dominance (E),
698
and diversity (F) before and after the onset of Weißsee reservoir overspill which
699
affected site B in 2008 and 2009. Asterisks denote significant differences between sites
700
(see also Table S4). Connecting dashed lines denote a significant effect of time (before–
701
after the release) on between-site differences.
702
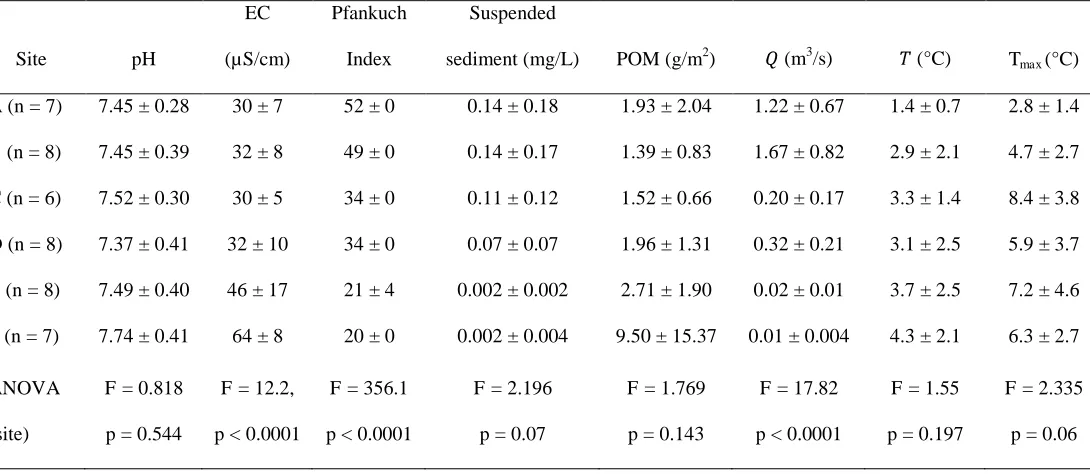
34 Table 1. Mean (± 1 SD) values of environmental conditions for the 6 monitoring sites over the
704
entire study and analysis of variance (ANOVA) results for differences in environmental
705
conditions among sites. EC = electrical conductivity, POM = particulate organic matter, =
706
mean discharge, = mean temperature, Tmax = maximum temperature.
707
Site pH
EC
(µS/cm)
Pfankuch
Index
Suspended
sediment (mg/L) POM (g/m2) (m3/s) (°C) Tmax (°C)
A (n = 7) 7.45 ± 0.28 30 ± 7 52 ± 0 0.14 ± 0.18 1.93 ± 2.04 1.22 ± 0.67 1.4 ± 0.7 2.8 ± 1.4
B (n = 8) 7.45 ± 0.39 32 ± 8 49 ± 0 0.14 ± 0.17 1.39 ± 0.83 1.67 ± 0.82 2.9 ± 2.1 4.7 ± 2.7
C (n = 6) 7.52 ± 0.30 30 ± 5 34 ± 0 0.11 ± 0.12 1.52 ± 0.66 0.20 ± 0.17 3.3 ± 1.4 8.4 ± 3.8
D (n = 8) 7.37 ± 0.41 32 ± 10 34 ± 0 0.07 ± 0.07 1.96 ± 1.31 0.32 ± 0.21 3.1 ± 2.5 5.9 ± 3.7
E (n = 8) 7.49 ± 0.40 46 ± 17 21 ± 4 0.002 ± 0.002 2.71 ± 1.90 0.02 ± 0.01 3.7 ± 2.5 7.2 ± 4.6
F (n = 7) 7.74 ± 0.41 64 ± 8 20 ± 0 0.002 ± 0.004 9.50 ± 15.37 0.01 ± 0.004 4.3 ± 2.1 6.3 ± 2.7
ANOVA
(site)
F = 0.818
p = 0.544
F = 12.2,
p < 0.0001
F = 356.1
p < 0.0001
F = 2.196
p = 0.07
F = 1.769
p = 0.143
F = 17.82
p < 0.0001
F = 1.55
p = 0.197
F = 2.335
p = 0.06