White Rose Research Online URL for this paper:
http://eprints.whiterose.ac.uk/86018/
Version: Accepted Version
Article:
Hao, Y., Kang, J. and Krijnders, J.D. (2015) Integrated effects of urban morphology on
birdsong loudness and visibility of green areas. Landscape and Urban Planning, 137. 149
-162. ISSN 0169-2046
https://doi.org/10.1016/j.landurbplan.2015.01.006
eprints@whiterose.ac.uk https://eprints.whiterose.ac.uk/ Reuse
Unless indicated otherwise, fulltext items are protected by copyright with all rights reserved. The copyright exception in section 29 of the Copyright, Designs and Patents Act 1988 allows the making of a single copy solely for the purpose of non-commercial research or private study within the limits of fair dealing. The publisher or other rights-holder may allow further reproduction and re-use of this version - refer to the White Rose Research Online record for this item. Where records identify the publisher as the copyright holder, users can verify any specific terms of use on the publisher’s website.
Takedown
If you consider content in White Rose Research Online to be in breach of UK law, please notify us by
Landscape and Urban Planning, 1
Integrated effects of urban morphology on birdsong
loudness and visibility of green areas
Yiying HAO
a,b, Jian KANG
a,1a
School of Architecture, University of Sheffield, Western Bank, Sheffield S10 2TN, UK
, Johannes D. KRIJNDERS
bb
INCAS
3, Assen, Dr. Nassaulaan 9, 9401 HJ Assen, The Netherlands
Abstract:
The aim of this study is to determine how to increase birdsong loudness and the visibility of green areas in low-density residential areas by controlling urban morphological parameters. The spatial sound level distributions of birdsong at 12 sites sampled from a GIS database of Assen, the Netherlands, were simulated by noise mapping techniques and calculated using a MATLAB program on spatial sound level matrices. The visibilities of green areas are analysed and calculated by Visibility Analysis Graph in Space Syntax. Correlation analyses were conducted between the obtained data on spatial sound level indices, the mean visibility and urban morphological parameters. The results show that birdsong loudness has significant positive linear relationships with urban morphological parameters, including Building Plan Area Fraction (R2=0.491), Green Area Perimeters (R2=0.491) and Green Area Dispersion Index (R2=.618), while the visibility of green area has negative linear relationships with morphological parameters, including Building Plan Area Fraction (R2=0.431) and Green Area Perimeters (R2=0.799). It has also been found that in the proximity of green areas, the visibility of green areas has a positive relationship with birdsong loudness, whereas in most areas further from green areas, the visibility of green areas has a negative relationship with birdsong loudness. Either increasing birdsong loudness or enhancing visibility of the green areas by controlling urban morphological parameters is helpful for the optimisation of soundscape design with masking effects. Bird habitats and vegetation are important ecological issues to consider for the enhancement of the roles of urban morphology.2015 Landscape and Urban Planning
Date Received: 5 November 2013 Date Accepted: 23 January 2015 Publish online: 12 February 2015
1. Introduction
Green areas are an important natural resource in urban areas and can fulfil a variety of human needs, such as natural view (Lange et al, 2008), air quality (Currie and Bass, 2008), microclimate (Shashua-Bar and Hoffma, 2000) and noise reduction (Fang and Ling, 2003; Van Renterghem et al, 2012). Green areas therefore are significant for quality of life and have high social and economic values (Anderson and Cordell, 1988; De Hollander and Staatsen, 2003; Kirkpatrick et al, 2012). In terms of natural view, green areas have often been studied from the perspectives of visibility (Yang et al, 2009), aesthetics, recreation (Lange et al, 2008), safety and preference (Jorgensen et al, 2002) in urban life.
Green areas are also an important supplier of birdsong due to their ecological function as habitats for birds and other animals (Hansson, 2000; Daniels and Kirkpatrick, 2006; Pellissier et al, 2012). Birds are one of the best-known biological groups in cities (Pellissier et al, 2012); thus, birdsong is a frequent, distinct and frequency-adaptable natural sound source in the ambient noise of urbanised
1
Landscape and Urban Planning, 2
areas (Ryan and Brenowitz, 1985; Halfwerk and Slabbekoorn; 2009; Cardoso and Atwell, 2011). Birdsong is ranked at the top of the desired natural urban sounds (Yang and Kang, 2005) and benefits people’s rejuvenation and health through its pleasantness (Gidl f-Gunnarsson and hrstr m, 2007). It also commonly interferes with traffic noise in urban areas (Best et al, 2005; Gidlöf-Gunnarsson et al, 2007; Kang, 2007; Gold, 2010).
Recently, with the emergence of the ‘soundscape’ concept (Zhang & Kang, 2007; Yu & Kang, 2009; Kang & Zhang, 2010; Brown et al , 2011), research on the urban sound environment has been extended to perceptual assessment (Yang &Kang, 2005; Kang, 2007; Joynt & Kang, 2010), where “masking” has been employed to study the interference between natural sounds and urban noise (Nilsson et al, 2009; De Coensel et al, 2011). Masking effects also have been considered as an important urban design technique (Siebein, et al, 2007). Masking, which refers to a significant everyday-life phenomenon in hearing (Yost et al, 2008), has been widely identified and investigated in
terms of two main categories:“energetic masking” and “informational masking” (Nilsson et al, 2009; Durlach et al, 2003; Watson, 2005). Watson (2005) defined the interference among different sounds based only on the physical properties of the sound as “energetic masking” and the masking or interference caused by making the stimulus context variable and uncertain as “informational masking”. It has been demonstrated that as a result of “energetic masking” and “informational masking”, either increasing birdsong loudness or enlarging the visibility of green areas can significantly improve the pleasantness and naturalness of the traffic noise environment (Hao, 2014). Therefore, the main motivation of this study is to determine how to enhance the positive effects of masking for soundscape optimisation from these two perspectives, i.e., increasing birdsong loudness and enlarging the visibility of green areas in urban design.
Urban morphology, which is at the root of urbanism and urban design (Kropt, 2005; Larkham, 2005), has direct and substantial impacts on both outdoor sound propagation (Raydan and Steemers, 2006; Kang, 2007) and space visibility (Yang, et al, 2009; Sander and Manson, 2007). In previous studies on urban environments (e.g., solar potential, atmospheric environment and traffic noise), urban morphological factors, for example building density, building patterns, street layout and coverage and landscaping, have been represented and studied using a number of quantitative urban morphological parameters (Cheng et al, 2006; Xie et al, 2006; Salomons and Pont, 2012). However, there is a shortage of integrated research on green areas from the perspectives of both birdsong loudness and visibility of green areas in the context of urban morphology to suggest practical landscape and urban design guidelines.
Therefore, this study aims at exploring the integrated effects of urban morphological parameters that reflect the 3D nature of green areas and buildings on birdsong loudness and visibility of green areas. Correspondingly, this paper first will show how urban morphology influences these two aspects and then how the two aspects are related.
2. Methodology
2.1 Site sampling
Landscape and Urban Planning, 3
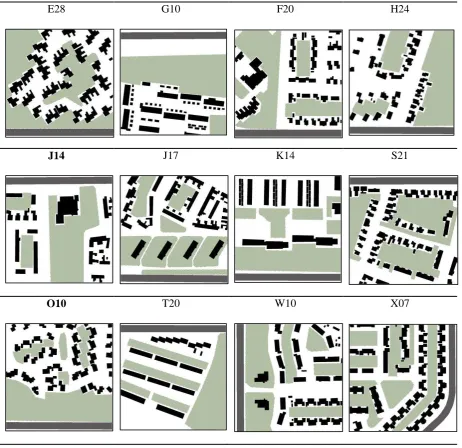
E28 G10 F20 H24
J14 J17 K14 S21
[image:4.595.69.532.82.530.2]O10 T20 W10 X07
Figure 1. Figure-ground maps of the12 sampled study sites. The IDs of the sites are composed by letters and numbers. Green areas are presented in light green, buildings in black, main roads in grey
and all other open areas in white.
2.2 Sound mapping of birdsong
To simulate the spatial distribution of birdsong sound levels, sound maps were calculated using a common noise-mapping package, Cadna/A (DataKustik GmbH, 2006; Szulecki et al, 2010; McGowan, 2012). For noise mapping, the propagation of the frequency components of birdsong was calculated in the models. First, in the simulation, birdsong is emitted from green areas (250 m x 250 m) in eight idealised wild open spaces (see Section 2.2.1); this is a pilot study of birdsong loudness for the further study of birdsong in the actual urban morphology of the sampled sites (see Section 2.2.2).
Landscape and Urban Planning, 4
increased planting of trees may provide more suitable nesting habitats for the tree nesting guild, further increasing their abundance (Huhta et al, 1999; Clergeau et al, 2006; Pellissier et al, 2012).
Patch size and its influence on avian habitats are also important issues to consider in the modelling because the green areas are composed of patches of different sizes in both idealised wide open spaces and the morphology of the study sites. Patch sizes in idealised open spaces vary from 0.28 to 2.25 ha, and the patch sizes in the actual urban morphology are 0.1 to 2.02 ha, except for one patch with an area of 0.06 ha. The effects of patch size on avian density and nesting are debated; it has been suggested that they are not clearly influenced by patch size but vary among regions, number of years of vegetation and species (Winter et al, 2006; Davis, 2004; Schmiegelow and Mönkkönen, 2002; Schieck et al, 1995; Andrén, 1994; Van Dorp and Opdam, 1987). However, van Dorp and Opdam (1987) utilised 0.1 ha as a lower limit for the habitat of birds and proved that multiple bird species inhabited patches of 0.1 ha. Moreover, roads in the residential areas in Assen are primarily two-lane without a disturbed roadside, so they are not considered as patch barriers (Winter et al, 2006). Birds in the small patches can still use the resources of the neighbouring patches (Andrén, 1994). Therefore, although there is a risk that birds may not inhabit the small patches, for this study it was assumed that the fragmentation of the green areas has little influence on avian density in the same region and with similar vegetation and avian species. Given the same green area ratio, the number of birds in each site was set as a constant parameter to compare the effects of urban morphology.
2.2.1 Idealised wide open spaces
To initially examine the influence of geometric configurations of green areas and distributions of sound sources on birdsong loudness without sound obstacles (e.g., buildings), eight idealised wild open spaces were simulated. The open spaces have a consistent green ratio of 36%, which is a control parameter in the sound mapping. The ratio is the same as the green ratio of Assen, as mentioned above. The geometric configurations of the green areas are abstracted from the commonly seen design of green areas in the residential communities in the Assen GIS database. Birdsong may attenuate less rapidly at an intermediate “frequency window” from 1600-2500 Hz, particularly in long-range communication in low-forest habitats (Morton, 1975), the birdsong was initially simulated using a song band source at a representative frequency of 2000 Hz and a representative habitat height of 4 m. Figure 2 shows the sound maps of the birdsong emitted from the eight green areas.
Landscape and Urban Planning, 5
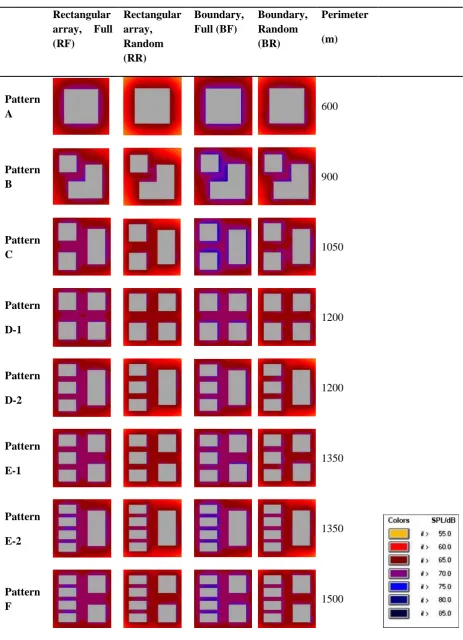
Rectangular array, Full (RF)
Rectangular array, Random (RR)
Boundary, Full (BF)
Boundary, Random (BR)
Perimeter
(m)
Pattern
A 600
Pattern
B 900
Pattern
C 1050
Pattern
D-1
1200
Pattern
D-2
1200
Pattern
E-1
1350
Pattern
E-2
1350
Pattern
[image:6.595.66.530.64.705.2]F 1500
Figure 2. Sound maps of birdsong emitted from 8 typical patterns of green areas. Four different types of sound source distributions in green areas are considered and compared. (Rectangular array, full
distribution of birdsong and random distribution of 50% birdsong ; Boundary, full
Landscape and Urban Planning, 6
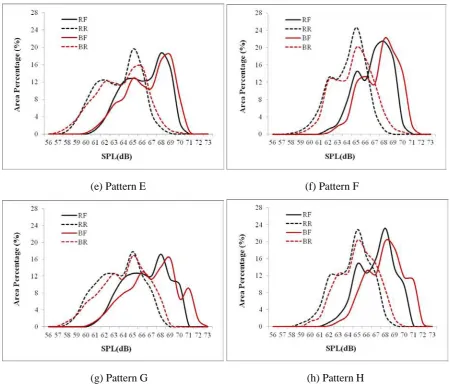
Figure 3 shows the percentage of the areas at different sound levels of birdsong in the eight idealised open spaces. Although the total birdsong energy and green area ratio are the same for the eight open spaces, certain geometric configurations have more area with louder birdsong than others. For example, as shown in Figure 3-b&d, when examining the RF (Rectangular array, full distribution of birdsong), 25.6% of the area in Pattern D-1 has 68 dB birdsong and only 10.1% of the area in Pattern B has 68 dB birdsong. It is also important to note that in general, the four types of sound source distributions of each pattern have rather similar distribution curves (see Figure 3), which indicates that the geometric configurations of the green areas rather than the distributions of individual sound sources may influence the spatial distribution forms of birdsong sound levels outside of the green areas, even when the density of sound sources is reduced by half by random sampling. Therefore, in accordance with Adolphe’s study (2001) on the model of urban morphology, wherein ‘useful area’ is defined as an element in highly mineral urban spaces from the perspective of the environmental performance to simplify the parameterisation of vegetation and bodies of water, the green areas in this study can also be studied as an integrated component with a ‘circumscribed cylinder’ shape (Adolphe, 2001) composed of vegetation and birds in an urban morphology, without particular attention to the distributions of individual sound sources and as demonstrated by the results. Homogenisation effects of urbanisation on biological communities are also an important reason for the hypothesis.
(a) Pattern A (b) Pattern B
Landscape and Urban Planning, 7
(e) Pattern E (f) Pattern F
[image:8.595.71.522.68.454.2](g) Pattern G (h) Pattern H
Figure 3. Area ratios at different sound levels of birdsong outside of the green areas for Pattern A-H (shown in Figure 2) in the eight idealised open spaces, with the 4 types of sound source distributions (i.e., RF, RR, BF and BR). The abbreviation RF means rectangular array, full distribution of birdsong
; RR means rectangular array, random distribution of 50% birdsong ; BF means boundary,
full distribution of birdsong ; BR means boundary, random distribution of 50% birdsong .
It can also be seen in Figure 3-a&b, that in Patterns A and B, more areas have high sound levels of birdsong when birdsong energy is emitted entirely from the boundaries. For example, 10.5% of the area has 71 dB birdsong in Pattern A when it is BF, but this value is only 3.0% when it is RF. The reason might be that Patterns A and B have smaller green area perimeters, therefore the sound level of birdsong per meter is higher than the other six patterns under the condition of the same total amount of sound energy, which results in more peak sound levels in proximity to the green area. As green area perimeter increases, this effect of peak sound levels is generally decreased, as shown in Figure 3-c, d, e, f &h.
Therefore, in the present study of birdsong in the actual urban morphology of the sample sites, the geometric characteristics of green areas rather than the types of sound source distribution are the principal factors examined. The total sound energy of birdsong was set to a constant value based on the assumption that a same size of green area affords a same bird population.
2.2.2 Actual urban morphology
Landscape and Urban Planning, 8
from TOP10NL of Kadaster (Kadaster, 2004). The conditions of building façades and ground were gained from the in-situ investigation and Google Maps. Because the study is more a parameter study on urban morphology, to make the analysis results comparable, the sound sources are all localised along the green area boundaries with a constant distance of 10 m between two trees and emit the same total amount of sound energy of birdsong in each site. The ground absorption was set to 0 outside of green areas and 0.6 inside the green areas.
Great Tit (Parus major), Common Blackbird (Turdus merula) and Sparrow (Passer) are the three common urban passerine bird communities found in Assen. The energy of the birdsong of the three communities concentrates in the frequency range of 2000 to 8000 Hz (Franco and Slabbekoorn, 2009; Pohl et al, 2013; Nemeth et al, 2013; Schmidt et al, 2013), and the frequencies between 2000-8000 Hz are especially impacted by the shape, material and height of noise barriers between the noise source and bird breeding habitat. (Slabbeckoorn and Ripmeester, 2008). Therefore, the birdsong was simulated as single-band sound sources at three representative frequencies, i.e., 2000, 4000 and 8000 Hz. There are two main reasons for the generic setting of the birdsong frequencies. Firstly, the homogenization effects of urbanisation has altered the composition of biological communities (Turner et al, 2004; Marzluff, 2001) and increased species similarity (Blair, 2001). In European cities, heterogeneity of avifauna species in towns is low, especially in the centre, indicating simple urban bird communities and the replacement of specialist species by generalist species (Clergeau et al, 2006; Pellissier et al, 2012). Secondly, urban noise has caused a reduction in avian species richness and the adaption of birdsong to higher frequencies (Francis et al, 2009; Pohl et al, 2013; Nemeth et al, 2013).
As mentioned above, because the building heights are primarily between 8 to 10 meters, the birdsong sources are set to two representative heights in trees in the sites: 4 m (lower than the typical building height) and 10 m (higher than the typical building height); sound reflections by buildings with these two conditions can be compared. Figure 4 shows sound maps of birdsong at 4000 Hz with a sound source height of 4 m, for example.
It is also important to model how urban morphology can impact birdsong distribution when there are fewer birds (as there might be under different ecological environments, e.g., vegetation and climate); therefore the modelled number of birds was reduced to ½ and ¼ of the initial setting.
2.3 Selection and calculation of urban morphological parameters
To quantitatively compare diverse urban textures, urban morphological parameters have been explored, developed and employed in studies of environmental performance, landscape, land use, atmospheric and wind environment (Xie et al, 2006; Adolphe, 2001 Esbah, 2009; Ng et al, 2011; Van de Voorde, 2011). The urban morphological parameters that might be related to birdsong distribution and view of green area have been selected and developed from the perspective of possible effects of urban morphology on outdoor sound propagation (e.g., distance and ground, barrier and canyon effects) and urban view block. The parameters can indicate the characteristics of plot and street pattern, ground and building surface condition and building (barrier) geometry (Kang, 2007; Raydan and Steemers, 2006; Stamps, 2001). Seven quantitative parameters were used in this study: Building Plan Area Fraction (BPAF), Complete Aspect Ratio (CAR), Building Surface Area to Plan Area Ratio (BSAPAR), First-row Building Frontal Length Index (FBFLI), Distance of First-First-row Building to Green Area (DFBGA), Green Area Perimeter (GAP), and Green Area Dispersion Index (GADI). The first three parameters are for 2D and 3D characterisations of buildings, the fourth and fifth characterize the relative locations between buildings and green areas, and the last two parameters are for the 2D characteristics of green areas based on the results of the pilot study.
Landscape and Urban Planning, 9
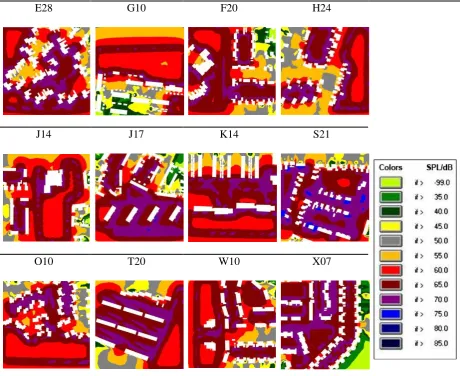
E28 G10 F20 H24
J14 J17 K14 S21
[image:10.595.68.529.83.459.2]O10 T20 W10 X07
Figure 4. Sound maps of birdsong at 4000 Hz at a height of 4 m in the 12 sites.
2.4 Matlab processing
The RGB raster sound maps of the 12 sites are transformed into matrices of spatial sound level values in dB to obtain the spatial sound level indices by a Matlab program developed for this study (Hao and Kang, 2013). For each case, all of the spatial sound level values at each site are ranked in descending order. The spatial sound level indices of Ln, include Lmax, L10, L20, L30, L40, L50, L60, L70, L80, L90 and Lmin, where Ln specifies one certain sound level value at the position of n% in all of the descending values. For example, L10 is the value located at the top 10% in the rankings of all of the spatial noise level values, Lmax means the highest value in the ranking, and Lmin means the lowest value (Wang and Kang, 2011). Lavg is used to indicate the mean of all of the spatial noise levels of a given site. To investigate the birdsong environments both indoors and outdoors, the spatial sound level values on building façades and in open areas were processed separately. In this study the green areas were studied as integrated components that impact birdsong distribution in the spaces outside of green areas, so the spatial sound levels within the green areas were excluded.
2.5 Space syntax for visibility
Landscape and Urban Planning, 10
[image:11.595.65.527.209.757.2]and Duxbury (2001) conducted a study to test the correlation of graph measurement by both Axial Maps and Visibility Graph Analysis (VGA) with observed flow in central London, which shows that the measure of visibility by Visibility Graph Analysis performed significantly better than the Axial Map measures. Therefore, in this study, the visibility of the green areas of each site was measured as the mean value of visual connectivity in VGA. The seed points were spaced on all of the green areas with a 5 m x 5 m gird, with vector plans of the sites at an eye level of 1.6 m. The connectivity of each location refers to how many locations each node can directly see (Turner, 2004), and the value ranges of connectivity vary widely depending on the site situation analysed (e.g., area size and obstacle).
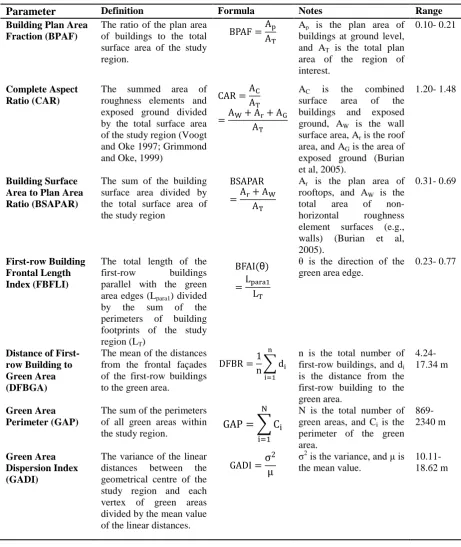
Table 1. Calculations of the seven urban morphological parameters.
Parameter Definition Formula Notes Range
Building Plan Area Fraction (BPAF)
The ratio of the plan area of buildings to the total surface area of the study region.
BPAF =A A
Ap is the plan area of
buildings at ground level, and AT is the total plan
area of the region of interest.
0.10- 0.21
Complete Aspect Ratio (CAR)
The summed area of roughness elements and exposed ground divided by the total surface area of the study region (Voogt and Oke 1997; Grimmond and Oke, 1999)
CAR =A A
=A + A + A A
AC is the combined
surface area of the buildings and exposed ground, AW is the wall
surface area, Ar is the roof
area, and AG is the area of
exposed ground (Burian et al, 2005).
1.20- 1.48
Building Surface Area to Plan Area Ratio (BSAPAR)
The sum of the building surface area divided by the total surface area of the study region
BSAPAR
=A + A A
Ar is the plan area of
rooftops, and AW is the
total area of non-horizontal roughness element surfaces (e.g., walls) (Burian et al, 2005).
0.31- 0.69
First-row Building Frontal Length Index (FBFLI)
The total length of the first-row buildings parallel with the green area edges (Lpara1) divided
by the sum of the perimeters of building footprints of the study region (LT)
BFAI( )
=L L
is the direction of the
green area edge.
0.23- 0.77
Distance of First-row Building to Green Area (DFBGA)
The mean of the distances from the frontal façades of the first-row buildings to the green area.
DFBR =1
n d
n is the total number of first-row buildings, and di
is the distance from the first-row building to the green area.
4.24-17.34 m
Green Area Perimeter (GAP)
The sum of the perimeters of all green areas within
the study region. GAP = C
N is the total number of green areas, and Ci is the
perimeter of the green area. 869- 2340 m Green Area Dispersion Index (GADI)
The variance of the linear distances between the geometrical centre of the study region and each vertex of green areas divided by the mean value of the linear distances.
GADI =
2 2is the variance, and is
the mean value.
10.11-18.62 m
Landscape and Urban Planning, 11
3. Results
This section addresses three issues: (1) what are the characteristics of birdsong distribution in the actual urban morphology; (2) how do the urban morphological parameters influence audibility of birdsong and visibility of green areas; (3) does visibility of green areas have any relationship to birdsong loudness.
3.1 Birdsong loudness in actual urban morphology
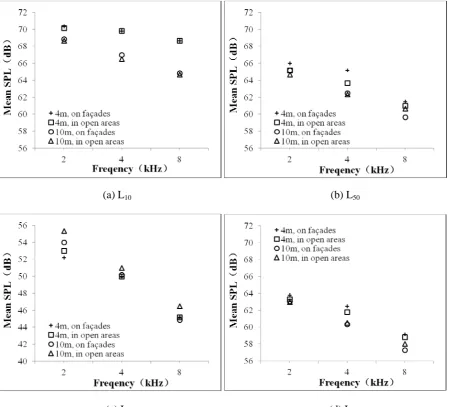
Figure 5 shows the mean sound levels of birdsong of the 12 sampled sites at 2000, 4000 and 8000 Hz in terms of spatial sound level indices of L10 L50, L90 and Lavg, where it can be seen that the mean sound levels are 1-4 dB higher when the sound sources are 4 m high than at 10 m for L10, L50 or Lavg, in both open areas and on facades, while for L90, the mean sound levels in open areas are 0-2 dB higher when the height is 10 m. Therefore, to generally increase the birdsong loudness in low-density residential areas, the species of tree-dwelling birds that have lower habitats are preferred, whereas to raise the birdsong loudness in areas far from green areas, birds with more elevated habitats are preferred.
(a) L10 (b) L50
[image:12.595.75.526.297.704.2](c) L90 (d) Lavg
Landscape and Urban Planning, 12
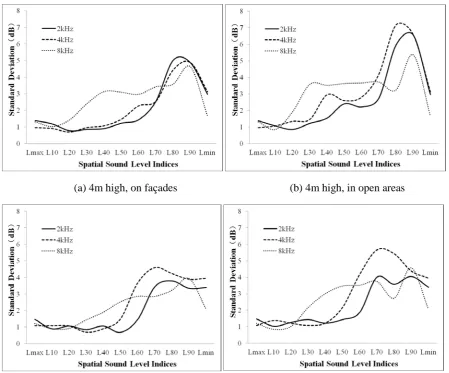
Different urban morphologies indeed induce different spatial birdsong distributions, as indicated by the standard deviations of the spatial sound level indices among the sampled sites in Figure 6. The spatial sound level indices L70, L80 and L90 have higher variations than the other indices at 2000 and 4000 Hz, both on façades and in open areas, as shown in Figure 6, which means spatial sound level distributions of birdsong are more sensitive to urban morphology at 2000 and 4000 Hz in relatively quiet areas. The largest variation occurs at L80 at 4000 Hz in open areas when sound sources are 4 m high, with a standard deviation as 7.2 dB, followed by L90 at 2000 Hz in open areas (6.6 dB) (see Figure 6). The standard deviations of the indices for louder birdsong areas (e.g., L20, L30, L40 and L50) at 8000 Hz are larger than those at 2000 and 4000 Hz (see Figure 6), especially for a height of 4 m; this may be because building barrier effects are crucial for the attenuation of high frequency sound components at shorter distances, which increases the influence of urban morphology on the birdsong environment in the proximity of green areas.
(a) 4m high, on façades (b) 4m high, in open areas
(c) 10m high, on façades (d) 10m high, in open areas
Figure 6. Standard deviations of spatial sound level indices of the 12 sites, at frequencies of 2000, 4000 and 8000 Hz.
It is also important to note that the spatial sound level distribution on façades and in open areas shows different characteristics from the perspective of variation (see Figure 6-a&b, c&d), although their differences of mean values of the indices are not large in Figure 5. Accordingly, this study will further investigate birdsong attenuation from the viewpoints of both façades and open areas, which concerns not only indoor birdsong from green areas but also the incidence of birdsong in open space.
[image:13.595.71.521.229.602.2]Landscape and Urban Planning, 13
the same as those of the full number of birds, which means the impacts of urban morphology on birdsong distribution remain constant, and the rules still work when the number of birds is reduced. However, the perceived loudness of birdsong may be significantly reduced when the spatial sound levels are reduced by 6 dB.
3.2 Relationships with urban morphological parameters
The values of the seven urban morphological parameters of the sampled sites were first calculated according to the formulas in Table 1. In general, the values of each parameter evenly distribute in the ranges (see Table 1), indicating a quantitative diversity of the urban morphologies of the sites within the ranges.
3.2.1 Birdsong loudness
To investigate whether and how the spatial sound level distribution of birdsong is related to urban morphology, a correlation analysis was conducted between urban morphological parameters and the indices of L60, L70, L80 and L90, which have higher variations, as shown in Figure 6. Table 2 shows the R-squared values of the linear regressions between the parameters and indices, which have significant bivariate correlations (p<0.05, two tailed). The results show that the spatial sound level indices are related to the urban morphological parameters. The indices are more correlated to the parameters when the sound sources are at a height of 4 m than when the sources are a height of 10 m (see Table 2). It is not surprising that the indices at 8000 Hz are more strongly correlated than at 2000 and 4000 Hz because building barrier effects play a more significant role on attenuation at the relatively high frequency components of birdsong.
Table 2. Significant relationships between spatial sound level indices of birdsong and urban morphological parameters in terms of the R-squared values of linear regression, where * indicates p<0.05 level (2-tailed), and ** indicates p<0.01 level (2-tailed) in Bivariate Correlation.
Urban Morphological Parameters
Indices
BPAF CAR BSAPAR FBFLI DFBGA GAP GADI
4m, 2 kHz Façades L70 .341*
4m, 4 kHz Façades L70 .340*
4m, 8 kHz Façades L70 .463* .357* .591**
Open Areas
L70 .491* .400* .397* .380*
L80 .375*
10m, 8kHz Façades L60 .395* .409* .514*
L70 .618**
Open Areas
L60 .491*
L70 .347* .409*
Landscape and Urban Planning, 14
relationships between the indices and urban morphological parameters and green areas. In the range 869 to 2340 m, when Green Area Perimeter increases, L60 at 8000 Hz constantly increases, and the differences among the sites are rather large (i.e., 11 dB) (see Figure 7-a); even the Green Ratios of the sites are constant. L70 at 8000 Hz increases with an increase of Green Area Dispersion Index in the range 10.1 to 18.6, and the value differences of L70 are up to 10 dB (see Figure 7-b). In conclusion, to enhance the birdsong loudness in a site with a certain Green Ratio, it is important to segment green areas, increase the boundary lengths of green areas, and scatter green areas throughout the whole site.
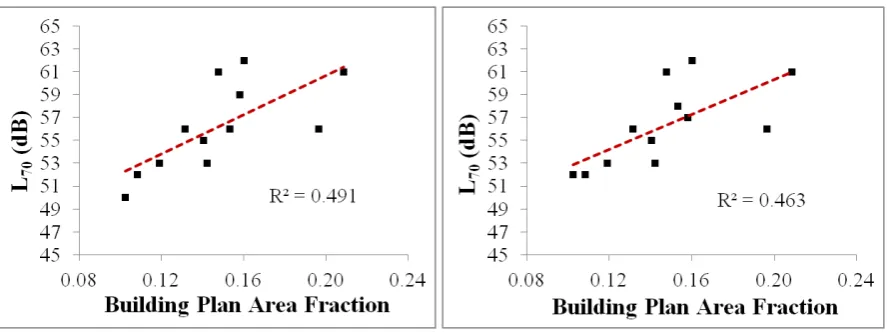
Building Plan Area Fraction, which refers only to 2D building information, is the most significant building-related parameter according to the correlation analysis in Table 2. Figure 8 shows the positive relationships between the indices and BPAF in a range from 0.1 to 0.2, indicating that the reflections of birdsong by buildings are crucial for increasing birdsong loudness in relatively quiet areas.
[image:15.595.73.523.230.398.2](a) 10 m, 8000 Hz, in open areas (b) 10 m, 8000 Hz, on façades
Figure 7. Relationships between spatial sound level indices of birdsong and urban morphological parameters of green areas.
(a) 4m high, 8000 Hz, in open areas (b) 4m high, 8000 Hz, on façades
Figure 8. Relationships between spatial sound level indices of birdsong and Building Plan Area Fraction.
3.2.2 Visibility of green areas
[image:15.595.79.523.461.627.2]Landscape and Urban Planning, 15
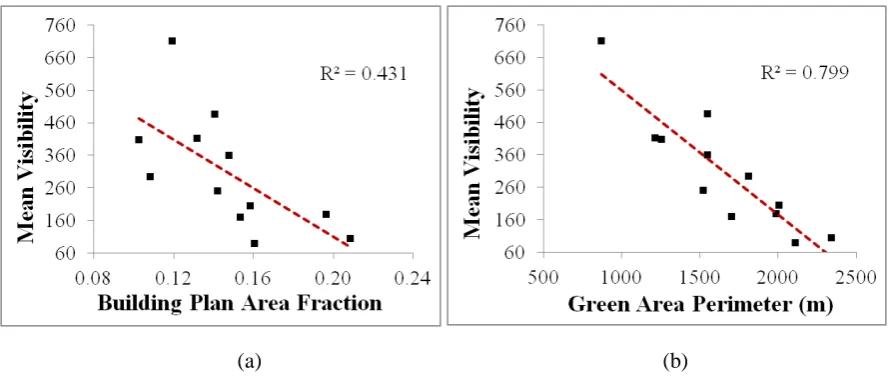
significantly correlated to Building Plan Area Fraction (p=0.020), Building Surface Area to Plan Area Ratio (p=0.043) and Green Area Perimeter (p=0.000). In accordance with the analysis results on birdsong and urban morphology, the parameters on the relative locations between buildings and green areas (FBFLI and DFBGA) have little influence on visibility of green area. Unsurprisingly, the visibility of green area decreases when BPAF increases (see Figure 9-a), which means sites with lower building density have higher visibility of green areas. As shown in Figure 9-b, another important parameter is Green Area Perimeter, which has a rather significant negative relationship with the visibility of green areas because the segmenting of green areas may enhance the effects of view block by buildings.
It is important to notice that, in contrast to the positive relations between birdsong loudness in relatively quiet areas and urban morphological parameters, the significant relations between the visibility of green areas and the three correlated parameters are all negative. Hence, in practical designs, the control of the parameters in this study almost entirely depends on which aspect is the main concern.
[image:16.595.73.518.266.454.2](a) (b)
Figure 9. Relationships between visibility of green areas and urban morphological parameters.
3.3 Relationship between visibility of green areas and birdsong loudness
To examine possible relationships between visibility of green areas and spatial sound level distribution of birdsong, an analysis was performed (Table 3). It can be seen that the mean visibility has significant correlations (p<0.050, 2 tailed) with spatial sound level indices of birdsong primarily at 4 m, both on façades and in open areas; when the height is 10 m, the significant correlations merely exist at 8000 Hz. Compared to the 2000 Hz frequency, the 4000 and 8000 Hz frequencies have more significant correlations (see Table 3), which means that the visibility of green area is more correlated to the sound propagation of higher frequency components of birdsong.
Landscape and Urban Planning, 16
[image:17.595.88.518.129.723.2]enhances the audibility of birdsong in the relatively quiet areas, in accordance with the results in Section 3.2.1.
Table 3. Significant relationships, i.e., p<0.05 level (2-tailed), between spatial sound level indices of birdsong and mean visibility in terms of p value in Bivariate Correlation.
Height of Frequency Indices p value
Façades
4 2 Lmax .001
4
4
Lmax .020 L60 .013 8
8
8
L30 .024 L40 .025 L50 .035 Lmin .032
10 8
8
8
Lmax .028 L20 .034 L40 .039 Lmin .034
Open areas
4 2 Lmax .001
4
4
4
Lmax .020 L20 .010 L40 .022 L50 .018 8
8
8
L30 .018 L50 .038 L60 .015 Lmin .032
10 8
8
8
Lmax .028 L10 .029 L60 .036 Lmin .034
Landscape and Urban Planning, 17
[image:18.595.72.526.68.246.2](c) 4 m, 4000 Hz, in open areas (d) 4 m, 4000 Hz, on façades
Figure 10. Relationships between visibility of green areas and spatial sound level indices of birdsong.
4. Discussion
Based on actual situations of birdsong and traffic noise in Assen, parallel lab experiments have been conducted to investigate the impact of the acoustic characteristics of the two sounds on the masking effects (Hao, 2014). The results show that when birdsong loudness increases, the masking effects of birdsong become more significant, the naturalness and pleasantness of the soundscape increase, and annoyance decreases. The study also shows that occurrence frequency of birdsong is a significant factor that influences masking effects. As the occurrence frequency of birdsong increases, the soundscape quality increases continuously (Hao, 2014), so it is also meaningful to attract bird species that chirp more frequently to inhabit the areas.
The ecology of bird habitat and vegetation structure is the bases for the study of birdsong distribution. The ecological issues, such as patch size, bird density, effects of surrounding noise and habitat height, can be seen in this study. For example, to generally enhance birdsong loudness over a whole site in an actual urban area, species of tree birds that live in lower habitats are preferred because it has been demonstrated that with either L10, L50 or Lavg the mean sound levels at all of the sampled sites are 1-4 dB higher when the sound sources are 4 m high (lower than the surrounding buildings at 8-10 m) than those at 10 m. Additionally, compared to 10 m, when the height of sound source is 4 m, urban morphology has a greater impact on birdsong loudness in the low-density residential areas. Green areas can be studied as integrated components for their birdsong emissions, and the impacts of urban morphology on birdsong propagation are not reduced by a reduction of bird density in one region in a certain range.
Landscape and Urban Planning, 18
Index and Distance of First-row Building to Green Area, have little influence on either birdsong loudness or green area visibility.
In a parallel study (Hao, 2014), it was also demonstrated that visibility of green areas can enhance the masking effects through aural-visual interaction. In this study, it has been shown that in areas further from green areas, urban morphology that has higher green area visibility has lower birdsong loudness due to the reduction of sound reflected by the buildings. Therefore, “informational masking” in the visual context can play an important role on the masking effects by compensating for the reduced “energetic masking” in these areas.
Additionally, the masking effects of birdsong are more efficient when the road traffic noise environment is relatively low, i.e. approximately 50 dBA (Hao, 2014). Therefore, to optimise soundscape design, in addition to increasing the loudness and occurrence frequency of birdsong, attenuating the traffic noise level is essential.
5. Conclusions
This study explores how urban morphology influences the incidence of green area from the perspective of audibility of birdsong and visibility of green areas in meso-scale, low-density residential areas. Seven urban morphological parameters that are related to building characteristics, the relative locations of buildings and green areas, and characteristics of green areas were defined. Noise mapping techniques and Visibility Graph Analysis in Space Syntax were employed to analyse the sampled sites with diverse urban morphologies.
The results show that birdsong loudness has significant, positive linear relationships with urban morphological parameters, including Building Plan Area Fraction (R2=0.491), Green Area Perimeters (R2=0.491) and Green Area Dispersion Index (R2=.618), while visibility of green area has negative linear relationships with morphological parameters, including Building Plan Area Fraction (R2=0.431) and Green Area Perimeters (R2=0.799). It was also found that in the proximity of green areas, the visibility of green areas has positive relationships with birdsong loudness, whereas in most areas further from green areas, the visibility of green areas has a negative relationship with birdsong loudness.
To conclude, controlling the urban morphological parameters (e.g., Green Area Perimeter and Building Plan Area Fraction) is an efficient and integrated implementation measure to optimise the sonic and visual environment of birdsong. The masking effects of birdsong can be considered as a design technique in terms of both “energetic masking” and “informational masking” in the soundscape. Meanwhile, it is crucial to carefully consider the ecology of bird habitat and vegetation to enhance the role of urban morphology on birdsong loudness and the visibility of green areas.
Acknowledgements
This project is supported by the Northern Netherlands Provincesand funded by the European Fund for Regional Development, theDutch Ministry of Economic Affairs, Peaks in the Delta, and ChinaNSF (50928801). The authors are indebted to the other members atthe Acoustic Group of School of Architecture, University of Sheffieldfor their kindly help, and the Assen Municipality for their collabo-ration on this work.
References:
Adolphe, L. (2001). A simplified model of urban morphology: application to an analysis of the environmental performance of cities. Environment and Planning B: Planning and Design 28, 183- 200.
Anderson, L.M. & Cordell, H.K. (1988) Influence of trees on residential property values in Athens, Andrén, H. (1994). Effects of habitat fragmentation on birds and mammals in landscapes with different proportions of suitable habitat: a review. Oikos71, 355-366.
Landscape and Urban Planning, 19
Assen Municipality (2011). Assen in cijfers. Retrieved February 08, 2012 from:
Bafna, S. (2003). Space Syntax: A brief introduction to its logic and analytical techniques. Environment and Behavior 35(1), 17-29.
Best, V., Ozmeral, E., Gallun, F. J., Sen, K., Shinn-Cunningham, B. G. (2005). Spatial unmasking of birdsong in human listeners: Energetic and informational factors. J Acoust Soc Am. 118, 3766–3773.
Blair, R.B. (2001). Creating a homogenous avifauna. In Marzluff, J.M., Bowman, R. & Donnelly, R. (Eds.), Avian Ecology and Conservation in an Urbanizing World (pp. 459–486). Boston: Kluwer Academic Publisher.
Brown, A. L., Kang, J., & Gjestland, T. (2011). Towards standardization in soundscapepreference assessment. Applied Acoustics, 72(6), 387–392.
Burian, S.J. Han, W.S. & Brown, M.J. (2005) Morphological analyses using 3D building databases: Oklahoma City, Oklahoma. LA-UR-05-1821, Los Alamos National Laboratory, Los Alamos, New Mexico.
Cardoso, G. C. & Atwell, J. W. (2011). On the relation between loudness and the increased song frequency of urban birds. Animal Behaviour 82, 831-836.
Cheng, V., Steemers, K., Montavon, M. & Compagnon, R. (2006). Urban form, density and solar potential. Proceedings of the 23rd Conference on Passive and Low Energy Architecture, Geneva, Switzerland.
Clergeau, P., Croci, S., Jokimäki, J., Kaisanlahti-Jokimäki M. L. & Dinetti M. (2006). Avifauna homogenisation by urbanisation: Analysis at different European latitudes. Biological Conservation 127, 336-344.
Currie, B.A. & Bass, B. (2008). Estimates of air pollution mitigation with green plants and green roofs using the UFORE model. Urban Ecosyst 11, 409–422.
Daniels, G. D., & Kirkpatrick, J. B. (2006). Does variation in garden characteristics influence the conservation of birds in suburbia? Biological Conservation 133, 326–335.
DataKustik GmbH (2006). Cadna/A for windows – user manual. Greifenberg.
Davis, S. K. (2004). Area sensitivity in grassland passerines: effects of patch size, patch shape, and vegetation structure on bird abundance and occurrence in southern Saskatchewan. The Auk 121(4), 1130-1145.
De Coensel, B., Vanwetswinkel, S. & Botteldooren, D. (2011). Effects of natural sounds on the perception of road traffic noise. J. Acoust. Soc. Am. 129 (4), p.EL148-EL153.
De Hollander, A.E.M. & Staatsen, B.A.M. (2003). Health, environment and quality of life: an epidemiological perspective on urban development. Landscape and Urban Planning 65, 53–62.
Desyllas, J. & Duxbury, E. (2001). Axial Maps and Visibility Graph Analysis: A comparison of their methodology and use in models of urban pedestrian movement. Proceedings of the Space Syntax Third International Symposium, Atlanta, Georgia Tech.
Durlach, N. I., Mason, C. R., Kidd, G., Jr., Arbogast, T. L., Colburn, H. S., &Shinn-Cunningham, B. G. (2003). Note on informational masking (L). Journal ofthe Acoustical Society of America, 113, 2984– 2987.
Esbah, H. (2009). Analyzing landscape change through landscape structure indices: Case of the City of Aydin, Turkey. Journal of Applied Sciences 9, 2744-2752.
Fang, C. F. & Ling, D. L. (2003). Investigation of the noise reduction provided by tree belts. Landscape and Urban Planning 63, 187–195.
Landscape and Urban Planning, 20
Franco, P. & Slabbekoorn, H. (2009). Repertoire size and composition in great tits: a flexibility test using playbacks. Animal Behaviour 77, 261-269.
Gemeente Assen (2006). Groenstructuurvisie (in Dutch). Retrieved June 03, 2012 from: http://www.assen.nl/dsresource?objectid=7388&type
Gemeente Assen (2009) Het Groene Frame van Assen (in Dutch). Retrieved June 03, 2012 from: www.assen.nl/dsresource?objectid=8559
Gidl f-Gunnarsson, A. & hrstr m, E. (2007). Noise and well -being in urban residential environments: The potential role of perceived availability to nearby green areas. Landscape and urban planning 83, 115-126.
Gidlöf-Gunnarsson, A., Öhrström, E. & Ögren, M. (2007). Noise annoyance and restoration in different courtyard settings: Laboratory experiments on audio-visual interactions. Proceedings of Internoise 2007, Istabul, Turkey.
Gold, M. (2010). Planning for the Soundscape of Transportation. Proceedings of Designing Soundscape for Sustainable Urban Development, Stockholm, Sweden.
Grimmond, S. & Oke T. (1999). Aerodynamic properties of urban areas derived from analysis of surface form. J. Appl. Met. 38, 1262-1292.
Halfwerk, W. & Slabbekoorn, H. (2009). A behavioural mechanism explaining noise-dependent frequency use in urban birdsong. Animal Behaviour 78, 1301–1307.
Hansson, L. (1994). Vertebrate distributions relative to clear-cut edges in a boreal forest landscape. Landscape Ecology (2), 105-115.
Hansson, L. (2000). Edge structures and edge effects on plants and birds in ancient oak-hazel woodlands. Landscape and Urban Planning 46, 203-207.
Hao Y. & Kang, J. (2013). Traffic resistance of low-density residential areas in context of urban morphology. Proceedings of Conference AIA-DAGA 2013, Merano, Italy.
Hao Y. (2014). Effects of Urban Morphology on Urban Sound Environment from the Perspective of Masking Effects. PhD thesis, University of Sheffield.
Hillier, B. (2012). Studying cities to learn about minds: Some possible implications of space syntax for spatial cognition. Environment and Planning B: Planning and Design 39(1), 12 – 32.
Huhta, E., Jokimäki J. & Rahko P. (1999). Breeding success of pied flycatchers in artificial forest edges: the effect of a suboptimally shaped foraging area. The Auk 116(2), 528-535.
Jiang, B. & Claramunt, C. (2002). Integration of space syntax into GIS: New perspectives for urban morphology. Transactions in GIS 6(3), 295–309.
Jorgensen, A., Hitchmough, J. & Calvert T. (2002). Woodland spaces and edges: their impact on perception of safety and preference. Landscape and Urban Planning 60, 135–150.
Joynt, J., & Kang, J. (2010). The influence of preconceptions on perceived sound reduction by environmental noise barriers. Science of the Total Environment, 408(20),4368–4375.
Kadaster (2008). TOP10NL. Retrieved March 03, 2012 from:
Kang, J. (2007). Urban Sound Environment. London: Taylor Francis.
Kang, J., & Zhang, M. (2010). Semantic differential analysis of the soundscape inurban open public spaces. Building and Environment, 45(1), 150–157.
Landscape and Urban Planning, 21
Kropt P. (2005). The handling characteristics of urban form. In Evans, R. (Eds), Urban Morphology, Urban Design (pp. 9317-9318). London: Urban Design Group.
Lange, E., Hehl-Lange, S. & Brewer M. J. (2008). Scenario-visualization for the assessment of perceived green space qualities at the urban–rural fringe. Journal of Environmental Management 89, 245–256.
Larkham, P. (2005). Understanding urban form? In Evans, R. (Eds), Urban Morphology, Urban Design (pp. 22-24). London: Urban Design Group.
Marzluff, J.M. (2001). Worldwide urbanization and its effects on birds. In Marzluff, J.M., Bowman, R., Donnelly, R. (Eds.), Avian Ecology and Conservation in an Urbanizing World (pp. 19–47). Boston: Kluwer Academic Publishers.
McCollin, D. (1998). Forest edges and habitat selection in birds. Ecography 21(3), 225–335.
McGowan, E. W.
(
2012)
. The effect of building reflections on the equivalent noise level (Leq) from traffic on Lake Shore Drive.J. Acoust. Soc. Am. 132, 2085-2085.
Morton, E.S. (1975). Ecological sources of selection on avian sounds. American Naturalist 109, 17-34.
Nemeth, E., Pieretti, N., Zollinger, S. A., Geberzahn, N., Partecke, J., Miranda, A. C. and Brumme, H. (2013). Bird song and anthropogenic noise: vocal constraints may explain why birds sing higher-frequency songs in cities. Proceedings of the Royal Society B-Biological Sciences 280, 1–7.
Nilsson, M. E., Alvarsson J. & Rådsten-Ekman, M. (2009). Loudness of Fountain and Road Traffic Sounds in a City Park. Proceedings of the 16th International Congress on Sound and Vibration, Krakow, Poland.
Ng, E., Yuan, C., Chen, L., Ren, C. & Fung, J.C.H. (2011). Improving the wind environment in high-density cities by understanding urban morphology and surface roughness: A study in Hong Kong. Landscape and Urban Planning 101, 59–74.
Pellissier, V., Cohen, M., Boulay, A. & Clergeau, P. (2012). Birds are also sensitive to landscape composition and configuration within the city centre. Landscape and Urban Planning 104, 181– 188.
Pohl, N.U., Leadbeater, E., Slabbekoorn, H. Klump G.M. & Langemann, U. (2012). Great tits in urban noise benefit from high frequencies in song detection and discrimination. Animal Behaviour 83, 711-721.
Raydan, D. & Steemers, K. (2006). Environmental urban design. In Santamouris, M. (Eds), Environmental Design of Urban Buildings: An Integrated Approach (pp. 1-35). London: Earthscan.
Ryan, M. J. & Brenowitz, E. A. (1985). The role of body size, phylogeny, and ambient noise in the evolution of bird song. The American Naturalist 126(1), 87-100.
Salomons, E.M. & Pont, M.B. (2012). Urban traffic noise and the relation to urban density, form, and traffic elasticity. Landscape and Urban Planning 108 (1), 2–16.
Sander, H. A. & S. M. (2007). Heights and locations of artificial structures in viewshed calculation: How close is close enough? Landscape and Urban Planning 82 (4), 257-270.
Schieck, J., Lertzman, K., Nyberg, B. & Page, R. (1995) Effects of patch size on birds in old-growth montane forests. Conservation Biology 9 (5), 1072–1084.
Schmidt, K. L., Moore, S. D., MacDougall-Shackleton, E. A., MacDougall-Shackleton, S. A. (2013). Early-life stress affects song complexity, song learning and volume of the brain nucleus RA in adult male song sparrows. Animal Behaviour 86(1), 25-35.
Schmiegelow, F. K. A. & Mönkkönen, M. (2002). Habitat loss and fragmentation in dynamic landscapes: avian perspectives from the boreal forest. Ecological Applications 12 (2), 375-389.
Landscape and Urban Planning, 22
Siebein, G. W., Kwon, Y., Smitthakorn, P. & Gold, M. A. (2007). Case study of soundscape assessment and design methods. J. Acoust. Soc. Am. 121(5), 3113-3113.
Stamps, A. E. (2001). Evaluating enclosure in urban sites. Landscape and Urban Planning 57(1), 25– 42.
Slabbeckoorn, H. & Ripmeester, E.A. (2008). Birdsong and anthropogenic noise: implications and applications for conservation. Molecular Ecology 17 (1), 72-83.
Szulecki, S., Zwerling, E., Anderson, C. & Turpin, B. (2010). Modeling with the use of the commercial software package CADNAA (Computer-Aided Noise Abatement) to estimate the probability of awakening associated with train horns. (A). J. Acoust. Soc. Am. 127, 1764-1764.
Turner, A. (2003). Analysing the visual dynamics of spatial morphology. Environment and Planning B: Planning and Design 30, 657–676.
Turner, A. (2004). Depthmap 4: A researcher's handbook, London: Bartlett School of Graduate Studies, University College London.
Turner, W.R., Nakamura, T.& Dinetti, M.(2004). Global urbanization and the separation of humans from nature. BioScience 54, 585–590.
Van de Voorde, T., Jacquet, W. & Canters, F.(2011). Mapping form and function in urban areas: An approach based on urban metrics and continuous impervious surface data. Landscape and Urban Planning 102, 143– 155.
forest bird communities
Van Renterghem, T., Botteldooren D. & Verheyen K. (2012). Road traffic noise shielding by vegetation belts of limited depth. Journal of Sound and Vibration 331, 2404–2425.
Voogt, J. & Oke, T. (1997). Complete urban surface temperatures. J. Appl. Met. 36, 1117-
1132.
Wang, B. & Kang, J. (2011). Effects of urban morphology on the traffic noise distribution through noise mapping: A comparative study between UK and China. Applied Acoustics 72, 556-568.
Watson, C. S. (2005). Some Comments on informational masking. Acta Acustica unitedwith Acustica, 91, 502–512.
Winter, M., Johnson, D. H., Sharffer, J. A., Donovan, T. M. & Svedarsky, W. D. (2006). Patch size and landscape effects on density and nesting success of grassland birds. Journal of Wildlife Management 70 (1), 158-172.
Xie, X., Huang, Z. & Wang, J. (2006). The impact of urban street layout on local atmospheric environment. Building and Environment 41, 1352–1363.
Yang, J., Zhao, L., Mcbride, J. & Gong, P. (2009). Can you see green? Assessing the visibility of urban forests in cities. Landscape and Urban Planning 91, 97–104.
Yang, W. & Kang, J. (2005). Soundscapes and sound preferences in urban squares. J. Urban Des. 10, 69–88.
Yost, W. A. (2008). Perceiving sound sources. In W. A. Yost, A. N. Popper, & R. R. Fay(Eds.), Auditory Perception of Sound Source (pp. 1–12). New York: Springer.
Yu, L. & Kang, J. (2010). Factors influencing the sound preference in urban open spaces. Applied Acoustics 71 (7), 622-633.