This is a repository copy of
Using isoelectric point to determine the pH for initial protein
crystallisation trials
.
White Rose Research Online URL for this paper:
http://eprints.whiterose.ac.uk/92629/
Version: Published Version
Article:
Kirkwood, Jobie Samuel, Hargreaves, David, O'Keefe, Simon
orcid.org/0000-0001-5957-2474 et al. (1 more author) (2015) Using isoelectric point to
determine the pH for initial protein crystallisation trials. Bioinformatics. pp. 1444-1451.
ISSN 1460-2059
https://doi.org/10.1093/bioinformatics/btv011
[email protected]
https://eprints.whiterose.ac.uk/
Reuse
Items deposited in White Rose Research Online are protected by copyright, with all rights reserved unless
indicated otherwise. They may be downloaded and/or printed for private study, or other acts as permitted by
national copyright laws. The publisher or other rights holders may allow further reproduction and re-use of
the full text version. This is indicated by the licence information on the White Rose Research Online record
for the item.
Takedown
If you consider content in White Rose Research Online to be in breach of UK law, please notify us by
Databases and ontologies
Using isoelectric point to determine the pH for
initial protein crystallization trials
5
Jobie Kirkwood
1,
David Hargreaves
2,
Simon O’Keefe
3and
Julie Wilson
1,4,*
1
Department of Chemistry, University of York, YO10 5DD, UK,
2Discovery Sciences, Structure & Biophysics,
AstraZeneca Darwin Building, Cambridge, Science Park, Milton Road, Cambridge, CB4 0WG, UK,
3Department of
10
Computer Science, University of York, YO10 5GH, UK and
4Department of Mathematics, University of York, YO10
5DD, UK
*To whom correspondence should be addressed. Associate Editor: Igor Jurisica
Received on September 26, 2014; revised on January 5, 2015; accepted on January 5, 2015
15
Abstract
Motivation:
The identification of suitable conditions for crystallization is a rate-limiting step in
pro-tein structure determination. The pH of an experiment is an important parameter and has the
po-tential to be used in data-mining studies to help reduce the number of crystallization trials required.
However, the pH is usually recorded as that of the buffer solution, which can be highly inaccurate.
20Results:
Here, we show that a better estimate of the true pH can be predicted by considering not
only the buffer pH but also any other chemicals in the crystallization solution. We use these more
accurate pH values to investigate the disputed relationship between the pI of a protein and the pH
at which it crystallizes.
Availability and implementation:
Data used to generate models are available as
Supplementary
25Material
.
Contact:
[email protected]
Supplementary information:
Supplementary data
are available at
Bioinformatics
online.
1 Introduction
As the predominant method used to determine molecular structure, 30 X-ray crystallography can provide information on the atomic level processes of proteins and, in turn, enable the development of thera-peutic drugs. In order to determine the structure of a target protein by X-ray crystallography, the protein must be cloned and expressed be-fore the soluble fraction is purified for crystallization. Only when dif-35 fraction quality crystals are obtained can the structure be determined. Although many protein structures have been solved to date, these only account for some 3% of all possible protein targets (TargetDB, 2010), with membrane protein structures being particularly challenging (Caffrey, 2003) and underrepresented (Doerr, 2008). The use of a
pri-40 ori information about a protein to ascertain the optimal initial condi-tions before experimentation could help reduce the number of trials required which is valuable when protein sample availability is scarce. Following the advent of online repositories, such as the Protein Data
Bank (PDB) (Bermanet al., 2000) and the Biological Macrmolecule
45
Crystallization Database (Tung and Gallagher, 2008) set up specific-ally for the development of crystallization strategies (Gillilandet al., 1994), it has been possible to analyse the data from successful experi-ments and determine favourable regions of crystallization parameter space.
50 It has been shown that protein family can indicate a region of par-ameter space in which a protein is likely to crystallize (Hennessyet al., 2000) and that properties such as amino acid frequency, sequence length, grand average of hydrophobicity (GRAVY) (Kyte and Doolittle, 1982) and isoelectric point (pI) as well as other properties
55
can determine a protein’s propensity to crystallize (Smialowskiet al.,
2006;Chenet al., 2007;Overtonet al., 2008). Investigations have
also indicated that the isoelectric point could be used to determine the pH at which a protein with an acidic isoelectric point is likely to crys-tallize (Kantardjieff and Rupp, 2004;Charleset al., 2006).
VCThe Author 2015. Published by Oxford University Press. 1
This is an Open Access article distributed under the terms of the Creative Commons Attribution License (http://creativecommons.org/licenses/by/4.0/), which permits unrestricted reuse, distribution, and reproduction in any medium, provided the original work is properly cited.
Crystallization is often described as a two-stage process, with the first step being identification of the conditions that allow crystalliza-tion, followed by the optimization of these conditions to obtain dif-fraction-quality crystals (Luftet al., 2003;McPherson, 2004). This
5 study focuses on the first stage—the identification of conditions that encourage crystallization. An analysis of 9596 structures obtained from the PDB suggested a link between a protein’s pI and the pH at which it would crystallize. It was found that acidic proteins tended to crystallize 0–2.5 pH units above their pI, whereas basic proteins 10 crystallized 0.5–3 pH units below their pI (Kantardjieff and Rupp, 2004). The authors reported a correlation between pI and pH–pI that was challenged with claims that the predictive statements had been made using a misinterpretation of the data (Huber and Kobe, 2004). As a form of data normalization, there will always be a link 15 between pI and pH–pI, but it was also highlighted that no correl-ation between pI and pH had been found previously (Pageet al.,
2003;Woohet al., 2003). In defence of their work, the authors of
the original study showed a correlation between the pI of acidic pro-teins and the pH of successful crystallization and that a linear model 20 could be used to predict the optimal pH for such proteins. However, they concluded that a similar model could not be created for basic proteins because no significant correlation was found (Kantardjieff
et al., 2004). Since the original study, similar relationships between
the pI of proteins and the buffer pH of successful crystallization ex-25 periments have been noted for both acidic and basic proteins
(Charleset al., 2006).
The isoelectric point determines a protein’s minimum solubility level due to protein–protein interactions being favoured over pro-tein–water interactions (Gilliland, 1988;Luftet al., 2011). It should
30 therefore follow that a solution with a pH matching the isoelectric point would be ideal for crystallization although this has never been confirmed. One possible reason for this is that the recorded pH is that of the buffer in the crystallization solution rather than the final pH of the crystallization cocktail (Zhanget al.2013). It is known
35 that the reported buffer pH can differ from the true pH of the ex-periment by more than three pH units (Bukrinsky and Poulsen, 2001;Newmanet al., 2012).
Measurement of pH using a pH meter is time consuming and can be impractical if it requires reformatting of the crystallization screen 40 to accommodate the probe. We have shown previously that accurate measurements of pH can be obtained for crystallization solutions using spectrophotometry (Kirkwoodet al., 2014). The values deter-mined by our spectrophotometric method are typically within 0.2 pH units of those measured using a pH meter. Here,we use the spectro-45 photometric pH values obtained from numerous experiments to train a neural network to assign pH values to crystallization conditions. These values are shown to provide accurate estimates of the pH that can be used, for example, when mining databases such as the PDB. Using data obtained from AstraZeneca and from the Structural 50 Genomics Consortium (SGC), Oxford, we show that most proteins, both acidic and basic, do crystallize within one unit of their isoelectric point. This in turn allows for custom crystallization screens to be de-veloped in instances where protein availability is scarce and allows deeper exploration of chemical parameter space as the pH is fixed.
55
2 Materials and methods
[image:3.612.314.550.71.364.2] [image:3.612.315.548.73.367.2]2.1 The AZ dataset
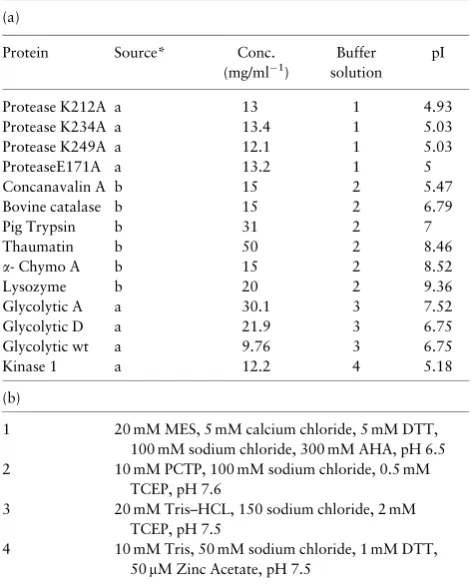
Table 1gives details of the 14proteins, some commercially available and some in-house targets from AstraZeneca, which were screened over a range of pH values. Commercial proteins were obtained from 60 Sigma-Aldrich and were buffered at pH 7.6. In-house proteins were
also buffered at near neutral pH (either pH 6.5 or pH 7.5). In order to determine the conditions for crystallization, each protein was ini-tially screened using sitting-drop vapour diffusion with a bespoke 96 condition sparse matrix screen buffered at 6 different pHs using the
65 multi-component buffer PCTP (Newman, 2004; Zhang et al., 2013). This gave a total of 576 conditions with the buffer pH fixed between pH 4.5 and pH 9.5. For each well, 80llof crystallization solution was dispensed using a Thermo Scientific Matrix Hydra II robot. Frozen protein samples were defrosted to room temperature
70 before using a Mosquito pipetting robot (TTP Labtech) to dispense 1ll protein with 1ll of the mother liquor in MRC Wilden crystalli-zation trays. Trays were sealed manually using transparent, pres-sure-sensitive adhesive tape (Hampton) and stored in a Formulatrix Rock Imager hotel at 20!C. All images were assessed for
crystalliza-75 tion after 21 days and the best crystallization conditions selected for a particular protein. A finer sampling of pH was performed in a 96-well plate with the chosen components buffered between pH 4.5 and pH 9.5 with PCTP.
2.2 The SGC dataset
80 The data obtained from the SGC in Oxford relate to 62 605 con-structs, from which 608 solved protein structures have been de-posited in the PDB. Descriptive metadata include protein sequence, family and purification methods as well as crystallization conditions and follow-up data with PDB codes where relevant. A subset of data
85 were extracted for experiments performed using the same SGC"
JCSGþ4 sparse matrix screen. The extracted data comprised the protein sequence and experimental conditions for 1057 different protein sequences. Experimental results were assessed using the
Table 1.AstraZeneca dataset details
(a)
Protein Source* Conc. (mg/ml"1)
Buffer solution
pI
Protease K212A a 13 1 4.93 Protease K234A a 13.4 1 5.03 Protease K249A a 12.1 1 5.03 ProteaseE171A a 13.2 1 5 Concanavalin A b 15 2 5.47 Bovine catalase b 15 2 6.79
Pig Trypsin b 31 2 7
Thaumatin b 50 2 8.46
a- Chymo A b 15 2 8.52
Lysozyme b 20 2 9.36
Glycolytic A a 30.1 3 7.52 Glycolytic D a 21.9 3 6.75 Glycolytic wt a 9.76 3 6.75
Kinase 1 a 12.2 4 5.18
(b)
1 20 mM MES, 5 mM calcium chloride, 5 mM DTT, 100 mM sodium chloride, 300 mM AHA, pH 6.5 2 10 mM PCTP, 100 mM sodium chloride, 0.5 mM
TCEP, pH 7.6
3 20 mM Tris–HCL, 150 sodium chloride, 2 mM TCEP, pH 7.5
4 10 mM Tris, 50 mM sodium chloride, 1 mM DTT, 50mM Zinc Acetate, pH 7.5
Note: pI values for the commercially available and in-house protein targets that were screened over a range of pH values are shown in (a) with buffer so-lution details in (b). Source: a, In-house; b, Sigma-Aldrich.
score given by a crystallographer, together with the resolution of the diffraction data and whether or not the structure was solved. For crystals that were not of diffraction-quality, no estimated resolution is given it was assumed that the structure was not determined. In in-5 stances where crystals were found to be salt, the associated data were removed. Data from unbuffered experiments were also removed as it is not possible to obtain an accurate pH value for such solutions. The remaining data were grouped based on the final stage reached in the structure determination pipeline as follows:
Group 1: 61 sequences that resulted in structure determination. Group 2: 50 sequences that resulted in a crystal that diffracted to at 10 least 3.6 A˚ .
Group 3: 211 sequences that resulted in at least one protein crystal. Group 4: 735 sequences that were annotated as ‘crystal—to be
fol-lowed up’.
It should be noted that sequences in the final group may not re-late to diffraction quality crystals or could be salt crystals that had not yet been identified as such. Conversely, it is possible that per-15 fectly good crystals may have been overlooked.
2.3 Calculation of isoelectric point
Proteins can become more positively or negatively charged by gain-ing or losgain-ing protons due to the pH of their environment. The iso-electric point (pI) is the pH at which a protein has a net charge of 20 zero and can be calculated using the charges for the specific amino acids in the protein sequence. Estimated values for the charges are called acid dissociation constants orpKa values. In the following
analysis, thepKa values used are those used in the EMBOSS
soft-ware suite (Riceet al., 2000) as shown in Table 2. For a protein
25 withn"negatively charged amino acids andnþpositively charged
amino acids, the pI can be determined as the pH for which the net charge given byEquation (1)is zero:
net charge¼X
n"
i¼1
"1 1þ10pKn"pHþ
Xnþ
i¼1
1
1þ10pH"pKp; (1)
wherepKnandpKpare thepKvalues for negatively charged and
positively charged amino acids, respectively. As an example, con-sider the small amino acid sequence, CRV, with one cysteine 30 (pKn¼8.5), one arginine (pKp¼12.5) and one valine (no charge).
Including the N-terminal amine group (pKp¼8.6) and C-terminal
carboxyl group (pKn¼3.6) the net charge for an initial pH of 0 is
given byEquation (2):
net charge¼ "1
1þ103:6"0
þ "1
1þ108:5"0
þ 1
1þ100"12:5
þ 1
1þ100"8:6 %0þ0þ1þ1%2:
(2)
35 Therefore, the charge for the sequence CRV is approximately 2 at pH 0. By gradually increasing the theoretical pH, to make the net charge inEquation (1)equal to zero, it is found that the isoelectric point of CRV is 8.555, as shown inFigure 1.
The isoelectric point for each sequence in the SGC dataset was 40 determined in the same manner using an Excel spreadsheet with vis-ual basic for applications (Microsoft VBA). For the AZ dataset, the pI was either obtained fromZhanget al.(2013) or calculated as above and was confirmed using isoelectric focusing.
2.4 Determination of pH by spectrophotometry
45 A method to accurately determine pH using spectrophotometry has been developed and is described in detail elsewhere (Kirkwood
et al., 2014). Briefly, the method uses spectrophotometry to measure
light absorbance when the indicator dye, bromothymol blue, is mixed with the crystallization solution. The absorbance is measured
50 between 400 and 700 nm in 5-nm increments and the curve obtained compared with a set of curves for conditions of known pH. The pH of the most similar curve, determined by the smallest mean absolute deviation, is assigned as the pH of the condition in question.
Spectrophotometry was used to determine pH values for buf-55 fered conditions in a variety of crystallization screens, including the JCSG-Plus, the Rigaku Wizard, the Hampton Index and the JCSGþ
6, an evolution of the JCSGþ4 screen—the one used in the analysis
of the SGC data. However, as the spectrophotometry method is lim-ited to values in the range from pH 4.5 to pH 9.5, all conditions that
60 were assigned a pH value of either 4.5 or 9.5 were removed from the dataset to avoid the possibility of under or overestimating the true pH at the extremes. For each of the remaining 5161 conditions, the chemicals and their concentrations together with the pH meas-ured by spectrophotometry are given inSupplementary Data S1.
65
2.5 Linear regression modelling of pH
In the absence of measurements obtained through a pH meter or spectrophotometry, pH becomes a problematic parameter in data mining as its inaccuracy could lead to misleading conclusions. However, it is possible that an accurate estimate of pH can be
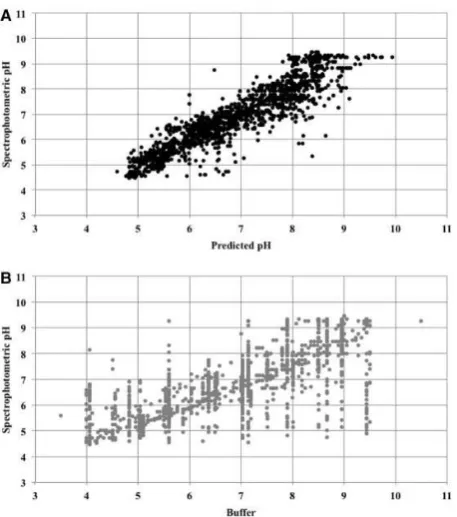
ob-70 tained without experimentation through the use of regression modelling. The dataset comprising 5161 spectrophotometric pH val-ues together with the buffer pH and the concentrations of the chem-ical species involved was divided into a training set, consisting of those conditions with only one chemical species in addition to the
75 buffer, and a test set of the conditions with multiple chemical species (Fig. 2). It was found that a linear regression model of the form:
d
pHS¼b0þb1Bþb2log10Cþb3B&log10C; (3)
wherepHdSis the predicted pH,Bis the buffer pH,Cis the
[image:4.612.320.539.64.314.2]concen-tration and thebterms are the regression coefficients, was suitable
Table 2.EMBOSS acid dissociation constants
Amino acid pKa Charge
[image:4.612.339.530.71.186.2]Amine group 8.6 Positive Carboxyl group 3.6 Negative Cysteine (C) 8.5 Negative Aspartic acid (D) 3.9 Negative Glutamic acid (E) 4.1 Negative Histidine (H) 6.5 Positive Lysine (K) 10.8 Positive Arginine (R) 12.5 Positive Tyrosine (Y) 10.1 Negative
for each chemical species. Inspection of the regression coefficients for individual chemical species revealed patterns in the models, with subsets of chemicals having similar regression coefficients and the same predictor variables shown to be insignificant.Supplementary 5 Table S1shows how groups with similar regression models also share similar chemistry. Final regression models were calculated for each group, after removing 10% of the data from each group for validation. This grouping of chemicals not only provides a more reli-able predictive model due to the increased sample size, but it also
10 allows new chemicals, whichare not present in the training set, to be assigned to a group and an estimate of pH obtained.
For solutions containing multiple chemical species, pH values were obtained by combining the predicted pH values for each indi-vidual chemical at the appropriate concentration using the formula:
d
pHA¼ "log10
Pn
i¼110 "pHbsi
n
0 @
1
A; (4)
wherepHdAis the predicted pH for the solution containing all
elem-15 ents,nis the number of chemical species in the solution andpHSi is
the predicted pH the individual species,Si. The formula effectively
determines the pH value by averaging the number of hydrogen atoms for each chemical in the solution. The 10-fold increase in hydrogen ions per pH unit decrease shows that the pH of the solu-20 tion is dominated by the most acidic species, which is modified slightly by more basic species. The model requires no weighting of the parameters as the concentration of individual chemicals has al-ready been accounted for.
2.6 Modelling pH using machine learning
25 An artificial neural network (ANN), implemented in Matlab (MathWorks, 2011) was trained to assign a pH value to crystalliz a-tion solua-tions. An ANN was employed as they are able quickly to create a richer, non-linear model than that of regression. ANNs are machine learning algorithms designed to mimic the processes in the 30 brain and can be trained to associate a particular output, in this case a pH value, with particular input features. The neural network was implemented in Matlab using the fitnet function with the Levenberg–Marquardt back-propagation method and the hyperbolic tangent sigmoid transfer function (Beale and Jackson, 1990;
35 MathWorks, 2013). A single hidden layer network was chosen to re-duce the risk of overfittingas regression modelling had shown that a linear model was sufficient. Approximately two-thirds of the data for the 5161 conditions for which pH values could be determined by spectrophotometry were used to train the network and the other 40 third was reserved as an independent test set. The chemical species included salts, salts of weak acids, organics, polyethylene glycols (PEGs) of different molecular weights and different functional groups, compounds containing ammonia, hydroxide and di-hydro-gen salts. Chemicals were broadly grouped as suggested by the linear 45 regression analysis (Supplementary Table S1) and stratified sampling used to divide the chemical groups evenly between the training and test sets (3524:1637). The concentration of chemicals in each group
was calculated for each condition and these values, together with the buffer pH, used as inputs to the neural network. We chose a
net-50
work with a single hidden layer of fivenodes as this was the simplest network that gave a low mean squared error (MSE) between the output pH and the spectrophotometric pH during training without overfitting (as assessed by the independent test set).
3 Results
55
3.1 Assignment of pH
Linear regression showed that four chemical groups—ammonia, acids, basics and salts of acids—require the full model including the interaction term relating both the buffer pH and the additional chemical concentration to the pH of the experiment. The model for
60 PEGs does not include the chemical concentration as a separate term, but does include the interaction between chemical concentra-tion and buffer pH. Organics and salts have the simplest models, only involving the buffer pH as a variable. The simplified models were obtained by stepwise variable selection using Bayesian
65 Information Criterion. More details are given in theSupplementary Material.The MSE between the spectrophotometric and predicted pH values is 0.28 in comparison to 0.8 between the values measured by spectrophotometry and the buffer pH values. The (Pearson’s product moment) correlation with the measured values is 0.89 for
70 the predicted pH in comparison to 0.77 for the buffer pH.
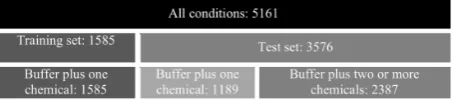
Figure 3ashows the pH values measured by spectrophotometry plotted against those predicted by the neural network for the inde-pendent test set. The linear relationship between measured and pre-dicted pH can be shown to have an intercept close to 0 and a
75 gradient close to 1 suggesting a strong relationship between the two methods of obtaining pH. For the same test data, the spread of val-ues obtained by spectrophotometry for any particular buffer pH is much greater than for the corresponding predicted pH, as can be seen in Figure 3b. The correlation of the spectrophotometric pH
80 with the predicted pH is 0.92 (MSE 0.25) in comparison to 0.75 with the buffer pH (MSE 0.97).
The distribution of differences from the spectrophotometry pH values is shown inFigure 4for the values assigned by the neural net-work and for those provided by the buffer pH. The histograms show
85
the absolute deviations in 0.1 pH unit bins. Although75% of pre-dicted pH values are within 0.5 units of the measured pH (i.e.60.5 pH units) and 95% are within one unit, only 53% of the buffer pH values are within 0.5 units and just 80% are within one unit.
Closer inspection of the predicted values reveals that 6 of the 66 90 individual chemicals were involved in the conditions where the devi-ation from the spectrophotometric pH values was unusually high. One of these chemicals, PEG 2000 DME, should be neutral, but spectrophotometry suggested a pH of just over 4.5, at the limit of the method’s reliability. However, it is known that PEGs degrade,
95 becoming more acidic over time (Ray and Puvathingal, 1985; Jurnak, 1986; Hampton, 2012). Indeed, when checked with a Jenway 4330 pH meter, the solution was found to have a pH of just 2.6. The other five chemicals that were associated with large errors (jeffamine ed-2003, ammonium phosphate dibasic, dl-malic acid,
so-100
dium malonate, magnesium chloride) were not well-represented in the training data. Retrainingthe network with a larger dataset could therefore improve the results further.
Throughout we have used models to predict the pH of the crys-tallization solution, however, only a proportion of this is contained
[image:5.612.68.295.61.111.2]105 within the drop containing the protein. Using a lysozyme solution at 40 mg/ml with 100 mM sodium chloride and the buffer PCTP at
Fig. 2.Organization of data used for linear regression modelling
50 mM, we have shown that, when mixed with 50 mM PCTP at pH 5, 7 and 9, the final pH could be predicted from the two buffering components with neither the salt or the lysozyme having a noticeable effect. For example, protein solution at pH 5 to mother li-5 quor pH 7 in the ratio 2:1 gives a predicted pH of 5.66 which com-pares with an average measured pH of 5.46 (as shown in
Supplementary Table S3). Only when the ratio of protein solu-tion:mother liquor was increased to 3:1 did we find that the lyso-zyme affected the pH.
10
3.2 Relationship between pI and pH
In order to investigate the claims regarding a relationship between the pI of a protein and the pH at which it can be crystallized, we cal-culated the pI from each protein sequence in the SGC dataset. These data, all screened using the SGC"JCSGþ4 sparse matrix screen, 15 were selected from the full SGC database and assigned to chemical groups in order to predict pH as shown inSupplementary Table S2. Although a spectrophotometric pH value was available for some of the conditions in the SGC"JCSGþ4 screen (used either for
training the neural network or reserved to test the accuracy of the 20 assignments), the pH used here for all conditions was that assigned using the trained neural network. In addition to the chemical con-centrations, the pH of the crystallization buffer is used as input to the network. For those wells without a buffer solution (21/96), the pH of the purification buffer was used instead. Data for any wells
25 where neither buffer pH nor purification pH was available were removed. It has been shown that the buffering capacity of the pro-tein itself is negligible both in vitro (Kirkwoodet al., 2014) and in vivo (Poznanskiet al., 2013).
For each well in which a crystal was observed, the calculated pI 30 was compared with the assigned pH. The protein sequences were considered in groups, as defined in Section 2.2, reflecting the max-imum stage in the structure determination pipeline that was at-tained. The protein structure was determined and deposited in the PDB for the 61 protein sequences in group 1. However, in addition
35 to the conditions that led to the final structure, we also have infor-mation about other conditions that produced crystals. Analysis shows that crystals are only obtained in conditions with a pH within one unit of the pI for 9 of the 61 sequences. A total of 28 sequences only result in crystals within two pH units of the pI, 45 sequences
40 only result in crystals within three pH units, 57 sequences only result in crystals within four pH units and the final four proteins crystallize up to five pH units away from the pI. Thus, for over 70% of these protein sequences, crystals are only obtained in experiments buf-fered within three pH units of the pI.
45 Particularly in cases when available protein is limited, it is im-portant to identify suitable conditions in as few trials as possible and restricting screening to a particular pH range would reduce the num-ber required. Promising initial conditions (including the pH) could then be optimized to obtain crystals suitable for crystallographic
50 studies (Jancarik and Kim, 1991).For the 61 proteins in the SGC dataset that resulted in a structure deposited in the PDB, we found a correlation of 0.8 between the pH of any crystalline result and the pH at which the final structure was obtained. We therefore investi-gated the differences between a protein’s isoelectric point and the
55 closest pH value for any conditions producing crystals. Again the proteins were considered in the four groups according to the stage reached in the crystallization pipeline. For those proteins in group 1, 84% crystallized within one pH unit of their pI and 95% crystallized within two pH units of their pI. Crystals were found
60 within one pH unit of their pI for 78% of proteins in group 2 and within two pH units for 88%. In group 3, 74% of proteins crystallized within one pH unit of their pI and 90% within two pH units and for group 4 proteins, 55% produced crystals within one pH unit of their pI and 82% within two pH units. Overall, 85% of
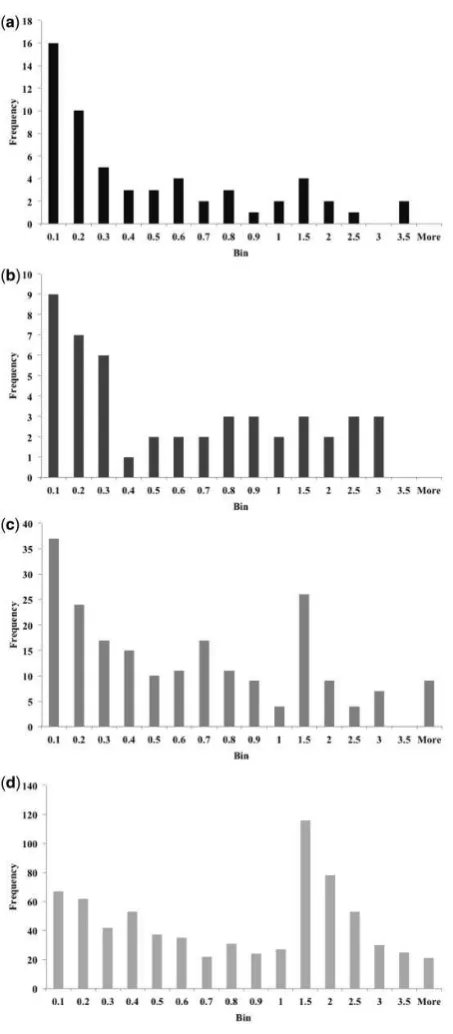
65 proteins did produce crystals within two pH units of their pI. Histograms showing the distribution of shortest distances for each group are given inFigure 5. It is worth noting that those proteins for which no crystals were found within three pH units of their pI (6% of all protein sequences here) tended to have more extreme
isoelec-70
tric points. Of the 64 such proteins, 46 had a pI outside the range 5–9 and of the 18 protein sequences with a pI in this range, only one with a pI of 7.9 is within the range 6–8.
The 14 proteins in the AZ dataset (Table 1) were used to further test the relationship between pI and the pH of successful crystalliz
a-75 tion. Once the best crystallization components had been determined for a particular protein, a fine sampling of pH was performed in a 96-well plate with the chosen components buffered between pH 4.5 and pH 9.5.Supplementary Figure S1shows thatcrystals were ob-tained within one pH unit towards neutral from their pI for 11 of
[image:6.612.67.296.56.315.2]80 the 14 proteins and 13 of 14 crystallize within one pH unit either
Fig. 3.Accuracy of pH values. The pH obtained by spectrophotometry is shown plotted against the pH predicted by an artificial neural network in (A) and the pH of the buffer in (B)
[image:6.612.72.285.376.496.2]side of their pI. Only one protein, with a pI of 5.18, did not crystalli-ze within two pH units of its pI.
The stochastic nature of protein crystallization compounds the difficulties of pattern recognition.Supplementary Figure S1shows
5 that, althoughseveral proteins crystallize across a wide range of pH values, crystals are not seen in every 0.25 bin within that range. Reproducibility in screening has been investigated and the results suggest that replication could improve success rates in crystallization experiments (Newmanet al., 2007).
10
4 Discussion and conclusion
Linear regression modelling revealed groups of chemicals with similar effects on the pH of a crystallization experiments. The simplest mod-els were obtained for salts with no hydrogen ions and neutral organic compounds. Although a simple linear regression model can be used to
15 relate the pH of the experiment to the buffer pH for both of these chemical groups, the model is different for each group, with the con-stant offset larger for organics than that for salts. For other groups, the effect of the additional chemical on the buffer pH depends on the concentration of that chemical. In the case of PEGs, the chemical
con-20 centration does not appear as a separate variable, but the interaction term between buffer pH and the chemical concentration is significant. It known that PEGs degrade over time (Hampton, 2012;Ray and Puvathingal, 1985;Jurnak, 1986), increasing the acidity of the solu-tion. Similarly, ammonia-containing compounds slowly release the
25
ammonia and affect the pH of a condition (Mikol et al., 1989; Newmanet al., 2012). Thus ammonia-containing compounds can become more acidic than PEGs, which when fresh and correctly stored are close to neutral pH, and like the final two groups (acids and basic) require the full linear regression model including the
inter-30 action term to represent the pH of the experiment. The last two groups either contain hydrogen ions that have a large impact on pH or contain a hydroxide group, with a large but opposite effect on pH. The largest errors in prediction are due to chemicals that undergo deg-radation. The deterioration of chemicals, such as PEGs, cannot be
pre-35 dicted but should be considered and storage conditions such as light exposure and temperature could perhaps be controlled.
The grouping of chemicals according to their effect on the pH of a solution means that individual models are not required for each chemical and the effect of chemicals for which there are no examples
40 in the training set can be predicted from the model for the appropri-ate group. Moreover, the increase in the number of examples avail-able for each model reduces overfitting of the training data and provides more robust models for prediction. Using the chemical grouping suggested by linear regression modelling, the most
accur-45 ate results were obtained using a single-layer neural network with five nodes. However, the method is less intuitive, and similar results were obtained using the regression equations.
Although we have used our modelling to predict a more accurate pH for the mother liquor, the same method can also be used to
pre-50 dict the pH within the crystallization drop by combing the buffering components. Our results with lysozyme show that the protein itself does not affect the pH unless used in higher concentrations than would typically be used (as shown inSupplementary Table S4).
The ability to predict the effect of different combinations of chem-55 icals on the pH of an experiment allows information in databases such as the PDB to be used in data-mining studies that aim to reduce the number of crystallization trials required. Over the last decade, a number of investigations have considered a possible link between the pI of a protein and the pH at which it will crystallize (Charleset al.,
60 2006). However, such a link has also been disputed (Huber and Kobe, 2004) and it has also been suggested that ‘the pI value of a pro-tein should be avoided when choosing the pH for a propro-tein solution’ (Zhanget al., 2013).Zhanget al.(2013)also discuss the issue of the recorded pH not necessarily being the pH of the experimental
condi-65
tions. Previous findings have been based on the pH of the buffer solu-tion, which can differ from the actual pH by more than threepH units (Bukrinsky and Poulsen, 2001;Newmanet al., 2012). Using more accurate pH values that take into account how the concentra-tions of the various chemicals in the crystallization cocktail affect the
[image:7.612.69.296.53.571.2]70 pH of the buffer solution, we have shown that there is a relationship
Fig. 5.Histograms showing the absolute difference between the pI and the closest pH at which crystals were obtained for proteins in the SGC dataset. (a) shows group 1 (structure determined), (b) shows group 2 (diffraction to at least 3.6 A˚ ), (c) shows group 3 (at least one protein crystal) and (d) shows group 4 (crystal to be followed up)
between a protein’s pI and the pH under which it will crystallize. In addition to data for the conditions leading to protein structure solu-tion, we have considered the pH of experiments producing crystals that may not have been confirmed as diffraction quality. We found 5 that proteins frequently crystallize within one pH unit of their pI and that 85% of the proteins produced crystals within two pH units of their pI. In most cases, proteins tended to crystallize at a more neutral pH with acidic proteins crystallizing above their pI and basic proteins below their pI, confirming those results found previously 10 (Kantardjieffet al., 2004;Charleset al., 2006).As the majority of proteins are of an acidic pI (Bermanet al., 2000), we therefore suggest that a useful initial pH for crystallization trials can be obtained from the pI of the protein in question, but this pH should not simply be taken as that of the buffer solution but, if not measured, should be ad-15 justed to take into account the effect of any additional chemicals. As some proteins do not crystallize close to their pI, we investigated pro-tein properties to determine whether or not such propro-teins could be predicted. In addition to pI, the GRAVY and the number of D, C, G, H, M, F, P, S, T, W, Y residues (Overtonet al., 2008) were calculated
20 for each sequence in the SGC dataset.These properties were used in unsupervised analyses, including k-means clustering and multidimen-sional scaling, but we were unable to determine any association be-tween the sequence properties and the proteins propensity to crystallize at a pH close to its pI. Differences in physical crystalliza-25 tion conditions such as temperature and whether the protein sample was frozen were not taken into account, although analysis showed there were sequences that resulted in protein structures at 4 and room temperature, for both fresh and frozen protein samples with and with-out ligands.
30 It is interesting to note that two proteins in the AZ dataset, Glycolytic enzyme A and Glycolytic enzyme D, have only the single surface amino acid change E193A and E193D, respectively, but have very different crystallization patterns. Although Glycolytic enzyme D crystallizes within a limited pH range, Glycolytic enzyme A crystalli-35 zes across a wide range of pH values. This supports the view ofDale
et al.(2003)that the protein itself is an important variable in
crystalli-zation and rational mutagenesis may aid the screening process.
Acknowledgements
We thank Tina Howard at AstraZeneca for performing experiments with re-40 gard to the effect of protein on the pH of the crystallization drop. We also thank Lauren Crawley, Jia Tsing Ng and Frank von Delft at the SGC, Oxford for the provision of data and to the protein and crystallography teams at AstraZeneca for help and advice.
Funding
45 This work was supported by UK Biotechnology and Biological Sciences Research Council[(BBSRC BB/I015868/1] andAstraZeneca plc.
Conflict of Interest: none declared.
References
Beale,R. and Jackson,T. (1990)Neural Computing: An Introduction. IOP 50 Publishing Ltd, Bristol, UK.
Berman,H.M.et al.(2000) The Protein Data Bank.Nucleic Acids Res.,28, 235–242.
Bukrinsky,J.T. and Poulsen,J.C.N. (2001) pH, conductivity and long-term sta-bility in the Crystal Screen solutions.J. Appl. Crystallogr.,34, 533–534. 55 Caffrey,M. (2003) Membrane protein crystallization.J. Struct. Biol.,142,
108–132.
Charles,M.et al.(2006) MPCD: a new interactive on-line crystallization data bank for screening strategies.Acta Crystallogr. D Biol. Crystallogr.,62, 1311–1318.
60 Chen,K.et al.(2007) Prediction of protein crystallization using collocation of
amino acid pairs.Biochem. Biophys. Res. Commun.,355, 764–769. Dale,G.E.et al.(2003) The protein as a variable in protein crystallization.
J. Struct. Biol.,142, 88–97.
Doerr,A. (2008) Membrane protein structures.Nat. Methods.,6, 35–35. 65 Gilliland,G.L. (1988) A biological macromolecule crystallization database: a
basis for a crystallization strategy.J. Cryst. Growth,90, 51–59.
Gilliland,G.L. et al. (1994) Biological Macromolecule Crystallization Database, Version 3.0: new features, data and the NASA archive for protein crystal growth data.Acta Crystallogr. D Biol. Crystallogr.,50, 408–413.
70 Hampton (2012)PEG Stability: A Look at pH and Conductivity Changes
over Time in Polyethylene Glycols. Hampton Research Corporation. http:// hamptonresearch.com/documents/growth_101/27.pdf(29 April 2014, date last accessed)
Hennessy,D.et al.(2000) Statistical methods for the objective design of screen-75 ing procedures for macromolecular crystallization.Acta Crystallogr. D Biol. Crystallogr.,56, 817–827.
Huber,T. and Kobe,B. (2004) Comment on ‘Protein isoelectric point as a pre-dictor for increased crystallization screening efficiency’. Bioinformatics,20, 2169–2170.
80 Jancarik,J. and Kim,S.H. (1991) Sparse matrix sampling: a screening method
for crystallization.J. Appl. Crystallogr.,24, 409–411.
Jurnak,F. (1986) Effect of chemical impurities in polyethylene glycol on macromolecular crystallization.J. Cryst. Growth,76, 577–582.
Kantardjieff,K.et al.(2004) Distributions of pI vs pH provide prior informa-85 tion for the design of crystallization screening experiments.Bioinformatics,
20, 2172–2174.
Kantardjieff,K.A. and Rupp,B. (2004) Protein isoelectric point as a predictor for increased crystallization screening efficiency. Bioinformatics, 20, 2162–2168.
90 Kirkwood,J.et al.(2014) A high-throughput colourimetric method for the
de-termination of pH in crystallization screens. Acta Crystallogr. D Biol. Crystallogr.,70, 2367–2375.
Kozlowski,L. (2012) Calculation of protein isoelectric point. http://isoelectri-c.ovh.org/(17 October 2012, date last accessed)
95 Kyte,J. and Doolittle,R.F. (1982) A simple method for displaying the
hydro-pathic character of a protein.J. Mol. Biol.,157, 105–132.
Luft,J.R.et al.(2003) A deliberate approach to screening for initial crystalliza-tion condicrystalliza-tions of biological macromolecules. J. Struct. Biol., 142, 170–179.
100 Luft,J.R.et al.(2011) What’s in a drop? Correlating observations and
out-comes to guide macromolecular crystallization experiments.Cryst. Growth Des.,11, 651–663.
MathWorks (2011)MATLAB R2011a. The MathWorks Inc., Natick, MA. MathWorks (2013)trainlm. Documentation Center. The MathWorks Inc.,
105 Natick, MA.
McPherson,A. (2004) Introduction to protein crystallization.Methods,34, 254–265.
Mikol,V.et al.(1989) Changes of pH during biomacromolecule crystallization by vapor diffusion using ammonium sulfate as the precipitant. J. Appl.
110 Crystallogr.,22, 155–161.
Newman,J. (2004) Novel buffer systems for macromolecular crystallization.
Acta Crystallogr. D Biol. Crystallogr.,60, 610–612.
Newman,J.et al.(2007) Initial evaluations of the reproducibility of vapor-dif-fusion crystallization.Acta Crystallogr. D Biol. Crystallogr.,63, 826–832.
115 Newman,J.et al.(2012) A universal indicator dye pH assay for crystallization
solutions and other high-throughput applications.Acta Crystallogr. D Biol. Crystallogr.,68, 1003–1009.
Overton,I.M.et al.(2008) ParCrys: a Parzen window density estimation ap-proach to protein crystallization propensity prediction.Bioinformatics,24,
120 901–907.
Page,R. et al. (2003) Shotgun crystallization strategy for structural gen-omics: an optimized two-tiered crystallization screen against the
Poznanski,J.et al.(2013) Proteins contribute insignificantly to the intrinsic buffering capacity of yeast cytoplasm.Biochem. Biophys. Res. Commun.,
430, 741–744.
Ray,W.J. Jr and Puvathingal,J.M. (1985) A simple procedure for removing 5 contaminating aldehydes and peroxides from aqueous solutions of poly-ethylene glycols and of nonionic detergents that are based on the polyoxy-ethylene linkage.Anal. Biochem.,146, 307–312.
Rice,P.et al.(2000) EMBOSS: the European molecular biology open software suite.Trends Genet.,16, 276–277.
10 Sillero,A. and Maldonado,A. (2006) Isoelectric point determination of pro-teins and other macromolecules: oscillating method.Comput. Biol. Med.,
36, 157–166.
Smialowski,P.et al.(2006) Will my protein crystallize? A sequence-based pre-dictor.Proteins,62, 343–355.
15 Target,DB (2010)TargetDB Statistics Summary Report.
Tung,M. and Gallagher,D. (2008) The Biomolecular Crystallization Database Version 4: expanded content and new features.Acta Crystallogr. D Biol. Crystallogr.,65, 18–23.
Wooh,J.W. et al. (2003) Comparison of three commercial sparse-ma-20 trix crystallization screens. Acta Crystallogr. D Biol. Crystallogr.,59, 769–772.
Zhang,C.-Y.et al.(2013) A strategy for selecting the pH of protein solutions to enhance crystallization.Acta Crystallogr. F Struct. Biol. Cryst. Commun.,
69, 821–826.