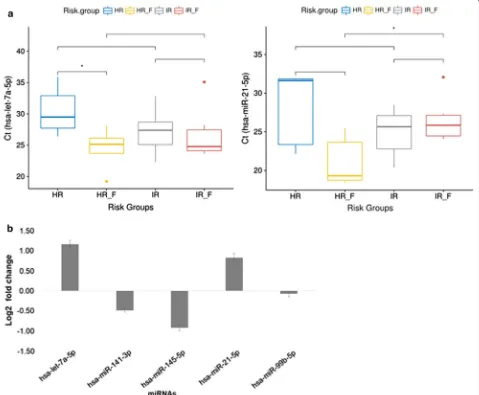
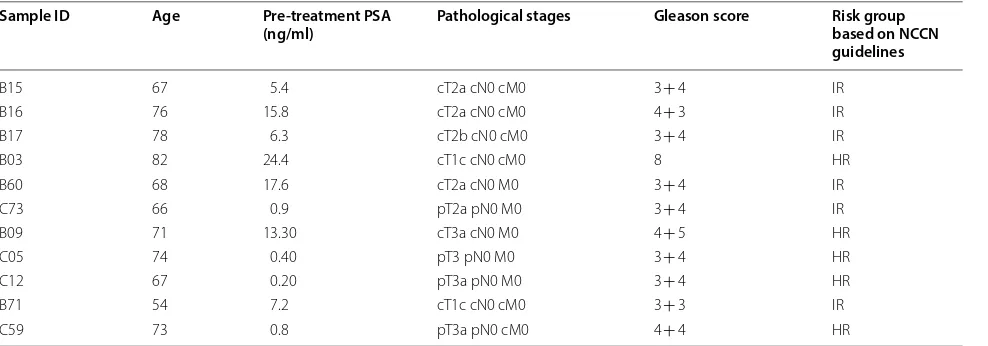
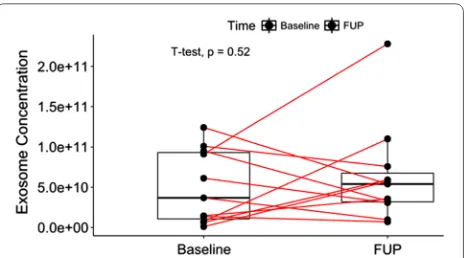
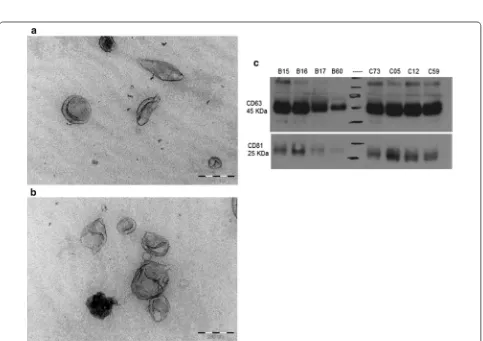
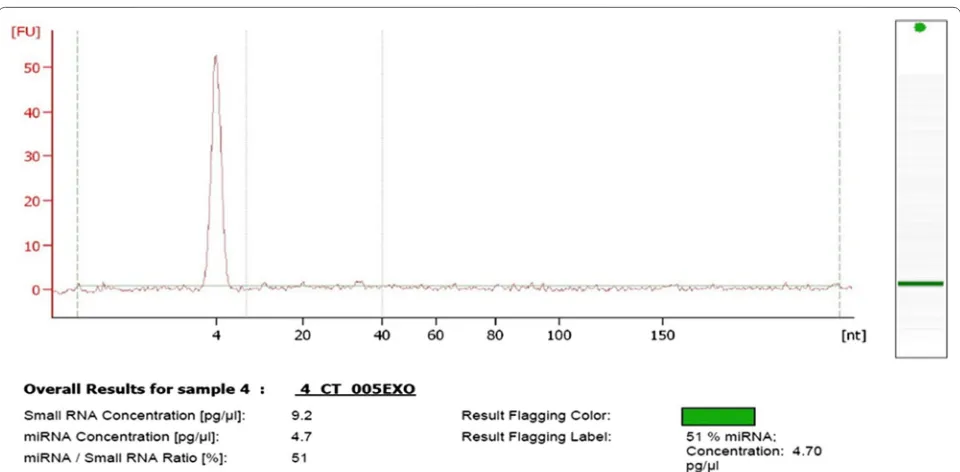
Protocol for serum exosomal miRNAs analysis in prostate cancer patients treated with radiotherapy
Full text
Figure
Related documents
After being treated with free FTY720 solution, solution containing both free FTY720 and lipo2000-siBeclin 1, or LCP-II-siRNA, LCP-II-siBeclin 1, LCP-II-siRNA-FTY720,
Poor dietary practices or poor feeding practices were targeted by seven of the 11 programmes, including the IYCF programme, Camp 4 and Social Services/Home Economics Programme
Various kinds of extract like aqueous extract, methanolic extract, petroleum extract, chloroform extract has been prepared from different parts of the plant has been
The main goal of this article was to evaluate the absolute model fit of the GRM when varying the number of categories of a scale and to analyze the precision of the estimates of
In conclusion, this study will contribute to the estimation of discard species and rates of gillnets used in whiting fishery, understanding of the effects of gillnet
According to the analysis result RS Kalooran Amurang, RS Siloam Sonder and RS Tonsea Aermadidi, if there is no management control system or the value of this variable is 0,
York, but not proceeding onward to Michigan, across the southern mid-west (Ohio, Indian, and Illinois). This means that most of the variation in the instrument is coming from
Association of the Sst-I polymorphism at the APOC3 gene locus with variations in lipid levels, lipoprotein subclass profiles and coronary heart disease risk:
