Int. J. Electrochem. Sci., 5 (2010) 1810 - 1820
International Journal of
ELECTROCHEMICAL
SCIENCE
www.electrochemsci.orgThe Development of a Real-Time Image Guided Micro
Electroplating System
Ting-Chao Chen, Yean-Ren Hwang*, Jing-Chie Lin, Yong-Jie Ciou
Department of Mechanical Engineering, National Central University,
No 300, Jhongda Rd, Jhongli City, Taoyuan County 320, Taiwan, Republic of China *
E-mail: [email protected]
Received: 25 September 2010 / Accepted: 15 October 2010 / Published: 1 December 2010
A real-time image guided continuous micro-electroplating system equipped with four elements, such as a Charge-coupled Device camera (CCD camera), a magnifier lens, a micro-stepper motor controller, and micro-electroplating device, is proposed in this paper. To maintain the electroplating quality, the system continuously controls the micro-stepper motor and keeps constant gap distance between the micro-anode and copper specimen. In the process of electroplating, chemical reactions would generate oxygen bubbles automatically thus to deteriorate captured images. To solve the bubble issue, a real-time image of the distance between the copper column tip and the anode captured by a CCD camera is used to determine and adjust the cathode position. Besides, four statistic judging criterions are used and compared to determine the bubble-free images. Based on the processing time and accurate rate, the algorithm using entropy index is proposed in this paper for real-time control. From the experiment results, a real-time image guided micro electroplating system does produce better structure, better uniformity and better finishing surface of the specimens compared to those by previous intermittent electroplating setup.
Keywords:CCD camera, micro-electroplating, image processing, motion control
1. INTRODUCTION
maintain constant distance between the anode and cathode column. The whole process then becomes continuously and the quality of the specimen is also improved.
The micro-manufacturing techniques have been attracting more and more attentions in the past few decades, including the electroplating process. Madden, et. al. proposed the “localized micro-electroplating” that with electroplating to deposit the micrometer-scaled Ni-column and spring [3,4]. The localized micro-electroplating was considered as a workable process because of its quick process, low cost, various products fabrication and open-air process despite the rough surface, nodular contour and defective in structure of the micro-Ni-column. Later, the scanning electrochemical microscope method proposed by El-Giar, et. al. localized electrochemical deposition the leading wire inside the electric part, let copper microstructures be interconnects between the two parts in the chip for the microelectronics [5,6]. The MAGE process used a motion controller to adjust the anode position by monitoring the operation voltage [1,2]. The anodes moved intermittently when the voltage suddenly decreased to zero and the current rapidly increased. Often happened was the copper column touched and stuck to the anode. This phenomenon affected the quality of the copper column and sometimes broken columns were induced by separating the adherence.
It was found that the concentration of copper sulfate bath and the distance between the anode and cathode playing a critical role in local electrochemical plating [7,8,9,10]. In addition, the ratio of linear relationship of the diameters of the micro anode and the deposit micro column becomes one to one [11,12]. Using X-ray in the coherent micro-radiology to observe the anode-cathode distance and the influence of deposition surface was proposed by Seol et. al. [7,8]. Although better solution was obtained, two issues of the operation process relied on licensed specialists and expensive equipments were still not solved.
Machine vision techniques have been applied to measurement and automatic control systems for many years. The images captured by CCD cameras are processed and useful information such as positions and distances are used to qualify the parts or adjust the motors. In order to maintain the anode-cathode distance to assure the quality of the copper column and to avoid using radiological equipment, the mean of utilizing a CCD camera with a magnifier lens to capture the image of electroplating process is proposed in this work. Since the image was highly deteriorated due to the complicate chemical-electrical operation inside the electrolyte, we develop an image processing algorithm based on the four statistical methods, Binary, Energy, Eigen and Entropy values to determine the anode-column distance. Although theorems and techniques for image processing have been developed for many years, only few are applied to micro-electroplating systems [13,14].
The sections of this paper are organized as follows: the hardware setup is described in Section 2, the control algorithm is described in Section 3, the experiment results are discussed in Section 4 and the conclusion is stated in Section 5.
2. HARDWARE SETUP
control unit of this system is the computer which applies the proposed software to control all hardware system to achieve the continuous micro-electroplating function.
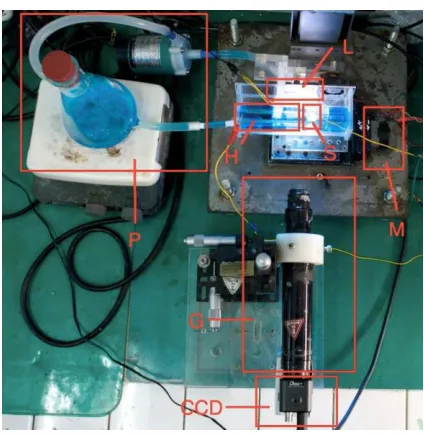
[image:3.596.192.404.212.429.2]The image hardware system includes a CCD camera, a video capture Matrox CronosPlus card and magnifier lens. The images are captured by a CCD camera with a magnifier lens and are transport to the computer by video capture Matrox CronosPlus card. The images are processed and recognized for taking anode-cathode distance to achieve the continuous micro-electroplating function and produce the copper column.
Figure 1. Equipment of real time image-guided electroplating system.
The micro-electroplating system, as shown in figure 1, contains the electrical power supplier, the micro-stepping motor (M), the micro-anode (H), the cathode (S), the cycle electrolytic cell (P), the high-power LED module (L), the magnifier lens (G) and the CCD camera (CCD). The anode of the electroplating system is made of platinum wire with the diameter of 125 um and put it to a bakelite tube with cold-mounted resin which the diameter is 0.5 mm and the length is 60 mm. One end of platinum wire is welded with a copper conducting wire connecting to a DC-power supply. The cathode is made of a piece of square (10 mm×10 mm× 1mm) pure copper. Its one side is adhered to a copper wire with conducting glue to the connection of a DC-power supply, and the copper was mounted with resin to expose the other side. The depositing cell is set up on the stepping motor and constructed with PolyMethyl MethAcrylate (PMMA) of the dimension of 50 mm × 50 mm × 60 mm. Also, the depositing cell uses a typical sulfate bath with the 0.8M CuSO4‧5H2O and 0.65M H2SO4.
the anode is remained at the same position. Hence the field of view always covers the region around the gap.
Besides, install a high-power blue light LED and a diffuse plane behind the cell to increase illumination, and use a pump to made the electrolyte convection and carry off the bubble made from electroplating. However, the mentioned hardware above is critically controlled by the software, and the software is further discussed in the following section.
3. CONTROL ALGORITHM OF THE SYSTEM
The proposed software is mainly divided into two parts: the user interface and the image processing approach. The user interface is the human-machine interface. The statistical image processing methods are proposed to identify the bubbles made from electroplating process. The user interface is introduced first in this section and the statistical methods and the operation flowchart will be emphasized respectively.
3.1. User interface
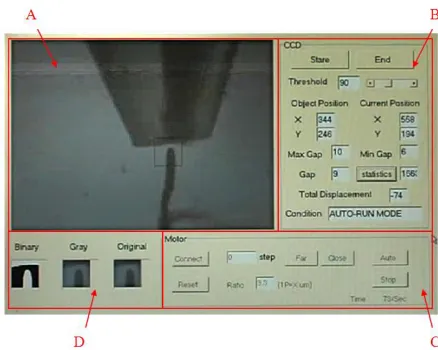
[image:4.596.187.406.542.717.2]As shown in figure 2, the user interface includes four major functions. First, the upper left block A is for the image display from CCD camera. Second, the parameters of the binary threshold, anode-cathode distance and the relative intermediate status for the CCD camera are listed in the upper right B block. Third, the lower right C block appears that the motor can be controlled manually or automatically with the image processing. Besides, the ratio between the motor and the present magnification of the lens can be adjusted manually in this area. Last, the lower left D block contains intermediate images. Via the user interface, the system controls the anode-cathode distance by different parameters to experiment a successful electroplating process.
3.2. Statistical judging method
The issue of misjudgment of image recognition due to the bubbles from the chemical reaction of the electrolyte is carefully testified in this paragraph. Besides traditional binary image processing method, this paper also proposes statistics methods such as Energy, Eigenvalue and Entropy respectively to experiment the numbers of bubbles to make better image judgment. However, the image process portion includes the operations of the noise filtering, region segmenting, and anode-cathode distance determination. During the electroplating process, bubbles frequently appear due to the chemical reaction of the electrolyte. The anode and copper column are not distinguishable because of bubbles since the image becomes too chaotic. To evaluate the clearance of the image, the Binary, Energy values, Eigenvalue and Entropy are calculated and compared in the following equations and the definitions are given in detail.
(1)
(2)
(3)
(4)
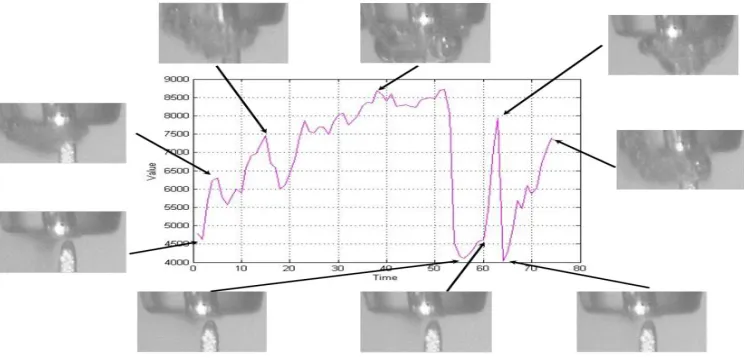
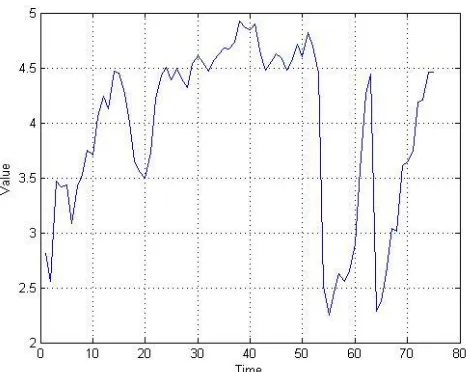
[image:5.596.109.481.559.739.2]where p[i,j] represents the grayness value of the i-th row and j-th column pixel of the image. Figure 3 to Figure 6 show the results of the above mentioned methods (the Binary, Energy values, Eigenvalue and Entropy) for the same images, respectively. It is found that the more bubbles exist, the values of the four means become higher. Once the image is clear enough, the anode and column tip will be found, and the distance of the gap will be fed into the motion controller to adjust the cathode holder position. As discussed clearly, the four statistical methods are all able to be utilized to judge the bubble numbers. In the following section, the detailed experimental results will be further compared.
[image:6.596.182.409.80.263.2]
Figure 4. Energy values
Figure 5. Eigenvalue values
[image:6.596.178.411.555.741.2]
3.3. Flowchart of the electroplating operation
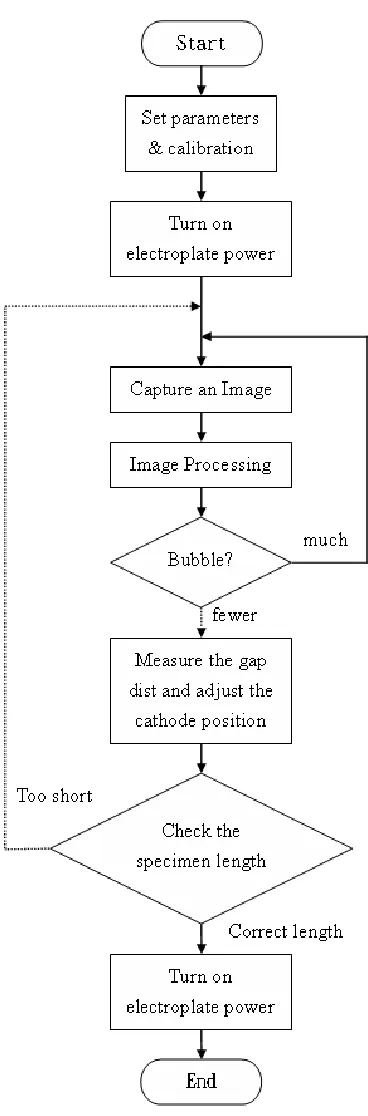
[image:7.596.204.388.184.742.2]As shown in Figure 7, the flowchart of the electroplating operation requires users to assign the parameters of the operation, such as the maximum and minimum range of the gap and the enlargement ratio of the magnifier lens. The electroplate power supplier will then be turned on through the following procedures.
The gray images are consistently captured from the CCD camera during the electroplating process and processed to determine the existence of bubbles. If the image is clear enough, then the distance of the gap will be determined by measuring the pixels between the anode and the specimen. Otherwise, the system will discharge the current image and process the next one.
Once the distance is different from the setup value, the movement commands will be sent to the motion controller to adjust the cathode holder position. Before the copper specimen length reaches the required value, the above procedures will be repeated.
4. EXPERIMENTAL RESULTS
4.1. Bubble identification
To identify bubble numbers, this paper applies four image processing methods, Binary, Energy, Eigenvalue and Entropy mentioned in the previous sections, to continuous micro-electroplanting system. Followings are listed image processing procedures. Firstly, capture and then calculate the seventy-five continuous images. Secondly, sum up the foreground pixels of each picture to bring out a diagram of curves as shown in Figure 3 to Figure 6. Finally, compare the four diagrams of curves. The results show that when the value of the foreground pixels becomes higher, the more bubbles are produced. On the contrary, the lower the value is, the less bubbles are. According to the experimental outcomes, it permits that the mentioned statistical methods are all appropriate for bubble identification of continuous micro-electroplanting system.
However, computation time plays an important role of narrower the anode-cathode distance. Since above methods can apply to judge bubble numbers; this article then further compares the operation time of each method. The following Table 1 is the comparison of computation time of each image processing method mentioned above. As can be seen in Table 1, run through the same procedures and calculate the operation time of the same continuous seventy-five pictures, the method of Entropy costs 1.362740 seconds is faster than the methods of Eigenvalue 2.33483 seconds, Energy 2.134708 seconds and Binary 2.157418 seconds. Thus, Entropy seems to be the best statistical method to be utilized to identify bubble numbers compared to the other three methods.
4.2. Intermittent electroplating and Continuous electroplating
Table 1. Computation time of the four statistical methods
Times Entropy Energy Eigenvalue Binary
1 1.384621 2.130791 2.361353 2.166485
2 1.368753 2.151099 2.339747 2.142875
3 1.355188 2.158602 2.348881 2.167367
4 1.370269 2.123856 2.329782 2.152236
5 1.337217 2.138876 2.325615 2.140957
6 1.351048 2.100191 2.336331 2.138077
7 1.371305 2.102941 2.337058 2.150824
8 1.367948 2.127589 2.309798 2.159046
9 1.368596 2.152919 2.310330 2.190473
10 1.352456 2.160211 2.349492 2.165836
Average 1.362740 2.134708 2.334839 2.157418
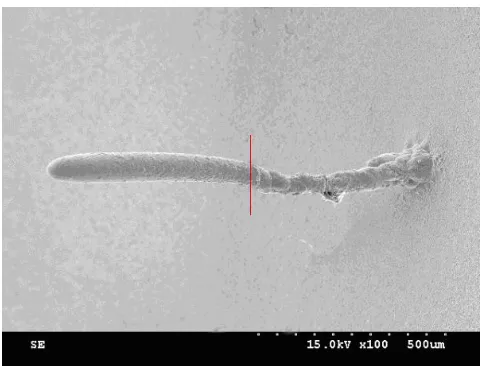
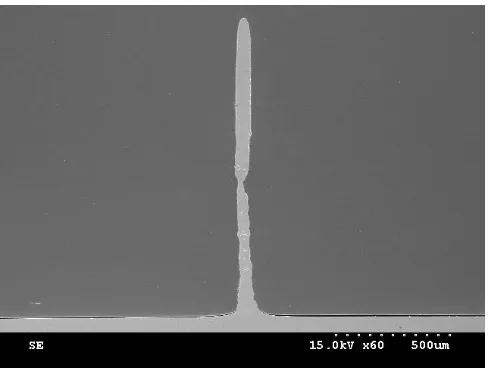
To compare intermittent electroplating and continuous electroplating, firstly, the intermittent mode of electroplating is adopted to electroplate 500um copper specimen. Secondly, within the same environment and using the same parameters, the image guided continuous mode electroplating is used for another 500um copper specimen. Figure 8 shows 100 times and Figure 9 shows 60 times SEM image of the copper specimen. The first part of the specimen, which using the intermittent mode method, does not have smooth surface, and the diameters of the column change dramatically. However, the second part of the specimen not only has smooth surface and uniform structure, but also the diameter remains almost the same along the specimen. The comparison of intermittent electroplating and continuous electroplating is in Table 2 below.
[image:10.596.177.421.68.252.2]
Figure 9. The sectional drawing image of copper specimen electroplated by intermittent mode and continuity mode
Table 2. The comparison of intermittent electroplating and continuous electroplating.
Intermittent electroplating Continuous electroplating
Hardware Simple Complex
Deposition rate Variable Constant
Surface Rough Smooth
Structure Nodular Uniform
Bubble affection No Yes
5. CONCLUSION
[image:10.596.130.467.360.483.2]
ACKNOWLEDGEMENTS
The authors are grateful to the Development Plan for World Class Universities and Research Centers of Excellence in Taiwan for the financial support of the project under contract no. 995920-5.
References
1. J.C. Lin, S.B. Jang, D.L. Lee, C.C. Chen, P.C. Yeh, T.K. Chang, J.H. Yang, J. Micromech. Microeng. 15 (2005) 2405.
2. J.H. Yang, J.C. Lin, T.K. Chang, X.B. You, S.B. Jiang , J. Micromech. Microeng. 19 (2009) 12. 3. J.D. Madden, S.R. Lafontaine, I.W. Hunter, Sixth International Symposium on Micro Machine and
Human Science. (1995) 77.
4. J.D. Madden and I.W. Hunter, Journal of Microelectromechanical Systems. 5 (1996) 24. 5. E.M. El-Giar, D.J. Thomson, WESCANEX 97: Proc. IEEE Conf. Communications, Power and
Computing. (1997) 327.
6. E.M. El-Giar, R.A. Said, G.E. Bridges, D.J. Thomson, Journal of The Electrochemical Society. 147 (2000) 586.
7. S.K. Seol, J.M. Yi, X. Jin et al , Electrochemical and Solid-State Letters. 7 (2004) C95. 8. S.K. Seol, A.R. Pyun, Y. Hwu et al, Adv. Funct. Mater. 15 (2005) 934.
9. M. Palaniappa, M. Jayalakshmi, P.M. Prasad, K. Balasubramanian, Int. J. Electrochem. Sci. 3 (2008) 452 – 461
10. M. Palaniappa, M. Jayalakshmi, B.R.V. Narasimhan, K. Balasubramanian, Int. J. Electrochem. Sci. 3 (2008) 656 - 665
11. J.H. Choo, S.H. Yeo, F.F. Tan , Microsystem Technologies. 10 (2004) 127.
12. S.H. Yeo, J.H. Choo, K.S. Yip, In Micromachining and Microfabrication Process Technology VI, 4174 (2000).
13. R.C. Gonzalez, R.E. Woods, Digital Image Processing, Prentice-Hall, New Jersey (2002). 14. R.C. Gonzalez, R.E. Woods, Digital Image Processing using MATLAB, Prentice-Hall, New
Jersey(2002).