This is a repository copy of Spectral Filtering as a Tool for Two-Dimensional Spectroscopy: A Theoretical Model.
White Rose Research Online URL for this paper: http://eprints.whiterose.ac.uk/133173/
Version: Accepted Version
Article:
Green, D, Camargo, FVA, Heisler, IA et al. (2 more authors) (2018) Spectral Filtering as a Tool for Two-Dimensional Spectroscopy: A Theoretical Model. Journal of Physical
Chemistry A, 122 (30). pp. 6206-6213. ISSN 1089-5639 https://doi.org/10.1021/acs.jpca.8b03339
© 2018 American Chemical Society. This is an author produced version of a paper
published in Journal of Physical Chemistry A. Uploaded in accordance with the publisher's self-archiving policy.
[email protected] https://eprints.whiterose.ac.uk/
Reuse
Items deposited in White Rose Research Online are protected by copyright, with all rights reserved unless indicated otherwise. They may be downloaded and/or printed for private study, or other acts as permitted by national copyright laws. The publisher or other rights holders may allow further reproduction and re-use of the full text version. This is indicated by the licence information on the White Rose Research Online record for the item.
Takedown
If you consider content in White Rose Research Online to be in breach of UK law, please notify us by
Spectral Filtering as a Tool for Two-Dimensional
Spectroscopy: A Theoretical Model
Dale Green,
†Franco V. A. Camargo
a,
†,¶Ismael A. Heisler
b,
†Arend G. Dijkstra,
‡and Garth A. Jones
∗,††School of Chemistry, University of East Anglia, Norwich Research Park, Norwich, NR4
7TJ, UK
‡School of Chemistry, University of Leeds, Leeds, LS2 9JT, UK
¶CAPES Foundation, Ministry of Education of Brazil, Brasilia DF 70040-202, Brazil
E-mail: [email protected]
a
Current address: IFN-CNR, Dipartimento di Fisica, Politecnico di Milano, Piazza L. da Vinci 32, 20133 Milano, Italy
b
Abstract
Two-dimensional optical spectroscopy is a powerful technique for the probing of
coherent quantum superpositions. Recently, the finite width of the laser spectrum
has been employed to selectively tune experiments for the study of particular
coher-ences. This involves the exclusion of certain transition frequencies, which results in
the elimination of specific Liouville pathways. The rigorous analysis of such
experi-ments requires the use of ever more sophisticated theoretical models for the optical
spectroscopy of electronic and vibronic systems. Here we develop a non-impulsive and
non-Markovian model which combines an explicit definition of the laser spectrum, via
the equation of motion-phase matching approach (EOM-PMA), with the hierarchical
equations of motion (HEOM). This theoretical framework is capable of simulating the
2D spectroscopy of vibronic systems with low frequency modes, coupled to
environ-ments of intermediate and slower timescales. In order to demonstrate the spectral
filtering of vibronic coherences, we examine the elimination of lower energy peaks from
the 2D spectra of a zinc porphyrin monomer on blue-shifting the laser spectrum. The
filtering of Liouville pathways is revealed through the disappearance of peaks from the
Introduction
The proliferation of two-dimensional optical spectroscopy (2DOS) has revolutionised research
into the structure and dynamics of chemical systems.1–3 The detection of coherent quantum
superpositions can identify electronic couplings and the existence of excitonic states, as well
as vibronic couplings and the motions of nuclear wavepackets on a potential energy surface.4,5
The study of such coherences requires the use of ultrafast spectroscopic techniques, where
2DOS provides a means of differentiating individual coherence pathways.6 These coherences
have been utilized for the investigation of energy transfer in photosynthetic light harvesting
complexes,7–17 as well as the determination of the excitonic structure of quantum dots.18–21
Organic dye molecules and macrocycles such as cyanines,22–24 and porphyrins,25,26 as well as
chromophores such as chlorophyll,27–29 have been extensively studied to explore the origins
of these coherences in biological complexes. Homodimers and larger aggregates are used
as analogues of the multichromophoric structures.30–36 2DOS has also found application to
studies of photochemistry and reaction dynamics.37–42
2DOS is a powerful technique for exploring vibronic processes, however, it is often difficult
to distinguish specific spectral features from the wealth of dynamical data produced by
each experiment.43 It has been demonstrated recently that spectral filtering - a technique
that involves focusing the laser spectrum over a specific excitation window - can be used to
distinguish electronic from vibrational coherences. Camargo et al have shown experimentally
that selective removal of peaks from the amplitude spectra can be achieved upon blue-shifting
the laser spectrum, thereby eliminating Liouville pathways associated with lower energy
transitions and allowing clearer analysis of the remaining coherences.26 This kind of analysis
has been performed recently to highlight the role of ground state vibronic wavepackets in
the Fenna-Matthews-Olson complex.44
In this work, we describe the development of a theoretical model which reproduces the
experimental 2DOS spectra of the 5,15-bisalkynyl zinc porphyrin monomer used by
laser pulses, beyond the impulsive limit, for which we adopt the equation of motion-phase
matching approach (EOM-PMA).45,46 We solve the temporal evolution using the hierarchical
equations of motion (HEOM), which allows a non-Markovian description of the system-bath
correlation function.47–49This enables the simulations to realistically model the strongly
cou-pled, overdamped low frequency intramolecular vibrations of the zinc porphyrin monomer,
accounting for ensemble effects such as inhomogeneous broadening within the evolution of
the HEOM.
By combining the EOM-PMA and HEOM quantum dynamical methods, we present a
rigorous model capable of performing the accurate evolution of an open quantum system on
interaction with a sequence of laser pulses. The combination of these methods to investigate
the effects of finite pulse widths by Leng et al highlights the potential of this model.50 As the
HEOM allows for any strength system-bath coupling and the EOM-PMA accounts for all
time-ordering effects, our model is only restricted to the weak-field and dipole approximations
in the system-field interaction.51–53An explicit definition of the coupled phonon environment
within the HEOM enables the incorporation of dissipative effects, such as intramolecular
vibrational relaxation (IVR) and fluorescence, as well as dephasing.
In this study, the model is applied to the Qx band of the zinc porphyrin monomer,
associated with the transition between the ground and first excited singlet states. The
maximum of the fundamental transition occurs at 15 650 cm−1, with a vibronic shoulder
on the blue side, identifying coupling to a vibrational mode of 375 cm−1.26 The amplitude
spectra of the coupled vibrational mode are calculated using two different laser spectra, one
which is centred at the fundamental transition frequency, and another which has been
blue-shifted such that the lower energy transition, equivalent to the first hot band, is covered by
significantly less intensity. We begin with an overview of key features of the model, greater
Theoretical Methods
The vibronic Hamiltonian, eq 1, has an electronic ground state, |gi, (S0) and a single excited
state, |ei, (S1) that lies ¯hωeg0 above the ground state equilibrium position,1
HS =|gihghg|+|eihehe| (1)
We assume all nuclear modes are harmonic, giving rise to vibronic terms in the Hamiltonian
of,54
hg = ¯hω0 b†b+ 12
(2)
he = ¯h(ω0eg+λ) + ¯hω0
b†b− √∆
2(b+b
†) + 1 2
(3)
whereb(†)are the vibrational annihilation (creation) operators for a single mode of frequency
ω0. Coupling to the electronic degrees of freedom occurs via the dimensionless parameter
∆, which is related to the Huang-Rhys parameter,S = 12∆2, giving a reorganisation energy,
¯
hλ= ¯hSω0.1
The open quantum system incorporates baths that are constructed from an infinite
num-ber of harmonic oscillators coupled linearly to the coordinates of the system.1,55The coupling
to bath,n, is defined by the spectral density,Jn(ω), which is related to the correlation
func-tion through,47,55
Cn(t) =
1
π
Z ∞
0
dωJn(ω)
coth
β¯hω
2
cosωt−isinωt
(4)
Different photophysical processes are described by the interaction of the system with
different baths. Here, we treat the dephasing that results from fluctuations of the transition
energy, IVR and fluorescence with three independent baths. All baths are assumed to be
form for an overdamped Brownian oscillator,
Jn(ω) = 2ηn
ωγn
ω2+γ2
n
(5)
where ¯hηnis the reorganisation energy of the bath andγnis a measure of the bath timescale.1,56,57
Solving the bath correlation function for the Debye spectral density produces a form
which can be expressed as the sum of exponential terms, eq 6, with the coefficients, cnk,
and Matsubara frequencies, νnk;k = 0,1, . . . , M, defined by eqs 7 to 10.56–58 The inverse
temperature, β, is the same for each bath.
Cn(t) =
M X
k=0
cnke−νnk|t| (6)
cn0 = ηnγn
cot ¯ hβγn 2 −i (7)
cnk =
4ηnγn
¯
hβ
νnk
νnk2 −γ2
n
(8)
νn0 = γn (9)
νnk =
2πk
¯
hβ (10)
As the vibrational mode included explicitly in the system Hamiltonian is of the same
order as the fluctuations of the baths, non-Markovian dynamics must be employed to
cor-rectly account for memory effects, including the emergence of inhomogeneous distributions
within the ensemble.48,52,59,60 Therefore, in order to rigorously incorporate inhomogeneous
broadening into the simulations, we employ the non-Markovian hierarchical equations of
mo-tion (HEOM) to evolve the density matrix. This involves propagating a number of auxiliary
density operators (ADO), in addition to the true density matrix, to fully account for memory
effects in the bath correlations.56,61 The evolution of the density matrix is given by equation
˙
ρj(t) = −
i
¯
hL+
N X n=1 M X k=0
jnkνnk !
ρj(t)−i
N X n=1 M X k=0
Bn×ρj+
nk(t)
−i N X n=1 M X k=0 jnk
cnkBnρj−
nk(t)−c
∗
nkρj− nk(t)Bn
−
N X
n=1
2ηn
¯
hβγn −
ηncot
¯ hβγn 2 − M X k=1 cnk νnk !
Bn×Bn×ρj(t) (11)
Here, Bn×ρ = [Bn, ρ] denotes the commutator of the bath coupling operator, Bn, with
the density matrix. L is the Liouvillian operator, which explicitly incorporates the
system-field interaction, HSF(t), via the semi-classical dipole approximation, where ˆµ is the dipole
moment operator of the system and E(r, t) the electric field of the incident laser.50
Lρ(t) = [HS−HSF(t), ρ(t)] = [HS−µˆ· E(r, t), ρ(t)] (12)
The ADOs are defined by the N(M + 1)-dimensional vectors j= (j10, . . . , jnk, . . . , jN M)
and j± = (j
10, . . . , jnk ± 1, . . . , jN M), which contain an element for every Matsubara
fre-quency associated with each contributing bath.58,61 The individual elements, j
nk, define the
hierarchical level of a particular Matsubara frequency.
The hierarchy is terminated via selection of a convergence parameter, Γ, which is
signif-icantly greater than the energy scales of the system-bath coupling; as described by Dijkstra
and Prokhorenko.57Elements of the hierarchy which are deep enough to correspond to
fluctu-ations faster than this convergence parameter are assumed to be Markovian. The termination
criterion is expressed as
N X n=1 M X k=0
jnkνnk >Γ (13)
Photon echo spectroscopy involves the interaction of the system with the electric fields
of three laser pulses. The first two pulses are separated by the coherence time, τ, and the
t= 0, with the third order polarization observed as a decaying oscillation for t >0, emitted
in the phase-matched direction, ks.62
The macroscopic polarization resulting from the photon echo measurement in the
rephas-ing (ks =−k1+k2+k3) or non-rephasing (ks =k1−k2+k3) direction is calculated using the
equation of motion-phase matching approach (EOM-PMA), developed by Gelin et al.45,46
The system-field interaction Hamiltonian is separated into the contributions of the three
electric fields, Vm(t): m = 1,2,3, according to,
ˆ
HSF(t) = −
3
X
m=1
ˆ
µ·(χmEm(t−τm) exp(−iωmt+ikmr)) +c.c.
= −
3
X
m=1
exp(ikmr)·Vm(t) +c.c. (14)
where ωm = 2πνm has an associated wavevector, km. The field envelope, centred at τm,
is denoted E(t−τm) and is assumed to be Gaussian, with χm as a controllable factor for
the intensity.51,63 Differences in the temporal phase of the pulses, leading to pulse chirp, can
be included by introducing an additional exp(+iφm(t)) factor in equation 14.64,65 However,
unchirped Gaussian pulses provide a suitable approximation for the laser spectra used by
Camargo et al.
The third order polarization in the phase matched direction, ks, is then obtained by,
Pk(3)s (τ, T, t) = exp(iksr)Tr[ˆµ(ρ1(t)−ρ2(t)−ρ3(t) +ρ4(t)−ρ5(t) +ρ6(t) +ρ7(t))] +c.c.
(15)
where ρi(t);i = 0,1, . . . ,7 are additional non-Hermitian auxiliary density operators,
indi-vidually evolved using equation 11.46 Each has a different Liouvillian operator that acts as
a generating function for Liouville pathways, such that their combination in equation 15
removes the contribution of all except the pathways of interest in the phase matched
direc-tion.45 Full details are provided in the SI. Two-dimensional photon echo spectra are then
and t.50,66
Results and Discussion
The laser spectra and experimental linear absorption spectrum of the zinc porphyrin monomer
are displayed in figure 1. In addition to theQx band, the experimental spectrum also shows
a weaker absorption band at ca. 17 000 cm−1. This corresponds to the Q
y band and any
coupling to higher frequency vibrational modes, which are not considered here.67
Nor
m
al
is
ed
I
(
ω
)
~ω /103
[image:10.612.196.402.275.424.2]cm−1
Figure 1: Calculated (gold) and experimental (dashed) linear absorption spectra for the zinc porphyrin monomer, with the centred (red) and blue-shifted (cyan) laser spectra.
The system parameters areωeg0 = 15 650 cm−1, withω
0 = 375 cm−1and ∆ = 0.8 such that
λ = 120 cm−1. Each electronic state is coupled to two vibrational levels. The simulations
were performed at 300 K with the spectral density parameters for the dephasing bath set as
η1 = 11 cm−1 and γ1 = 50 cm−1, for the IVR bath as η2 = 11 cm−1 and γ2 = 50 cm−1, and
for the fluorescence bath as η3 = 1 cm−1 and γ3 = 50 cm−1. These parameters produced the
calculated linear absorption spectrum in figure 1, which gives a good fit to the experimental
spectrum.
Two simulations were performed, one with a laser spectrum centred at the
fundamen-tal transition of ωm = 15 650 cm−1 (figure 1, red), and another which was blue-shifted to
the Gaussian envelopes. 2D photon echo spectra, presented as excitation axis, ωτ, against
emission axis, ωt, were then calculated over 1 ps of population time, T. Figure 2 (left)
shows an example rephasing photon echo spectrum for T = 120 fs from the centred laser
spectrum simulation. The elongation of the main peak about the diagonal demonstrates
inhomogeneous broadening, resulting from the dephasing bath (n = 1).
~
ωt
/
10
3
cm
−
1
~ωτ /103 cm−1
a c
b
Am
p
li
tu
d
e
T /fs
Figure 2: (Left) Normalised Real Rephasing 2D spectrum forT = 120 fs. (Right) Amplitude
oscillations of the real rephasing component for the coordinates (a) (16025, 15275), (b)
(15650, 15650) and (c) (15400, 15400), presented as (ωτ, ωt) in cm−1, arbitrarily offset for
clarity. The vertical lines in (right) demonstrate that (b) and (c) are 90◦ phase shifted with
respect to (a).
Each peak in a 2D spectrum is the result of one or more unique Liouville pathways.
In addition to rephasing and non-rephasing, these can be further classified as population
or coherence pathways dependent on the state of the system during the population time.
Population pathways correspond to non-oscillatory diagonal states and show an exponential
decay with the population time due to relaxation, whilst coherence pathways, involving
off-diagonal superpositions, oscillate at a frequency equal to the energy difference between
states.6,43 We further define positively oscillating coherences as e.g. |g
0ihg1| ∝ e+iω0T and
negatively oscillating coherences as e.g. |g1ihg0| ∝e−iω0T.
Figure 2 (right) shows the amplitude oscillations of three coordinates in the (ωτ, ωt)
plane along theT axis. These oscillations were obtained after removal of the non-oscillatory
[image:11.612.113.491.200.354.2]oscil-lations is a result of coupling to the IVR bath (n= 2). In agreement with the experimental
results of Camargo et al, there is a 90◦phase shift in the oscillations between the diagonal, (b,
c), and off-diagonal, (a), locations, with the oscillations of (c) being less intense than those
of (a) and (b).25 This supports the findings of Butkus et al, who theoretically examined the
phase of the oscillation of a single coherence pathway and predicted that rephasing coherence
pathways have a constant phase along their diagonal lineshape, but a varying phase along
their anti-diagonal lineshape.43,68
Removing the non-oscillatory population pathways from all coordinates in the (ωτ, ωt)
plane and performing a third Fourier transform over the population time, produces a series of
amplitude spectra for positive and negative oscillatory components.20Peaks in the amplitude
spectra at the mode frequency, ωT = ±ω0, therefore correspond to coherence pathways of
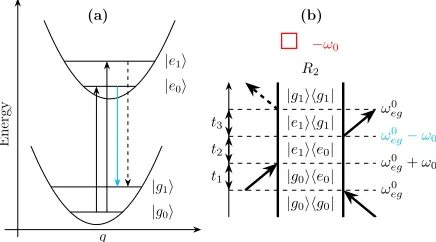
the coupled vibrational mode. An example negative rephasing coherence pathway is given in
figure 3, labelled asR2 using the 2D electronic spectroscopy convention. As this involves the
lower transition frequency ofω0
eg−ω0, blue-shifting the laser spectrum eliminates this pathway
from the 2D spectra. On inspection of all the possible Liouville pathways, the locations of
peaks in the rephasing and non-rephasing amplitude spectra are easily identified.26,69
q
E
n
er
gy
|g0i
|g1i
|e0i
|e1i
(a) t1 t2 t3 ω0 eg ω0
eg+ω0 ω0
eg−ω0
ω0
eg
|g0ihg0| |g0ihe0| |e1ihe0| |e1ihg1|
|g1ihg1|
R2
−ω0
[image:12.612.197.415.462.583.2](b)
Figure 3: Example negative rephasing coherence pathway drawn onto the displaced harmonic oscillator potential energy surface in (a) and as a double-sided Feynman diagram in (b). The lower, hot band, transition frequency (highlighted in cyan) is not covered by the blue-shifted laser spectrum, identifying this as one of the eliminated pathways.
For the simulation with the centred laser spectrum, analysis of the coherence pathways
and (1b) of figure 4, respectively.26 Six positive coherence pathways produce a square
ar-rangement of four peaks below the diagonal for the positive rephasing amplitude spectrum,
as shown by the calculated and experimental spectra, respectively (2c) and (3c) of figure 4.
The two negative coherence pathways give two peaks aligned alongωτ =ωeg0 , which are again
visible in the calculated, (2a), and experimental, (3a), results in figure 4. Both the negative
coherences correspond to stimulated emission pathways, whilst all four ground state bleach
pathways appear in the positive spectrum. Similarly, the negative non-rephasing amplitude
spectra show a square of four peaks in (2b) and (3b) of figure 4, with two peaks, again
aligned along ωτ =ωeg0 , in the equivalent positive amplitude spectra of (2d) and (3d), figure
4. In this case the four ground state bleach pathways appear in the positive spectrum, with
the negative spectrum consisting of only stimulated emission pathways. All pathways are
presented in the SI and all amplitude spectra are presented as an absolute value, normalised
to their respective maxima. The experimental spectra are reproduced from reference 26.
On blue-shifting the laser spectrum, the majority of coherence pathways are eliminated,
leaving a single ground state bleach and two stimulated emission pathways in each of the
rephasing and non-rephasing amplitude spectra; as shown in diagrams (1a) and (1b) of figure
5. Each of the amplitude spectra feature a single peak, which is off-diagonal for the positive
and negative rephasing spectra, respectively (2c)/(3c) and (2a)/(3a) of figure 5, and diagonal
for the positive and negative non-rephasing spectra, respectively (2d)/(3d) and (2b)/(3b) of
figure 5.
The elimination of coherence pathways is demonstrated by the change in position of the
maximum intensity of the amplitude spectra. With a centred laser spectrum, this maximum
appears between the predicted peak locations of (1a)/(1b) of figure 4, where the amplitude
of adjacent peaks sums. This leads to the square arrangement in (2c)/(3c) and (2b)/(3b) of
figure 4 and the elongated shape in (2a)/(3a) and (2d)/(3d) of figure 4. With a blue-shifted
laser spectrum, the loss of adjacent peaks results in the maximum intensity exactly
t1
t2
t3
ω0
eg+ω0
ω0 eg
ω0
eg+ω0
ω0 eg
|g0ihg0|
|g0ihe1|
|g0ihg1|
|e1ihg1|
|g1ihg1|
R3
+ω0
(4a)
t1
t2
t3
ω0
eg+ω0
ω0 eg
ω0 eg
ω0
eg+ω0
|g0ihg0|
|e1ihg0|
|e1ihe0|
|e1ihg0|
|g0ihg0|
R1
−ω0
(4b)
−ω0 −ω0
+ω0 +ω0
(3a) (3b)
(3c) (3d)
−ω0 −ω0
+ω0 +ω0
(2a) (2b)
(2c) (2d)
(1a) (1b)
ω0
eg ω0eg+ω0
ω 0eg ω 0eg + ω0 ω
0−eg
ω0
Rephasing
ω0
[image:14.612.191.401.73.561.2]egω0eg+ω0 Non-Rephasing E x p e ri m e n ta l C a lcul a te d
Figure 4: Predicted peak location key diagrams for rephasing (1a) and non-rephasing (1b)
amplitude spectra, for the centred laser spectrum experiment. / and / correspond to
t1 t2 t3
ω0
eg+ω0
ω0
eg
ω0
eg+ω0
ω0
eg
|g0ihg0| |g0ihe1| |e0ihe1| |e0ihg0| |g0ihg0| R2
+ω0
(4a)
t1 t2 t3
ω0
eg+ω0
ω0
eg
ω0
eg
ω0
eg+ω0
|g0ihg0| |e1ihg0| |g1ihg0| |e1ihg0| |g0ihg0| R4
−ω0
(4b)
−ω0 −ω0
+ω0 +ω0
(3a) (3b)
(3c) (3d)
−ω0 −ω0
+ω0 +ω0
(2a) (2b)
(2c) (2d)
(1a) (1b)
ω0
eg ω0eg+ω0
ω 0eg ω 0eg + ω0 ω
0−eg
ω0
Rephasing
ω0
egω0eg+ω0 Non-Rephasing E x p e ri m e n ta l C a lcul a te d
[image:15.612.191.401.116.605.2]figure 5. Any small offsets from the reported frequencies are a result of the discretization of
data.
The additional broadening in the calculated amplitude spectra of both figures 4 and 5
is a result of the approximations within the model system. Namely, the bath parameters
were selected based on the assumption that the 375 cm−1 mode is solely responsible for the
lineshape of the Qx band in the linear absorption spectrum. However, other vibrational
modes neglected in this model would also contribute to the linear lineshape, but do not
feature in the amplitude spectra specific to the 375 cm−1 mode. Hence the experimental
amplitude spectra are less broad than their calculated equivalents. As it is the peak locations
rather than the spectral broadening that is important for the Liouville pathway analysis, the
model conclusively demonstrates the spectral filtering effects induced by blue-shifting the
laser spectrum.
Conclusions
For both the centred and blue-shifted laser spectra simulations, the calculated amplitude
spectra show excellent agreement with the experimental results and the predictions of the
Liouville pathway analysis. The results presented in figures 4 and 5 clearly demonstrate the
capability of the non-impulsive and non-Markovian model for the study of vibronic
coher-ences isolated by a tunable laser spectrum. We have brought together a detailed vibronic
Hamiltonian, a rigorous definition of the evolution of the bath and a method for
calcu-lating the non-linear polarization which explicitly incorporates the laser fields, to create a
theoretical model suitable for studies involving spectral filtering effects.
For complex systems with broad absorption bands, spectral filtering can be exploited to
focus 2D spectroscopic studies on specific regions.36,44,70,71But as shown in this work, spectral
filtering can also be employed to control the pathways involved in a non-linear measurement
also provides the potential for isolation of specific Liouville pathways.28,72,73 This enables the
study of particular coherences which, with the support of rigorous theoretical models such
as that presented here, will lead to a greater understanding of the electronic and vibrational
fine structure responsible for these spectral features.
Acknowledgement
The research presented in this paper was carried out on the High Performance
Comput-ing Cluster supported by the Research and Specialist ComputComput-ing Support service at the
University of East Anglia. F. V. A. C. thanks Brazilian Funding Agency Coordination for
the Improvement of Higher Level Personnel (CAPES) for his doctoral studentship (BEX
9527/13-3). D. G. thanks the Faculty of Science at the University of East Anglia for his
studentship funding.
Supporting Information Available
Supporting Information Available: Complete details of the model and Liouville pathway
analysis, and additional examples of the calculated 2D spectra. This information is available
free of charge via the Internet at http://pubs.acs.org
References
(1) Mukamel, S. Principles of Nonlinear Optical Spectroscopy; Oxford University Press:
New York, 1995.
(2) Jonas, D. M. Two-Dimensional Femtosecond Spectroscopy. Annu. Rev. Phys. Chem.
2003, 54, 425–463.
Being Used to Address Core Scientific Questions in Biology and Materials Science. J.
Phys. Chem. B 2018, 122, 1771–1780.
(4) Turner, D. B.; Wilk, K. E.; Curmi, P. M. G.; Scholes, G. D. Comparison of Electronic
and Vibrational Coherence Measured by Two-Dimensional Electronic Spectroscopy.J.
Phys. Chem. Lett. 2011, 2, 1904–1911.
(5) Scholes, G. D.; Fleming, G. R.; Chen, L. X.; Aspuru-Guzik, A.; Buchleitner, A.;
Coker, D. F.; Engel, G. S.; van Grondelle, R.; Ishizaki, A.; Jonas, D. M. et al. Using
Coherence to Enhance Function in Chemical and Biophysical Systems. Nature 2017,
543, 647–656.
(6) Dean, J. C.; Scholes, G. D. Coherence Spectroscopy in the Condensed Phase: Insights
into Molecular Structure, Environment, and Interactions. Acc. Chem. Res. 2017, 50,
2746–2755.
(7) Brixner, T.; Stenger, J.; Vaswani, H. M.; Cho, M.; Blankenship, R. E.; Fleming, G. R.
Two-Dimensional Spectroscopy of Electronic Couplings in Photosynthesis. Nature
2005, 434, 625–628.
(8) Engel, G. S.; Calhoun, T. R.; Read, E. L.; Ahn, T.-K.; Manˇcal, T.; Cheng, Y.-C.;
Blankenship, R. E.; Fleming, G. R. Evidence for Wavelike Energy Transfer through
Quantum Coherence in Photosynthetic Systems. Nature 2007, 446, 782–786.
(9) Schlau-Cohen, G. S.; Calhoun, T. R.; Ginsberg, N. S.; Read, E. L.; Ballottari, M.;
Bassi, R.; van Grondelle, R.; Fleming, G. R. Pathways of Energy Flow in LHCII from
Two-Dimensional Electronic Spectroscopy.J. Phys. Chem. B 2009, 113, 15352–15363.
(10) Collini, E.; Wong, C. Y.; Wilk, K. E.; Curmi, P. M. G.; Brumer, P.; Scholes, G. D.
Coherently Wired Light-Harvesting in Photosynthetic Marine Algae at Ambient
(11) Panitchayangkoon, G.; Hayes, D.; Fransted, K. A.; Caram, J. R.; Harel, E.; Wen, J.;
Blankenship, R. E.; Engel, G. S. Long-Lived Quantum Coherence in Photosynthetic
Complexes at Physiological Temperature. Proc. Natl. Acad. Sci. U. S. A. 2010, 107,
12766–12770.
(12) Fassioli, F.; Dinshaw, R.; Arpin, P. C.; Scholes, G. D. Photosynthetic Light Harvesting:
Excitons and Coherence. J. R. Soc., Interface 2013, 11, 20130901.
(13) Richards, G. H.; Wilk, K. E.; Curmi, P. M. G.; Davis, J. A. Disentangling Electronic
and Vibrational Coherence in the Phycocyanin-645 Light-Harvesting Complex.J. Phys.
Chem. Lett. 2014, 5, 43–49.
(14) Chenu, A.; Scholes, G. D. Coherence in Energy Transfer and Photosynthesis. Annu.
Rev. Phys. Chem. 2015, 66, 69–96.
(15) Dost´al, J.; Pˇsenˇc´ık, J.; Zigmantas, D. In Situ Mapping of the Energy Flow through the
Entire Photosynthetic Apparatus. Nat. Chem. 2016, 8, 705–710.
(16) Dahlberg, P. D.; Ting, P.-C.; Massey, S. C.; Allodi, M. A.; Martin, E. C.; Hunter, C. N.;
Engel, G. S. Mapping the Ultrafast Flow of Harvested Solar Energy in Living
Photo-synthetic Cells. Nat. Commun. 2017,8, 988.
(17) Rolczynski, B. S.; Zheng, H.; Singh, V. P.; Navotnaya, P.; Ginzburg, A. R.;
Caram, J. R.; Ashraf, K.; Gardiner, A. T.; Yeh, S.-h.; Kais, S. et al. Correlated Protein
Environments Drive Quantum Coherence Lifetimes in Photosynthetic Pigment-Protein
Complexes. Chem 2018,4, 138–149.
(18) Harel, E.; Rupich, S. M.; Schaller, R. D.; Talapin, D. V.; Engel, G. S. Measurement
of Electronic Splitting in PbS Quantum Dots by Two-Dimensional Nonlinear
(19) Fingerhut, B. P.; Richter, M.; Luo, J.-W.; Zunger, A.; Mukamel, S. 2D Optical Photon
Echo Spectroscopy of a Self-Assembled Quantum Dot.Ann. Phys. (Berlin, Ger.)2013,
525, 31–42.
(20) Seibt, J.; Pullerits, T. Beating Signals in 2D Spectroscopy: Electronic or Nuclear
Co-herences? Application to a Quantum Dot Model System.J. Phys. Chem. C 2013,117,
18728–18737.
(21) Tollerud, J. O.; Cundiff, S. T.; Davis, J. A. Revealing and Characterizing Dark Excitons
through Coherent Multidimensional Spectroscopy.Phys. Rev. Lett. 2016,117, 097401.
(22) Manˇcal, T.; Christensson, N.; Lukeˇs, V.; Milota, F.; Bixner, O.; Kauffmann, H. F.;
Hauer, J. System-Dependent Signatures of Electronic and Vibrational Coherences in
Electronic Two-Dimensional Spectra. J. Phys. Chem. Lett.2012, 3, 1497–1502.
(23) Duan, H.-G.; Nalbach, P.; Prokhorenko, V. I.; Mukamel, S.; Thorwart, M. On the
Origin of Oscillations in Two-Dimensional Spectra of Excitonically-Coupled Molecular
Systems. New J. Phys. 2015, 17, 072002.
(24) Tempelaar, R.; Halpin, A.; Johnson, P. J. M.; Cai, J.; Murphy, R. S.; Knoester, J.;
Miller, R. J. D.; Jansen, T. L. C. Laser-Limited Signatures of Quantum Coherence. J.
Phys. Chem. A 2016, 120, 3042–3048.
(25) Camargo, F. V. A.; Anderson, H. L.; Meech, S. R.; Heisler, I. A. Full Characterization
of Vibrational Coherence in a Porphyrin Chromophore by Two-Dimensional Electronic
Spectroscopy. J. Phys. Chem. A2015,119, 95–101.
(26) Camargo, F. V. A.; Grimmelsmann, L.; Anderson, H. L.; Meech, S. R.; Heisler, I. A.
Resolving Vibrational from Electronic Coherences in Two-Dimensional Electronic
(27) Moca, R.; Meech, S. R.; Heisler, I. A. Two-Dimensional Electronic Spectroscopy of
Chlorophyll a: Solvent Dependent Spectral Evolution. J. Phys. Chem. B 2015, 119,
8623–8630.
(28) Senlik, S. S.; Policht, V. R.; Ogilvie, J. P. Two-Color Nonlinear Spectroscopy for the
Rapid Acquisition of Coherent Dynamics.J. Phys. Chem. Lett. 2015,6, 2413–2420.
(29) Meneghin, E.; Leonardo, C.; Volpato, A.; Bolzonello, L.; Collini, E. Mechanistic Insight
into Internal Conversion Process Within Q-Bands of Chlorophyll a.Sci. Rep. 2017,7,
11389.
(30) Ginsberg, N. S.; Cheng, Y.-C.; Fleming, G. R. Two-Dimensional Electronic
Spec-troscopy of Molecular Aggregates. Acc. Chem. Res. 2009, 42, 1352–1363.
(31) Halpin, A.; Johnson, P. J. M.; Tempelaar, R.; Murphy, R. S.; Knoester, J.; Jansen, T.
L. C.; Miller, R. J. D. Two-Dimensional Spectroscopy of a Molecular Dimer Unveils the
Effects of Vibronic Coupling on Exciton Coherences.Nat. Chem. 2014, 6, 196–201.
(32) Camargo, F. V. A.; Anderson, H. L.; Meech, S. R.; Heisler, I. A. Time-Resolved
Twist-ing Dynamics in a Porphyrin Dimer Characterized by Two-Dimensional Electronic
Spectroscopy. J. Phys. Chem. B 2015, 119, 14660–14667.
(33) Lim, J.; Paleˇcek, D.; Caycedo-Soler, F.; Lincoln, C. N.; Prior, J.; von Berlepsch, H.;
Huelga, S. F.; Plenio, M. B.; Zigmantas, D.; Hauer, J. Vibronic Origin of Long-Lived
Coherence in an Artificial Molecular Light Harvester. Nat. Commun. 2015, 6, 7755.
(34) Bolzonello, L.; Fassioli, F.; Collini, E. Correlated Fluctuations and Intraband Dynamics
of J-Aggregates Revealed by Combination of 2DES Schemes.J. Phys. Chem. Lett.2016,
7, 4996–5001.
Controlling Quantum-Beating Signals in 2D Electronic Spectra by Packing Synthetic
Heterodimers on Single-Walled Carbon Nanotubes. Nat. Chem.2017,9, 219–225.
(36) Cipolloni, M.; Fresch, B.; Occhiuto, I.; Rukin, P.; Komarova, K. G.; Cecconello, A.;
Willner, I.; Levine, R. D.; Remacle, F.; Collini, E. Coherent Electronic and Nuclear
Dynamics in a Rhodamine Heterodimer-DNA Supramolecular Complex. Phys. Chem.
Chem. Phys.2017,19, 23043–23051.
(37) Kullmann, M.; Ruetzel, S.; Buback, J.; Nuernberger, P.; Brixner, T. Reaction Dynamics
of a Molecular Switch Unveiled by Coherent Two-Dimensional Electronic Spectroscopy.
J. Am. Chem. Soc. 2011,133, 13074–13080.
(38) Anna, J. M.; Baiz, C. R.; Ross, M. R.; Mccanne, R.; Kubarych, K. J. Ultrafast
Equilib-rium and Non-EquilibEquilib-rium Chemical Reaction Dynamics Probed with Multidimensional
Infrared Spectroscopy. Int. Rev. Phys. Chem. 2012, 31, 367–419.
(39) Ruetzel, S.; Diekmann, M.; Nuernberger, P.; Walter, C.; Engels, B.; Brixner, T.
Mul-tidimensional Spectroscopy of Photoreactivity. Proc. Natl. Acad. Sci. U. S. A. 2014,
111, 4764–4769.
(40) Kiefer, L. M.; King, J. T.; Kubarych, K. J. Dynamics of Rhenium Photocatalysts
Revealed through Ultrafast Multidimensional Spectroscopy. Acc. Chem. Res. 2015,
48, 1123–1130.
(41) Nuernberger, P.; Ruetzel, S.; Brixner, T. Multidimensional Electronic Spectroscopy of
Photochemical Reactions.Angew. Chem., Int. Ed. 2015, 54, 11368–11386.
(42) Bolzonello, L.; Polo, A.; Volpato, A.; Meneghin, E.; Cordaro, M.; Trapani, M.;
Fortino, M.; Pedone, A.; Castriciano, M. A.; Collini, E. Two-Dimensional Electronic
Spectroscopy Reveals Dynamics and Mechanisms of Solvent-Driven Inertial Relaxation
(43) Butkus, V.; Zigmantas, D.; Valkunas, L.; Abramavicius, D. Vibrational vs. Electronic
Coherences in 2D Spectrum of Molecular Systems.Chem. Phys. Lett.2012,545, 40–43.
(44) Maiuri, M.; Ostroumov, E. E.; Saer, R. G.; Blankenship, R. E.; Scholes, G. D. Coherent
Wavepackets in the Fenna-Matthews-Olson Complex are Robust to Excitonic-Structure
Perturbations caused by Mutagenesis. Nat. Chem. 2018, 10, 177–183.
(45) Gelin, M. F.; Egorova, D.; Domcke, W. Efficient Method for the Calculation of
Time-and Frequency-Resolved Four-Wave Mixing Signals Time-and its Application to Photon-Echo
Spectroscopy. J. Chem. Phys. 2005, 123, 164112.
(46) Gelin, M. F.; Egorova, D.; Domcke, W. Efficient Calculation of Time- and
Frequency-Resolved Four-Wave-Mixing Signals. Acc. Chem. Res. 2009, 42, 1290–1298.
(47) Tanimura, Y. Nonperturbative Expansion Method for a Quantum System Coupled to
a Harmonic-Oscillator Bath. Phys. Rev. A 1990, 41, 6676–6687.
(48) Tanimura, Y. Stochastic Liouville, Langevin, Fokker-Planck, and Master Equation
Ap-proaches to Quantum Dissipative Systems. J. Phys. Soc. Jpn. 2006,75, 082001.
(49) de Vega, I.; Alonso, D. Dynamics of Non-Markovian Open Quantum Systems. Rev.
Mod. Phys. 2017,89, 015001.
(50) Leng, X.; Yue, S.; Weng, Y.-X.; Song, K.; Shi, Q. Effects of Finite Laser Pulse Width
on Two-Dimensional Electronic Spectroscopy. Chem. Phys. Lett. 2017, 667, 79–86.
(51) Sharp, L. Z.; Egorova, D.; Domcke, W. Efficient and Accurate Simulations of
Two-Dimensional Electronic Photon-Echo Signals: Illustration for a Simple Model of the
Fenna-Matthews-Olson Complex. J. Chem. Phys. 2010, 132, 014501.
(52) Tanimura, Y. Real-Time and Imaginary-Time Quantum Hierarchal Fokker-Planck
(53) Sala, M.; Egorova, D. Two-Dimensional Photon-Echo Spectroscopy at a Conical
In-tersection: A Two-Mode Pyrazine Model with Dissipation. Chem. Phys. 2016, 481,
206–217.
(54) Egorova, D.; Gelin, M. F.; Domcke, W. Analysis of Cross Peaks in Two-Dimensional
Electronic Photon-Echo Spectroscopy for Simple Models with Vibrations and
Dissipa-tion. J. Chem. Phys. 2007,126, 074314.
(55) Dijkstra, A. G.; Tanimura, Y. Linear and Third- and Fifth-Order Nonlinear
Spectro-scopies of a Charge Transfer System Coupled to an Underdamped Vibration.J. Chem.
Phys. 2015, 142, 212423.
(56) Dijkstra, A. G.; Tanimura, Y. System Bath Correlations and the Nonlinear Response
of Qubits. J. Phys. Soc. Jpn. 2012, 81, 063301.
(57) Dijkstra, A. G.; Prokhorenko, V. I. Simulation of Photo-Excited Adenine in Water with
a Hierarchy of Equations of Motion Approach. J. Chem. Phys. 2017, 147, 064102.
(58) Chen, L.; Zheng, R.; Shi, Q.; Yan, Y. Optical Line Shapes of Molecular Aggregates:
Hierarchical Equations of Motion Method.J. Chem. Phys. 2009, 131, 094502.
(59) Tanimura, Y.; Ishizaki, A. Modeling, Calculating, and Analyzing Multidimensional
Vibrational Spectroscopies. Acc. Chem. Res. 2009, 42, 1270–1279.
(60) Tanimura, Y. Reduced Hierarchy Equations of Motion Approach with Drude plus
Brow-nian Spectral Distribution: Probing Electron Transfer Processes by means of
Two-Dimensional Correlation Spectroscopy. J. Chem. Phys. 2012, 137, 22A550.
(61) Ishizaki, A.; Tanimura, Y. Nonperturbative Non-Markovian Quantum Master Equation:
Validity and Limitation to Calculate Nonlinear Response Functions.Chem. Phys.2008,
(62) Brixner, T.; Manˇcal, T.; Stiopkin, I. V.; Fleming, G. R. Phase-Stabilized
Two-Dimensional Electronic Spectroscopy. J. Chem. Phys. 2004, 121, 4221–4236.
(63) Egorova, D. Oscillations in Two-Dimensional Photon-Echo Signals of Excitonic and
Vi-bronic Systems: Stick-Spectrum Analysis and its Computational Verification.J. Chem.
Phys. 2014, 140, 034314.
(64) Tekavec, P. F.; Myers, J. A.; Lewis, K. L. M.; Fuller, F. D.; Ogilvie, J. P. Effects of
Chirp on Two-Dimensional Fourier Transform Electronic Spectra. Opt. Express 2010,
18, 11015.
(65) Christensson, N.; Avlasevich, Y.; Yartsev, A.; M¨ullen, K.; Pascher, T.; Pullerits, T.
Weakly Chirped Pulses in Frequency Resolved Coherent Spectroscopy. J. Chem. Phys.
2010, 132, 174508.
(66) Cheng, Y.-C.; Engel, G. S.; Fleming, G. R. Elucidation of Population and Coherence
Dynamics using Cross-Peaks in Two-Dimensional Electronic Spectroscopy.Chem. Phys.
2007, 341, 285–295.
(67) Drobizhev, M.; Stepanenko, Y.; Dzenis, Y.; Karotki, A.; Rebane, A.; Taylor, P. N.;
An-derson, H. L. Extremely Strong Near-IR Two-Photon Absorption in Conjugated
Por-phyrin Dimers: Quantitative Description with Three-Essential-States Model. J. Phys.
Chem. B 2005, 109, 7223–7236.
(68) Butkus, V.; Zigmantas, D.; Abramavicius, D.; Valkunas, L. Distinctive Character of
Electronic and Vibrational Coherences in Disordered Molecular Aggregates. Chem.
Phys. Lett. 2013,587, 93–98.
(69) Caram, J. R.; Fidler, A. F.; Engel, G. S. Excited and Ground State Vibrational
Dy-namics Revealed by Two-Dimensional Electronic Spectroscopy. J. Chem. Phys. 2012,
(70) Wells, K. L.; Lambrev, P. H.; Zhang, Z.; Garab, G.; Tan, H.-S. Pathways of Energy
Transfer in LHCII Revealed by Room-Temperature 2D Electronic Spectroscopy. Phys.
Chem. Chem. Phys. 2014, 16, 11640–11646.
(71) Dean, J. C.; Mirkovic, T.; Toa, Z. S.; Oblinsky, D. G.; Scholes, G. D. Vibronic
En-hancement of Algae Light Harvesting. Chem 2016, 1, 858–872.
(72) Tollerud, J. O.; Hall, C. R.; Davis, J. A. Isolating Quantum Coherence using Coherent
Multi-Dimensional Spectroscopy with Spectrally Shaped Pulses. Opt. Express 2014,
22, 6719.
(73) Novelli, F.; Nazir, A.; Richards, G. H.; Roozbeh, A.; Wilk, K. E.; Curmi, P.
M. G.; Davis, J. A. Vibronic Resonances Facilitate Excited-State Coherence in