www.electrochemsci.org
Sensitive Voltammetric Determination of Morin on a
Multi-Walled Carbon Nanotubes-Paraffin Oil Paste Electrode
Ping Xiao, Qin Zhou, Fei Xiao, Faqiong Zhao and Baizhao Zeng
Department of Chemistry, Wuhan University, Wuhan 430072, P. R. China E-mail: zengbz@chem.whu.edu.cn
Received: 20 June 2006 / Accepted: 2 August 2006 / Published: 1 September 2006
The electrochemical behavior of morin at a multi-walled carbon nanotubes-paraffin oil paste electrode (CNTPE) has been studied. Morin can cause a sensitive anodic peak at 0.52 V (vs. SCE) in 0.10 M phosphate buffer (pH=2.0), which results from a 2e transfer, accompanied by two protons transfer. The electrochemical process is irreversible and adsorption-controlled. For voltammetric determination of morin the parameters influencing the anodic peak, such as pH, accumulation potential and accumulation time have been optimized. Under the selected conditions, the anodic peak current is linear to morin concentration in the range of 5.0×10⁻⁹ to 1.0×10⁻⁷ M, and the detection limit is 1.0×10⁻⁹ M. This method has been applied to the determination of morin in Chinese traditional medicine Glycyrrhiza, and the recovery is 97.0~100.5%. Experimental results reveal that the CNTPE has advantages of small background current, high signal to background current ratio and good reproducibility.
Keywords: morin, multi-walled carbon nanotubes, paraffin oil, paste electrode, voltammetry
1. INTRODUCTION
O
O OH
HO
OH
OH
HO
Scheme 1. The molecular structure of morin
and has potent anti-oxidation. It is widely used as probe for detection of metal ions [5-7] and some bio-macromolecules, such as nucleic acid [8] and protein [9]. Morin also shows various biological and biochemical effects, including anti-inflammatory and cardiprotective activities [10].
Many methods have been developed for the determination and study of morin. For example, Shu et al. determined morin using high-performance liquid chromatography with spectrophotometric detector [11]. Owing to its electrochemical activity, electrochemical methods play an important role in the investigation of morin. For example, Liu et al. studied its voltammetric property in cetyltrimethyl ammonium bromide (CTAB) micelle [12]. The results suggest that the redox of morin not be blocked but become a little difficult in CTAB micelle. Kang et al. explored the electrochemical behavior of morin in an acetate buffer solution and the interaction mechanism of it with DNA [13]. They demonstrated that morin could bind with DNA through intercalating mode, and estimated some kinetic parameters concerned. Graphite paste electrodes were attempted by Volikakis et al. to determine several flavonoids including morin, and the detection limits were about 50 nM [14]. In electrochemical study of flavonoids carbon based electrodes are usually adopted due to their excellent performance, such as graphite paste electrode [14,15], glassy carbon electrode [16,17] and carbon disc electrode [18]. To our knowledge, no investigation on morin using carbon nanotubes paste electrode has been reported, hitherto. In this work, a multi-walled carbon nanotubes-paraffin oil paste electrode (CNTPE) is fabricated and used to study the voltammetric behavior of morin. Morin exhibits a very sensitive and well defined anodic peak on it. Therefore, a sensitive voltammetric method is developed for its determination.
2. EXPERIMENTAL PART
2.1 Reagents
µm, Purity: 95%) came from Shenzhen Nanotech Port Co. Ltd. (Shenzhen, China). Other reagents used were of analytical grade.
2.2 Apparatus
A CHI 660B electrochemical workstation (CH Instrumental Company, Shanghai, China) was used for electrochemical measurements. A conventional three-electrode system was adopted, which involved a carbon nanotube paste electrode as working electrode, a saturated calomel electrode as reference electrode (SCE) and a platinum wire as counter electrode. UV-visible spectra were recorded with a TU-1901 UV spectrophotometer (Purkinje General Instrument Co., Ltd, Beijing, China). The scanning electron microscope (SEM) image was obtained using a HITACHI X-650 SEM (Hitachi, Japan). Fluorescence spectra were recorded with a RF-5000 spectrofluorophotometer (Hitachi, Japan).
2.3 Preparation of paste electrodes
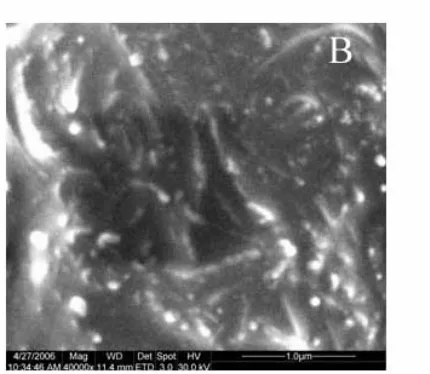
[image:3.612.324.539.450.637.2]Certain amounts of multi-walled carbon nanotubes and paraffin oil were taken and mixed thoroughly in an agate mortar with pestle. The ratio of carbon nanotubes to paraffin oil was 7/3(weight / weight). The mixture was pushed into a glass pipe (Φ=2.0 mm) in which a copper wire was embedded to produce electrical connection. The resulting electrode was noted as CNTPE and its surface was renewed by polishing on a weighing paper after pushing out a little paste. The SEM images of the paste film are shown in Fig.1. The CNTs gather to form small particles due to the effect of paraffin oil, in addition to tangle and twist each other.
2.4 Experimental procedure
For voltammetric measurements, the electrode system was immersed into a cell containing working solution. After 60 s accumulation on open circuit under stirring and 2 s rest, potential scan was initiated. Cyclic voltammograms were recorded between 0.2 and 0.8 V at scan rate of 100 mV s-1.
Following this, the potential scan was repeated successively for 5 times in a blank solution for the electrode to regenerate. All experiments were carried out at room temperature.
3. RESULTS AND DISCUSSION
3.1 Voltammetric response of morin on CNTPE
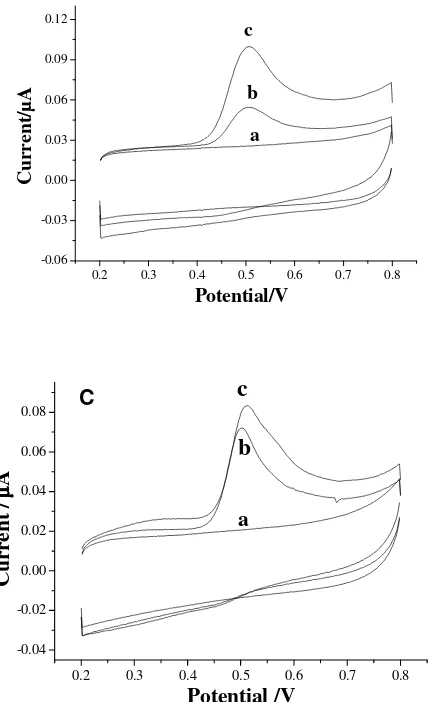
In a 0.10 M phosphate buffer solution (pH=2.0) morin can produce an anodic peak at 0.52 V on the CNTPE (Fig. 2A). However, upon reversal of the potential scan no cathodic peak appears. This indicates that the electrochemical process is irreversible. As can be seen, the background current and the peak current of morin are quite small.
0.2 0.3 0.4 0.5 0.6 0.7 0.8 -2.0 -1.5 -1.0 -0.5 0.0 0.5 1.0 1.5 B C ur re nt / µA Potential/V ab c
0.2 0.3 0.4 0.5 0.6 0.7 0.8
-0.04 -0.02 0.00 0.02 0.04 0.06 0.08 a C C ur re nt / µµµµ A Potential /V b c
0.2 0.3 0.4 0.5 0.6 0.7 0.8 -0.06 -0.03 0.00 0.03 0.06 0.09 0.12 C ur re nt /µ A Potential/V a b c
Figure 2 Cyclic voltammograms of CNTPE (A), CNTs modified glassy carbon electrode (B) and graphite powder-paraffin oil paste electrode (C) in a blank solution (a) and in a 1.0×10
-6 M morin solution (b, c). Scan rate:
[image:4.612.88.303.344.695.2]However, it is observed that morin can cause a much bigger anodic peak on a multi-walled carbon nanotubes coated glassy carbon electrode with same geometric area as the CNTPE, while the background current of the resulting electrode is also large (Fig. 2B). Therefore, it can be thought that paraffin oil can make the effective area and double-layer electric capacity of the CNTPE decrease greatly. This means that the oxidation of morin occurs only on small part of the CNTPE surface in this case. However, it is difficult to make clear where the electrochemical reaction virtually occurs. As the ratio of signal to background current is larger in comparison with CNTs modified glassy carbon electrode (Fig. 2B) and graphite powder-paraffin oil paste electrode (Fig. 2C), the CNTPE has some potential in the determination of morin.
3.2 Influence of scan rate
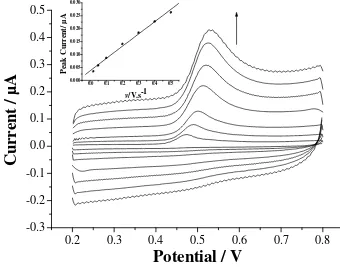
The influence of scan rate (v) on the anodic peak of morin on the CNTPE is shown in Fig. 3. The peak current is proportion to scan rate in the range studied, the regression equation is ipa=0.0037+0.048 v
(correlation coefficient r=0.996).
0.2
0.3
0.4
0.5
0.6
0.7
0.8
-0.3
-0.2
-0.1
0.0
0.1
0.2
0.3
0.4
0.5
0.0 0.1 0.2 0.3 0.4 0.5
0.000 0.005 0.010 0.015 0.020 0.025 0.030
Pe
ak
C
ur
re
nt
/µ
A
v/V.s-1
C
ur
re
nt
/
µA
[image:5.612.131.471.313.580.2]Potential / V
Figure 3 Dependence of peak current on scan rate. Scan rate: 20, 50, 100, 200, 300, 400, 500 mV s-1
(from inner to outer); other conditions as in Fig. 2; insert is the peak current vs. v plot.
This reflects the adsorption-controlled feature of the electrochemical process. According to the relationship between peak current (ip) and charge (Q) for an irreversible adsorption system:
ip=n2F2AΓv/4RT=nQFv/4RT (Where A is the electrode area, Γis the surface adsorption amount, and
accordance with that reported in literature [13]. As the peak potential (Epa) and lnv for an irreversible
system obey the following equation [20]: Epa = E0´ + m [0.78+ln (D1/2k s-1) - 0.5ln m] + (m/2) lnv (m =
RT/ [(1-α) n F]; D: diffusion coefficient of the electroactive species; k s: electron-transfer constant).
Based on the slope of the fitted linear relationship: Epa=0.539+0.0164lnv (Epa: V; v: V s-1; r=0.999), the
value of electron-transfer coefficient (
α
) is estimated and it is 0.62.3.3 Effect of solution pH
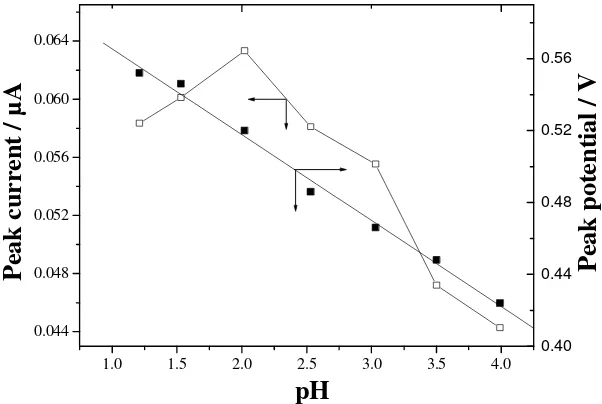
Figure 4 depicts the influence of solution pH. With increasing pH the peak shifts negatively, and the pH and Ep show a linear relationship. The regression equation is: Ep(V)=0.613-0.048pH (r=0.996),
thus it can be logically thought that the proton number involved equals the number of electron transferred in the electrochemical reaction. The peak current increases with pH rising slightly, and it attains a maximum value at about pH 2.0. When pH exceeds 2 the peak current decreases gradually. This is related to the change of ionic strength and protonization ratio of the end groups (i.e. -COOH and –OH) on CNTs, which can affect the accumulation efficiency of morin on the electrode surface. In this work pH 2.0 is adopted in the determination of morin.
1.0 1.5 2.0 2.5 3.0 3.5 4.0
0.044 0.048 0.052 0.056 0.060 0.064
0.40 0.44 0.48 0.52 0.56
Pe
ak
p
ot
en
tia
l /
V
Pe
ak
c
ur
re
nt
/
µA
[image:6.612.151.452.334.536.2]pH
Figure 4. Influence of solution pH on peak current and peak potential. Other conditions as in Fig. 2.
3.4 Influence of accumulation potential and accumulation time
When the accumulation potential changes from -0.6 V to 0.4 V, the peak current almost keeps unchanged, revealing that the accumulation of morin is almost independent of electrostatic interaction. This can be ascribed to the neutral nature of morin under this pH condition. So the accumulation of morin is carried out on open circuit. The influence of accumulation time on the anodic peak current is illustrated in Fig. 5. For a 1.0×10⁻⁶ M morin solution the peak current increases rapidly within 60 s,
concentration is lowered to 1.0×10⁻⁷ M, the accumulation time needed for the anodic peak to attain a
maximum changes a little. The accumulation time is fixed at 60 s in this work.
0 30 60 90 120 150
0.02 0.03 0.04 0.05 0.06 0.07 A P ea k cu rr en t / µµµµ A
[image:7.612.91.538.125.273.2]t / s
Figure 5. Variation of peak current with accumulation time. Morin concentration: 1.0×10⁻⁶ M (A) and
1.0×10⁻⁷ M (B); other conditions as in Fig. 2.
3.5 Calibration curve and reproducibility
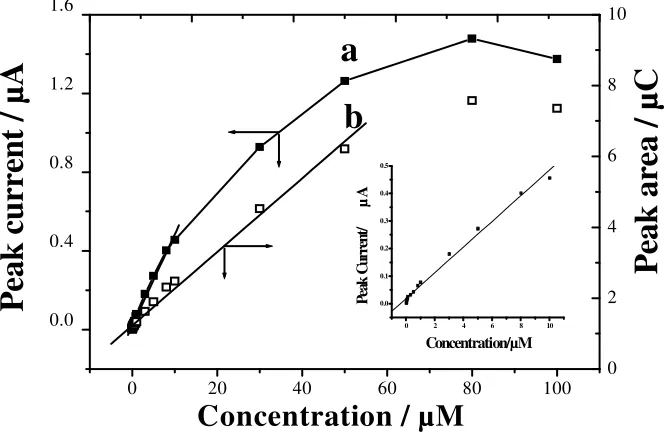
Under the selected conditions, a series of morin solutions with different concentration was measured. The results show that the anodic peak current is linear to morin concentration over the range from 5.0×10⁻⁹ to 1.0×10⁻⁷ M (Fig. 6a).
0 20 40 60 80 100
0.0 0.4 0.8 1.2 1.6 0 2 4 6 8 10
0 2 4 6 8 10
0.0 0.1 0.2 0.3 0.4 0.5 Pe ak C ur re nt / µA Concentration/µM
Pe
ak
a
re
a
/ µ
C
Pe
ak
c
ur
re
nt
/
µA
Concentration / µM
b
a
Figure 6 Variation of peak current (a) and peak area (b) with morin concentration (5.0×10⁻⁹ ~ 1.0×10⁻⁴
M). Other conditions as in Fig. 2; insert is the calibration plot of morin at lower concentration (i.e. 5.0×10⁻⁹ to 1.0×10⁻⁷ M).
-20 0 20 40 60 80 100 120 140 160 0.006 0.008 0.010 0.012 B P ea k cu rr en t / µµµµ A
[image:7.612.143.476.442.658.2]The regression equation is: ip(µA) =0.0192+0.0465c (µM, r=0.995). The detection limit is estimated to
be 1.0×10⁻⁹ M (S/N=3) for 60 s accumulation, which is lower than that of a multi-walled carbon
nanotube modified glassy carbon electrode. This indicates that the system is quite sensitive and suitable for the determination of trace morin. Fig. 6b depicts the corresponding variation of peak area (i.e. charge Q) with morin concentration. It can be seen, in the range of 5.0×10⁻⁹ to 5.0×10⁻⁷ M, the
peak area and concentration show a linear relationship, which fit the equation Q(µC)=0.022+0.0187c (c: µM, r=0.996). When morin concentration exceeds 8.0×10⁻⁵ M, the peak area almost no longer
changes. Hence the adsorption of morin shows some feature of Langumir adsorption.
After every determination, the CNTPE was regenerated by cycling in a blank solution for 5 times. A repetitive determination was performed with a 1.0×10⁻⁶ M morin solution. As a result, the relative
standard derivation (RSD) for the peak current was 3.9% (n=8). When a 1.0×10⁻⁷ M morin solution
was used to replace the 1.0×10⁻⁶ M morin, the RSD was 2.4%(n=8). This indicates that the CNTPE has
good reproducibility.
3.6 Influence of some foreign species
The influence of some foreign species has been examined. The results show that in the presence of 100-fold K+, Na+, Ca2+, Hg2+, Mg2+, glucose, VB
1 and 50 folds Ag+, Cu2+, Pb2+, Zn2+, uric acid,
ascorbic acid, folic acid, the peak current of morin is varied by less than 10%. Meanwhile, the influence of several kinds of surfactants is also tested. It is found that cation surfactants cetylpyridinumbromide (CPB) and cetytrimethylammonium (CTAB) has enhanced effect to the anodic peak when their concentration is small (i.e. at micro mole level), while anion surfactants sodium dodecyl sulfate (SDS) and sodium dodecyl benzene sulfonate (SDBS) depress the peak. This can be ascribed to an associated or competitive adsorption among them. CPB and CTAB can neutralize the negative charges held by CNTs and induce the adsorption of morin. SDS and SDBS are almost neutral at this pH, and thus can cause competitive adsorption.
As DNA can interact with morin, its influence is investigated. As a result, when DNA is present the anodic peak of morin decreases. The change of peak current and DNA concentration show a linear relationship, and the regression equation is ∆ip(µA) = 0.157-0.0026c (µg mL-1; morin concentration:
1.0×10⁻⁶ M; r=0.998). However, the peak potential keeps unchanged, which is different from that reported in literature [13]. In it, the peak potential shifts positively. The UV-absorption spectra of them are recorded, but no change reflecting their combination is observed. Therefore, it is thought that they may form electroinactive supermolecular complex or compete with each other while adsorbing on CNTPE under this condition.
3.7 Analytical application
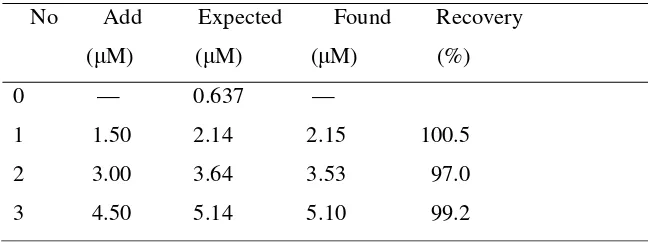
Table 1 Measurement results of morin in Glycyrrhiza
No Add Expected Found Recovery ( M) ( M) ( M) (%) 0 — 0.637 —
1 1.50 2.14 2.15 100.5 2 3.00 3.64 3.53 97.0 3 4.50 5.14 5.10 99.2
The recovery for standards added is 97.0-100.5%. The content of morin in Glycyrrhiza is calculated and it is 0.15%, which is in accordance with that reported in literature [21]. For comparison, the sample was also determined with fluorometric method. The fluorescence intensity was measured at wavelength of 393.6 nm (the excitation wavelength is 350.4nm), where it is linear to morin concentration over certain range (the figure is not shown). As result, the recovery for standards added is 92.2-97.5% and the content of morin in Glycyrrhiza is 0.16%.
4. CONCLUSIONS
Morin can cause a sensitive anodic peak at a CNTPE; the peak potential is 0.52 V in pH 2 phosphate solution. The electrode process of morin at CNTPE is irreversible and involves 2e and two protons transfer. Under the selected conditions the peak current is linear to morin concentration in the range of 5.0×10⁻⁹ to 1.0×10⁻⁷ M. The detection limit is down to 1.0×10⁻⁹ M for 60 s accumulation on
open circuit. The CNTPE can be regenerated by repeating potential scan for 5 times in a blank solution and it shows good reproducibility. The CNTPE can be used for the determination of morin in Chinese traditional medicine Glycyrrhiza.
References
1. L. E. AlcarÁz, S. E. Blanco, O. N. Puig, F. TomÁs, F. H. Ferretti, J. Theor. Biol., 205(2000)231 2. M. Cárdenas, M. Marder, V. C. Blank, L. P. Roguin, Bioorgan. Med. Chem., 14(2006)2966 3. N. D. Martini, D.R.P. Katerere, J.N. Eloff, J. Ethnopharmacol., 93(2004)207
4. D. D. Schramm, J. Bruce German, J. Nutr. Biochem., 9(1998)560 5. S. M. Liu, J. N. Li, X. Mao, Electroanalysis, 15(2003)1751
6. E. Shams, A. Babaei, M. Soltaninezhad, Anal. Chim. Acta, 501(2004)119
7. C. L. Zhou, Y. Lu, X. L. Li, C. N. Luo, Z. W. Zhang, J. M. You, Talanta, 46(1998)1531
8. F. L. Zhao, Y. T. Wang, F. F. Liu, K. A. Li, Acta Scientiarum Naturalium, Universitatis Pekinensis (in Chinese), 37(2001)741
9. Y. T. Wang, F. L. Zhao, K. A. Li, S. Y. Tong, Fresenius’ J. Anal. Chem., 364(1999)560 10. S. H. Fang, Y. C. Hou, W. C. Chang, S. L. Hsiu, P. D. L. Chao, B. L. Chiang, Life Sci., 74(2003)743
11. S. L. Hsu, C. W. Tsao, Y. C. Tsai, H. J. Ho, P. D. L. Chao, Biol. Pharm. Bull., 24(2001)967 12. W. Y. Liu, R. Guo, J. Colloid Interf. Sci., 290(2005)564
15. N. E. Zoulis, C. E. Efstathiou, Anal. Chim. Acta, 320(1996)255
16. D. Nematollahi, M. Malakzadeh, J. Electroanal. Chem., 547(2003)191
17. R. Aguilar-Sánchez, F. Áhuatl-García, M.M. Dávila-Jiménez, M.P. Elizalde-González, M.R.G. Guevara-Villa, J. Pharmaceut. Biomed. Anal., 38(2005)239
18. G. Chen, H. W. Zhang, J. N. Ye, Talanta, 53(2000)471
19. A. J. Bard, L. R. Faulkner, Electrochemical Methods, Fundamentals and Applications, Wiley & Sons, New York, (1980)595
20. R. S. Nicholson, I. Shain, Anal. Chem., 36(1964)706
21. S. H. Liao, Q. L. Tian, W. B. Wu, PTCA Part B: Chem. Anal. (in Chinese), 40(2004)140