Digital Stereo Video: display,
compression and transmission
Rhys Hawkins
A thesis submitted for the degree of
Master of Philosophy at
The Australian National University
Except where otherwise indicated, this thesis is m y own original work.
Io uJ a— ——*
Acknowledgments
I would like to thank Professor Rod Boswell and Dr Henry Gardner for giving me the op
portunity to change direction in my life. Both have made a significant contribution to my
project and have my deepest thanks.
I would also like to thank Peter Alexander for his invaluable help in his many fields of
expertise.
Abstract
Digital stereo video is a digitised stream of stereo image pairs which, when observed by a
human with binocular vision, conveys a great deal of information about a particular scene.
The main benefit over traditional digital video is that with stereo, depth in an image can be
perceived with greater accuracy.
With the growth of the Internet in the last decade, we are beginning to have enough
bandwidth for the transmission of high quality digital video across the world in near real
time. This growth is set to accelerate, and the quality and feature set of digital video will
subsequently increase. It is inevitable that the transmission of digital stereo video across the
Internet will be commonplace in the near future.
This dissertation presents several techniques that can be applied now to facilitate the
production, transmission and display of digital stereo video. The results from different im
plementations indicate that many goals can be achieved cheaply with commodity compo
nents, and more importantly, that high quality digital stereo video can be transmitted over
the Internet with bandwidth and processing power not much greater than available today.
Contents
Acknowledgments v
Abstract vii
1 Introduction 1
1.1 Overview...
1
1.2 B ackground...
2
1.2.1
Computer Graphics ...
2
1.2.2 Motion Video C o n c ep ts...
3
1.2.3 Projector Technology...
4
1.2.4 Computer N etw orks...
5
1.2.5 Human Binocular Vision...
6
1.2.6 Stereo V ideo...
8
1.2.7 Overview of the Wedge system ...
8
1.3 M otivation...
10
1.3.1
Robot Command Station P ro je c t...
10
1.3.2 Virtual Reality C ollaboration...
12
1.3.3 Investigation into alternate Virtual Reality s y s te m s ...
14
1.4 O bjectives...
14
1.4.1
Production of Stereo V id e o ...
14
1.4.2 Design and construction of the R C S ...
15
1.4.3 Stereo video com pression...
15
1.4.4 Transmission over Internet networks...
16
2 Vision 17
2.1 Introduction...
17
2.2 The Human E y e ...
17
2.3 The R e tin a ...
19
2.4 Colour v i s i o n ...
20
2.5 Temporal A spects...
23
2.6 Eye M ovements...
23
2.7 Binocular v isio n ...
24
2.8 Summary...
27
X
Contents
3 Display
29
3.1 Overview...
29
3.2 Stereoscopic display technologies...
29
3.2.1
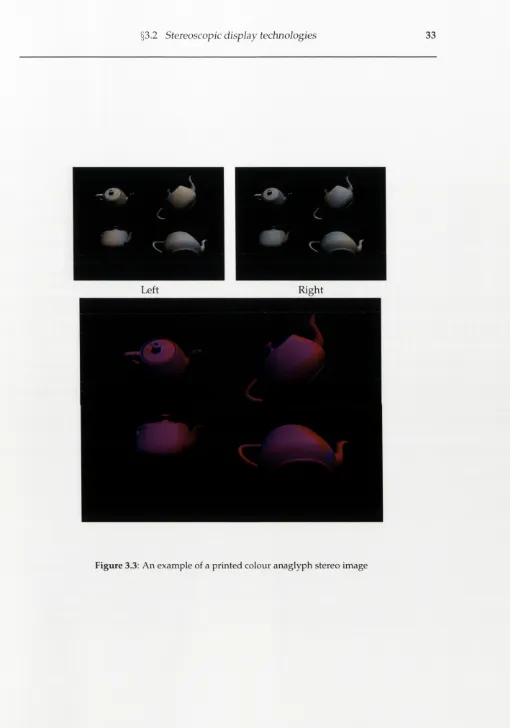
Coloured Anaglyph ...
31
3.2.2 Liquid Crystal Shutter G la sse s...
32
3.2.3 Polarising Glasses ...
35
3.2.4 Lenticular Displays...
36
3.3 The Robot Command Station P ro to ty p e...
36
3.4 Generation of demonstrations...
43
3.5 Summary...
45
4 Capture
47
4.1 Introduction...
47
4.2 Video Camera Operation...
47
4.2.1
The L e n s ...
48
4.2.2 The Sensor...
48
4.2.3 Filming C o lo u r...
49
4.3 Video Camera Capabilities...
49
4.3.1
Video Colour Processing...
51
4.3.2 Overview of different camera o u tp u ts ...
54
4.3.2.1
IEEE-1394 ...
54
4.3.2.2
C o m p o site...
55
4.3.2.3
S-V ideo...
55
4.4 Stereo Video Camera Configuration ...
56
4.4.1
The Ideal Configuration...
56
4.5 The Camera M o u n t...
59
4.6 Capturing to Computer ...
63
4.7 R e su lts...
64
4.7.1
Displaying interlaced stereo...
64
4.8 Summary...
65
5 Compression
67
5.1 Overview...
67
5.2 Data R ed u ctio n ...
67
5.2.1
Q u an tizatio n ...
68
5.2.2 Sub-sampling...
69
5.3 Existing Compression Techniques...
69
5.3.1
Generic Compression M ethods...
70
5.3.1.1
Run Length Encoding...
70
5.3.1.2 Huffman and Arithmetic C o d in g ...
70
5.3.1.3 Substitutional C om pression...
70
Contents xi
5.3.2.1 The Discrete Cosine Transform ... 71
5.3.2.2 The Wavelet T ra n sfo rm ... 76
5.4 Commercial Solutions ... 76
5.4.1 R ealN etw orks... 76
5.4.2 Q uickTim e... 77
5.4.3 Windows Media ... 78
5.4.4 Summary ... 78
5.5 Existing stereo image compression te c h n i q u e s ... 78
5.5.1 J P S ... 79
5.5.2 Interlaced G IF ... 79
5.5.3 Coloured A n a g l y p h ... 79
5.6 Proposed Stereo Compression T echniques... 79
5.6.1 D isp arity ... 79
5.6.2 D ifferencing... 80
5.6.3 S u b -sam p lin g ... 80
5.6.4 Shared C h ro m in an ce... 80
5.7 Computational S p e e d ... 80
5.7.1 J P E G ... 81
5.7.2 MPEG 2 ... 81
5.7.3 Wavelet ... 81
5.8 S u m m ary ... 82
6 T ransm ission 83 6.1 O v erv iew ... 83
6.2 The Internet Protocol S u ite ... 84
6.2.1 Network L ayers... 84
6.2.1.1 P h y sical... 84
6.2.1.2 Data L i n k ... 84
6.2.1.3 Network ... 85
6.2.1.4 T ra n s p o rt... 85
6.2.1.5 Session, Presentation, and A p p lic a tio n ... 85
6.2.2 The Sockets In terface... 85
6.2.3 The User Datagram P r o t o c o l ... 86
6.2.4 The Transmission Control P ro to co l... 86
6.3 Preliminary E xperim ents... 88
6.3.1 Transmission of JPEG using the Transmission Control Protocol . . . . 88
6.3.2 Transmission of Red-Blue Anaglyph using Web P a g e s... 89
6.3.3 Transmission of DCT compressed video using the User Datagram Pro tocol ... 90
6.4 Combined TCP/UDP Transmission ... 95
6.5 D e s i g n ... 96
xii
Contents
6.5.2 P r o t o c o l ... 99
6.5.3 Bandwidth T h r o ttlin g ... 99
6.5.4 Supported Compression M e t h o d s ... 100
6.6 R e s u l t s ... 101
6.6.1 P erfo rm an ce... 101
6.6.2 B an d w id th ... 101
6.6.3 Packet L o s s ... 101
6.7 S u m m ary ... 101
7 Discussion 105 7.1 O v erv iew ... 105
7.2 Future W o r k ... 107
A Physics of Polarisation 109 A.l O v erv iew ... 109
A.2 The Electromagnetic Plane W a v e ... 109
A.3 Polarised Light ... 110
A. 4 Polarising Filters ... I l l B OpenGL and Stereoscopic Displays 113 B. l O v erv iew ... 113
B. 2 Calculating Perspective P aram eters... 113
B.2.1 In tro d u c tio n ... 113
B.2.2 Derivation of parameters for a single display s c r e e n ... 113
B.2.2.1 The Display Screen ... 113
B.2.2.2 The V ie w e r... 114
B.2.3 The Model T ra n sfo rm a tio n ... 115
B. 2.4 The Perspective Transformation ... 116
C Stereo Camera and D isplay Geometry 119 C. l O v erv iew ... 119
C.2 The P a r a m e te r s ... 119
C.3 D erivations... 120
C. 3.1 The range of distances imaged by both c a m e r a s ... 120
C. 4 The range of distances that can be stereoscopically f u s e d ... 120
D D escription of the Stereo Video Stream ing Software 125 D. l In tro d u c tio n ... 125
D.2 Compression L ib r a r y ... 125
D. 2.1 C o m p r e s s io n ... 126
D.2.2 D e co m p ressio n ... 126
Contents xiii
Chapter 1
Introduction
Background material and various definitions are given to help the reader understand subsequent chapters. The mo tivation and objectives are given in detail.
1.1 Overview
The intent of this thesis is to investigate various aspects of the display, compression and transmission of digital stereo video. The findings of these investigations are then used in the construction of the Robot Command Station (RCS), a stereo virtual reality system for the remote control of a mobile robot.
Stereo video contains time synchronised video, from two slightly displaced viewpoints, which emulates hum an binocular vision. By using stereo video, as opposed to m ono video, it is hoped to give an observer a measure of the depth in the scene and an impression that they are actually present where the mobile robot is located. Such systems are commonly called tele-presence systems, and are the subject of much research at present. It has been claimed that operator performance is improved in such systems [23, 58,49, 52, 51].
The virtual reality system was originally planned to be based on the "Wedge" two-screen virtual reality technology. This technology had been developed locally at the A ustralian Na tional University using personal computer technology rather than high-end graphics w ork stations. As the Wedge is based on consumer technology, it is substantially cheaper than conventional virtual reality systems and has resulted in several Wedge installations over the past three years.
Hence, the initial stage in this project was the investigation into the transmission of stereo video, over the Internet, to a virtual reality display system with the express requirem ent that this stereo video should allow an operator to control a remote mobile robot. Subsequently, complex datasets, audio, and other related data can be added to enable collaborative re search.
It was also hoped that, eventually, the various technologies developed in this thesis could contribute to the linking of virtual reality stations, via the Internet, for collaborative analysis of experimental data. Such a system would enable greater collaboration between distant
2
Introduction
research institutions where complex data sets are involved.
1.2 Background
This project has m any different aspects to it, so before stating the objectives and motivations, a brief coverage of the concepts is necessary. The following sections have been kept brief as m any of the points are expanded in the following chapters or described adequately in the references.
1.2.1 Computer Graphics
Soon after the introduction of computers, graphical displays were created using hard-copy printers and later, cathode ray tubes. In m odem day computing, com puter graphics is an incredibly broad topic, bu t we limit the discussion here to a small num ber of fundamental concepts.
Two dimensional com puter graphics can be broken into two distinct categories, raster and vector graphics. In vector graphics, the image is described in terms of the objects in it and their respective param eters. Vector graphics can facilitate very high quality images which can be scaled w ithout loss of information, and are often used in typesetting where high quality is required for diagrams. One disadvantage of vector graphics is that it is often difficult and inefficient to describe real-world scenery in this manner.
Raster graphics on the other hand specifies an image by a series of picture elements (pixels) arranged into a grid. A raster image is a sampled image, w ith its resolution limited by the number of pixels in the image. When a raster image is scaled, the scaled image must be interpolated which results in a loss of information. All computer displays use raster images to display the items currently on the com puter screen, so that even vector graphics m ust be rendered into a raster image before they can be displayed.
Each pixel in a raster display is represented by a specified num ber of bits which may or m ay not contain colour information. Some common pixel representations are shown in Table 1.1. Most colour representations use the red, green, and blue tristim ulus colours to specify each pixel. This is prim arily because the most common colour display system is the cathode ray tube (CRT) which uses red, green and blue phosphor to illuminate each pixel.
For example, the True-Colour representation uses 8 bits for each tristim ulus colour giving a total of 24 bits. Each of the 8 bits is used to give a relative intensity for each of the colours, ranging from 0 to 255. On the display system, these relative intensities are mixed to give a particular colour, in m uch the same way that different quantities of paint can be mixed to achieve different colours on a canvas except that displays use transmission rather than reflection to create colour.
§1.2
Background
3Bits per Pixel
Palette Size
Colour
Common Name
1
2
Black and White
8
256
Monochrome or Greyscale
8
256
•
Pseudo-Colour
16
65536
•
Hi-Colour
24
16777216
•
True-Colour
Table 1.1:
Common Pixel Representations
number of colours, Pseudo-Colour images can be quite useful at reducing the storage size
for the image. However, for many complex real-world scenes, Pseudo-Colour images must
use colour matching or dithering which degrade the quality of the image.
1.2.2 Motion Video Concepts
When motion video first became viable, a photograph was taken several times a second on
a strip of light sensitive film. Through a chemical process, a film was made which could be
subsequently displayed by projecting light through the film onto a projection screen. It was
found very early, that for continuous motion to be perceived, approximately 24 photographs
or frames per second were required. This is due to the persistence of vision of the human
visual system which can be regarded as the rate at which the human visual system and brain
can process visual information. The minimisation of the number of frames per second gives
a considerable cost saving for the making of motion pictures.
When a motion film is displayed at 24 frames per second a high degree of flickering can
be perceived. The flickering is caused by the period of darkness between successive frames
of the film. A trivial solution to this is to display each frame twice at double the rate. In
the human visual system, a darker environment reduces the eyes ability to detect flicker.
In theatres with low light levels, the increased display frequency results in a much smaller
amount of perceived flicker. Modem theatres operate at higher frame rates to reduce the
flickering further.
With the advent of television, many similar problems were encountered. It was desired
to minimise the number of frames per second, in order to reduce the amount of bandwidth
required for the transmission of television signals. The number of frames per second in con
ventional television signals around the world varies between 25 and 30 frames per second
depending on the particular standard. High Definition Television (HDTV) doubles these
conventional frame rates through the use of digital transmission and compression.
4
Introductionquite rapidly (order of milliseconds), at 25 to 30 frames per second there is a substantial
amount of flickering.
The method employed to reduce flickering on television displays is interlacing. When
a television signal is received, each frame has a defined number of scan-lines and samples
or pixels per scan-line. Interlaced television signals have special signaling that transmits
all the even scan-lines followed by all the odd scan-lines. Hence, two separate images are
displayed for each frame, and these images are commonly called the even and odd fields.
So for normal television signals, the display rate is actually between 50 and 60 Hz, in which
little flicker can be perceived.
One of the more practical reasons for having an interlaced CRT display is that it requires
less bandwidth for higher refresh rates. This is why early computer monitors used interlac
ing, as this made various components, and therefore the entire monitor, cheaper and easier
to manufacture. The disadvantage of interlacing is that the image is often of lower qual
ity because a small amount of blank space can often be seen in between scan-lines on the
display. This can be quite disconcerting, especially on large monitors that are viewed from
relatively close range.
1.2.3 Projector Technology
Of the different projectors that are available, there are three different types which are dis
tinguished by the method that they project an image onto a projection screen: cathode ray
tube (CRT), liquid crystal display (LCD), and digital light processing (DLP) projectors. All
of these different types of projectors have their own advantages and disadvantages.
CRT projectors have three separate cathode ray tubes for each of the tristimulus colours.
An image is formed on each of the CRTs and is subsequently projected through a lens onto
a projection screen. The main problem with CRT projectors having three separate CRTs is
that these tubes have to be aligned to each other so that the image formed by the different
colours coincide on the projection screen. This means that if the projector is moved then the
three CRTs must be realigned. Whilst this is a tedious operation, it does mean that the image
formed by the projector is highly adjustable allowing greater flexibility in the configuration
of the projection system. Another side-effect of having three CRTs is that the overall size,
weight and cost of the projector increases, although this does allow the image to be brighter.
LCD projectors use reflection off or transmission through a liquid crystal display to form
an image. Since it is only necessary for one projection lens to be used, these devices are
much smaller and more portable than CRT projectors. A disadvantage of LCD projectors
is that they use polarisation of the light to control the relative intensity, so that the light
emitted from LCD projectors is linearly polarised which in turn reduces the brightness of
the projected image.
§1.2
Background 5relative intensities of the individual picture elements is controlled by the amount of time
light is reflected through the lens. A rotating colour wheel, synchronised to the DMD, is
used to provide colour to the projected image.
Both LCD and DLP projectors are designed to be portable and are quite compact. They
are usually used for desktop presentations so that the image they project is higher than the
projector. The image shape cannot be manipulated directly as it is formed in a solid state
device, whereas CRT projectors illuminate a region of phosphor. This severely limits the
positioning of LCD and DLP projectors with respect to the projection screen when distortion-
free projection is required. So while LCD and DLP projectors are cheaper and easier to setup,
they are not as flexible as CRT projectors.
1.2.4 Computer Networks
The defacto standard in computer networks is the Internet Protocol (IP)1 and its derivatives.
This protocol has existed in its present form since the early 1980s. In using the Internet as
most people do, the basic Internet Protocol is never directly encountered. This is because
this protocol is the foundation of several higher level protocols used on the Internet.
The Internet Protocol uses a 32 bit address to uniquely identify each com puter connected to the network. This is often written as four bytes, e.g. 1 5 0 . 2 0 3 . 2 0 5 . 1 2 , w here the num bers are often called the domain, sub-domain, network, and host respectively. Most people are more familiar with specifying a com puter on the Internet by nam e, e.g. www. a n u . e d u . au , and this is converted to the numerical equivalent using the Domain Name Service (DNS) application w hich uses many servers that store databases m apping Internet addresses to names.
The most common way to connect computers to facilitate communication between them
and sharing of information is via Ethernet. There are several forms of Ethernet with different
connectors, cabling and speeds. The most commonly used Ethernet system is 10-base-T
which can transmit data at 10 million bits per second, or 10 Mb/s 2.
Ethernet uses a Carrier Sense, Multiple Access, Collision Detect (CSMA/CD) protocol
at hardware level. This means that multiple computers share the same network (Multiple
Access) without a master controlling device. When a computer wishes to send data, it must
check if the network is in use (Carrier Sense). It is possible for two computers to attempt to
send a message at the same time, in which case the messages will collide. When this occurs
(Collision Detect), both computers wait a random length of time before attempting to send
their data again.
Each computer is connected to the network by an Ethernet adaptor which has a hardware
address consisting of 6 bytes. This address is called a medium access control (MAC) address
and is unique for each adaptor and therefore is used to uniquely identify each computer on
1 More correctly, the Internet Protocol version 4 (IPv4)
6
Introduction
the network. The Address Resolution Protocol (ARP) m aps an IP address to the hardw are address, and the Reverse A ddress Resolution Protocol (RARP) does the reverse. Routers are used to control the flow of messages betw een different networks, and can often provide a w ide variety of functions such as fire-walling for security. The Internet Control Message Protocol (ICMP) is used for communication between a host and a router and vice-versa. AVhile this protocol is rarely used directly (the exception is w hen networks are being tested for connectivity) it forms an im portant part of the Internet Protocol suite.
Most applications that use the Internet Protocol do not use it directly. Several higher level protocols operate using the Internet Protocol, the most common of which are the Trans mission Control Protocol (TCP), and the User Datagram Protocol (UDP). There are several examples of applications that use these protocols, the most popular of these, the World Wide Web, uses TCP for all transm ission of data.
1.2.5 Human Binocular Vision
Humans, like m any other animals, have two eyes through which they perceive objects in the world. Several reasons have been proposed as to why hum ans have two eyes, such as to increase our chance of survival by having a redundant eye, or to enable greater refinement of hand-eye coordination. However, the m ost generally accepted reason for hum ans having two eyes is that it provides an additional depth cue that facilitates spatial m apping of the external environment.
Recent physiological experim ents [53] have shown that a significant portion of the brain is solely dedicated to the processing of binocular information. The main benefit of having a second eye, closely located to its fellow eye, is that it allows us to see two separate views of the world from slightly disparate positions, as shown in Figure 1.1. The hum an visual system automatically verges the two eyes on an object of interest. Since the object of interest will be in the centre of vision of both eyes, from a geometrical point of view it will have zero disparity. Objects behind the vergence point will have a positive angular disparity or un-crossed disparity, whereas objects in front have a negative angular disparity or crossed disparity. Thus, the disparity that can be measured by the brain for different objects in a scene can be used to gauge the relative distances of these objects from the observer. The mechanism for the m easurem ent of the disparity is not fully understood. While we can show theoretically that relative distance can be discerned from the disparity as seen from the two eyes, it is also believed that the vergence of the eyes on an object of interest gives a measure of relative distance.
§1.2 Background 7
Perpendicular Bisector
Vergence Distance
Vergence Point
0
... ; ...0
Eye SeparationOptical Axis
[image:18.529.43.467.104.619.2]8 Introduction
that can be fused w ithout adjustm ent of the vergence point.
It should be noted that several depth cues can be obtained using monocular vision and it is for this reason that two dimensional displays using projector or monitor technology can be so effective. However, two dimensional images or displays are prone to illusions and depth ambiguities, the best example of these being the artw ork of Escher. For this reason, it has been found that sterescopic displays are capable of giving an observer a better impression of the environment.
1.2.6 Stereo Video
Stereo video is created using two synchronised video cameras generally located as in Fig ure 1.2. These cameras are used to em ulate the hum an eyes, and have similar properties such as separation, vergence and field of view. However, analogies with the hum an visual system are a little misleading as there are several distinct differences.
The control of the vergence in the hum an visual system is very fast and, except for ex tremely close objects, we are not aware of the exertion and relaxation of the muscles which control this movement. With a stereo camera setup, automatic adjustment of the vergence is generally very expensive as it requires specialised hardware. For this reason, the stereo cameras are more commonly fixed in place at a specified separation and vergence. The effect of fixing the vergence is to limit the range of depths that the stereo effect can be perceived.
A critical facet in the production of stereo video is the synchronisation of the video cam eras to each other. This is particularly im portant w hen objects are moving in the scene or the video cameras are in motion. If the cameras are out of synchronisation then objects in motion will have distorted vertical and horizontal disparities, and this will degrade the stereo effect.
Similarly, the exposure, zoom, and focus controls for cameras, all of which have analogies with the hum an visual system, are deficient w hen compared to the hum an visual system. This is also very im portant for stereo video production because small differences in these settings between video cameras are quite detrim ental to the perception of stereo.
1.2.7 Overview of the Wedge system
§1.2 Background 9
Perpendicular Bisector
Vergence Point
Vergence Distance
Field of View
Optical Axis
[image:20.529.43.481.145.604.2]Camera Separation
10 Introduction
reality systems.
Wedge systems have been installed at the Powerhouse Museum in Sydney and the CSIRO Discovery Centre in Canberra. These systems are used to provide informative dem onstra tions to children and the general public to give them a more entertaining introduction to various scientific disciplines. Another system has also been installed at the Australian De fence Force Academy in Canberra for the purpose of further research and development.
The developm ent of the Robot Command Station is seen as the next step in Wedge-style virtual reality systems. Although the Robot Command Station will use different technology to the present Wedge Theatres, the principles will be much the same. The prim ary difference being the size of the Robot Com m and Station, which is intended to be a desktop sized system rather than one capable of full immersion.
1.3 Motivation
This project has several very distinct areas of emphasis, each of which has its own set of goals that determine the direction of this research. There have been several outside influ ences which have shaped the objectives of this project, but they also share a great deal of commonality. It is hoped that this project will give impetus to following projects, and pro vide a solid grounding in the fundamentals of digital stereo video.
1.3.1 R obot C om m and Station Project
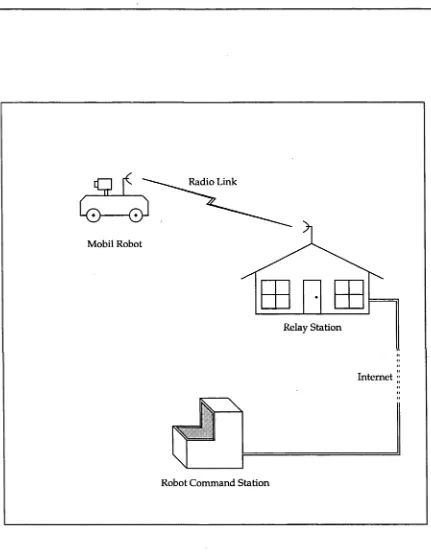
The prim e motivation for this project is the Robot Command Station Project. This is part of the Mobile Robot Project being undertaken by the Research School of Information Sciences and Engineering (RSISE) at the Australian National University. The aim of this project is to develop the infrastructure for the deployment of remote mobile robots, with the ultimate goal of being able to control a highway-speed mobile robot remotely.
The type of mobile robot was inspired to some degree from projects such as Nomad[77], and to a lesser extent, the Pathfinder mission to Mars[l]. The commonality between these projects is the control of a mobile robot from a remote station. This can only be achieved through the use of near real-time transmission of information about the environment in which the robot is currently located. The form of information that most succinctly conveys the current environment is video, with stereo video providing substantially more informa tion.
The prim ary reason for the construction of a mobile robot is that these robots are to some degree expendable, and therefore can be put into hazardous environments. Perhaps the best example of this is the recent Pathfinder mission to Mars, but some Earth-bound examples of these types of systems are extreme nuclear environment m onitoring [50], under-w ater investigation [81, 78], bomb disposal [23], military surveillance [29] and other dangerous environments.
§1.3 Motivation 11
Radio Link
Mobil Robot
Relay Station
Internet
K
Robot Command Station
[image:22.529.37.468.78.638.2]12 Introduction
station via a Radio-Ethernet bridge. The relay station is connected via a high speed link back to the Australian National University, whence the mobile robot is controlled. All of the communications are to be done using the Internet Protocol to handle the sending and receiving of information. The total bandw idth between the mobile robot and the command station is limited by the radio link, which has previously been measured at approximately 6 M b/s.
The Robot Command Station is to be the command centre for controlling the mobile robot. The initial concept involved an L-shaped table as shown in Figure 1.4. The move ment of the mobile robot was to be controlled by the use of a force-feedback haptic device, however this was deem ed inappropriate at the time and was replaced by a joystick.
The Robot Command Station was to include head tracking and a 3-D w and pointing device, and these requirem ents will be the topic of future research. The Robot Command Station was also going to use the same technology as the Wedge, that is, liquid crystal shutter glasses w ith cathode ray tube projectors. Also, there was a firm desire to investigate the use of polarising glasses due to the reduced cost of the glasses and a belief that alignment problems w ith the cathode ray tube projectors could be alleviated with different projector technology. A further benefit of using projectors other than CRT projectors is that DLP and LCD projectors are smaller and more portable.
1.3.2 Virtual Reality Collaboration
A secondary project, for which a grant application was made and subsequently rejected, was the Collaborative Virtual Reality system. With Wedge systems installed at the Australian National University in Canberra and at the Powerhouse Museum in Sydney, the project was to essentially link these two W edge's via the Internet. As part of the grant application, a Wedge system was to also be constructed at the Wollongong University, to which the other Wedge's w ould also be connected.
The intent in connecting the Wedge systems via the Internet was to perform research and developm ent into stereoscopic teleconferencing and the transmission of stereoscopic datasets and imagery via the Internet. It was hoped that such a system would enable re searchers to collaborate more freely, w ith the ability to simultaneous analyse complex three dimensional data using an advanced stereo display system. Coupled with the ability to tele conference w ith remote Universities in stereo, it was believed that such equipm ent would provide m uch needed infrastructure.
§1.3 Motivation 13
[image:24.529.72.408.169.619.2]14
Introduction1.3.3 Investigation into alternate Virtual Reality systems
The development of the Wedge system has provided many lessons in the construction of virtual reality theatres. There were two problems that were found with the Wedge systems that had been constructed to date. Firstly liquid crystal shutter glasses are quite expensive and for a system that has the potential for a large audience, the cost of the glasses alone amounts to a fair portion of the total cost. Secondly, the projectors used in the Wedge systems were CRT projectors, and alignment of these projectors is a time consuming process.
The main problem with the projectors is that each time a parameter of the Wedge changes, such as screen resolution or refresh rate, the alignment of the projectors changes and has to be readjusted. This becomes a real problem for when the Wedge must be relocated, as the alignment of the projectors constitutes a large portion of the total setup time. So due to the desire to make the Wedge system more portable, an investigation into the use of different projector technology was required.
Hence, a part of the Robot Command Station project was the investigation into a stereo scopic display using polarising glasses and DLP projectors. Polarising glasses were to be used as opposed to the more traditional liquid crystal shutter glasses to reduce cost, and DLP3 projectors were to be used in preference to CRT projectors to remove the alignment problems faced with CRT projectors.
1.4 Objectives
1.4.1 Production of Stereo Video
The focus of this project is on digital stereo video, and, as such, there is an implicit require ment to determine how to best obtain realistic stereo video. This is primarily a function of the cameras used in the production of the stereo video, and the orientation of them with respect to each other. There have been several studies into the problems associated with the production of stereo images and video [32, 33, 80] and, in general, these are theoretical and relate to perfectly behaving and adjustable cameras. In our case, we have been provided with specific video cameras, and our objective is to determine the set of parameters which give the best stereo video effect for them.
The measure of the best stereo effect is not something that can be easily quantified, and has the potential to be very subjective and vary from person to person. A set of guidelines for this measure is that the stereo video should give a good and realistic sense of depth without too great an exaggeration, and the viewing of the stereo video should not cause discomfort to the viewer.
§1.4 Objectives 15
1.4.2 Design and construction of the RCS
Given the desire to trial polarising technology for the stereoscopic display, the Robot Com m and Station will use polarising glasses, rather than the m ore familiar liquid crystal shutter glasses. In keeping w ith the Wedge systems, the Robot Com m and Station will use commer cially available equipm ent to keep the overall cost of the system relatively low.
It will be a table top system that can be comfortably view ed by a small group, although it is intended to be used by a single operator. There was a firm desire for the Robot Com m and Station to become a general purpose stereoscopic virtual reality system, rather than a purpose built stereoscopic system. So the Robot Com m and Station m ust be able to render polygonal models in three dimensions across both screens in stereo, in the same way as the Wedge. As well as this, the Robot Command Station m ust be able to show stereo video on at least one screen, in near real-time.
1.4.3 Stereo video compression
The next objective was the time effective compression of stereo video, and, in keeping with the philosophy of using only commonly available products, the compression and decom pression were not to be aided by specialised hardware. The first stage was to investigate the various commercial software packages available for the compression of video. Such packages are typically used for broadcasting video over the Internet. An investigation into w hether these products could be used for stereoscopic video was to be m ade as an initial goal.
The main purpose of the compression of the stereo video is to reduce the bandw idth of the transmitted data which allows a greater num ber of video frames to be transm itted per second, resulting in a better conveyance of information about the environment. The main restrictions on the compression method used were on the latency, that is, the time from when a particular frame is captured to when it is finally displayed on the Robot Command Station. As the controller of a mobile robot needs the video to appear essentially in real-time, the compression and decompression of the stereo video m ust not be so computationally expensive that it greatly affects the latency of the overall transm ission of the stereo video.
As stated previously, the maximum bandw idth of the link between the mobile robot and the RCS is approximately 6 M b/s. The bottleneck in this system is the Radio-Ethernet bridge, which is susceptible to fluctuations in this limit due to w eather conditions, line of sight and distance between the relay station and the mobile robot. Hence the compression of the stereo video should aim to produce a data stream that requires significantly less bandw idth. The ability to produce stereo video of reasonable quality at a bit rate of 1 M b /s is a suitable objective for the compression of video.
16
Introductionachieved is dependent on the computational cost of the compression method. This can be
seen from the fact that the time taken to compress a single frame of video is the inverse of
the maximum theoretical frame rate. Similarly, for bandwidth limited systems such as this
one, the frame rate is constrained by the average number of bits per frame. The maximum
bandwidth divided by the average number of bits per frame is also the maximum theoretical
frame rate. Hence, the frame rate achieved is dependent on several factors, and the choice of
compression method plays a very important role in the determination of the ultimate frame
rate.
A reasonable quality of stereo video must be available to an observer at the Robot Com
mand Station. The definition of reasonable quality is not one that is easily quantifiable as it
is a very subjective measurement. Although this project will not be able to control a mobile
robot at its completion, this would have been a good measure of the quality of the video. If
an operator could control a mobile robot in an obstacle course, such as in Gärtner & Schnei
der [29], then this would provide evidence that the quality was sufficient for the purpose.
While a good measure, this would not help for the future goal of providing the ability to
teleconference in stereo as this has a different set of requirements. Given the desire to be
adaptable and the lack of a quantifiable target for stereo video quality, a suitable objective is
that the compression scheme should be able to adjust the quality of the final stereo video as
seen by an observer to suit the particular application. The compression scheme should also
be capable of realistically reproducing the colour of the scene to some degree.
1.4.4 Transmission over Internet networks
Lastly, the compressed stereo video stream must be transmitted from the mobile robot to the
Robot Command Station. This is to be accomplished using existing Internet Protocols as the
low level protocol for the transmission of information. Many of the existing compression
methods are, in part, designed to be transmitted over the Internet, and there are already
several commercial packages that provide compression and Internet transmission of video.
The choice of a compression scheme plays a significant part in the transmission as it is
directly responsible for factors such as the bit rate, the format of the compressed stream and
the tolerance to corruption and partial loss of data. Hence the method of transmission over
Internet networks is closely related to the method of stereo video compression used, and
they must be considered together.
Chapter 2
Vision
A introduction to the operation o f the human eye is given, as well as the principles behind binocular vision.
2.1 Introduction
The following material is a compilation of information gained from a variety of references [55, 62,16,53,84,12, 27] concerning the hum an visual system. The display of stereo imagery relies on the ability of the hum an brain to successfully fuse the two images in order to obtain depth cues from the stereo disparity.
2.2 The Human Eye
A horizontal cross-section of the hum an eye is shown in Figure 2.1. The cornea is a thin transparent membrane through which light first enters the front of the eye. It is approxi mately a spherical section and takes up about one sixth of the eye's outer surface area. The remainder of the outer surface of the eye is the schlera, or the white of the eye. The eye over all is approximately 25mm in diameter w ith the volume prim arily being taken up w ith the
aqueous humour in the front of the eye and the vitreous humour at the rear, both of w hich have w ater as their main constituents.
The iris of the eye controls the quantity of light that passes to the sensory elements. The central aperture of the iris, through which light passes unhindered, is called the pupil. The diameter of the pupil is varied between 2mm and 8mm by the involuntary muscles.
The ability of the eye to focus on objects is due curvature of the cornea, aqueous humour, lens, and vitreous humour and their respective refractive indices. The cornea of the eye pro vides most of the pow er of the eye due to its curvature and refractive index. The flexible lens provides the ability to vary focus by the action of ciliary muscles which alter the curvature of the fore and aft surfaces of the lens. With good eyesight, objects at 15cm to infinity can be focused on by changing the shape of the lens.
The eye can sense light in the wavelengths from 380nm to 760nm. Light in the ultra-violet end of the spectrum tends to be absorbed by the cornea and the lens. Similarly, light at the
18 Vision
Temporal Side
Schlera Ciliary Muscle
Aqueous Humour Choroid
Cornea Retina
Optical Axis Fixation Axis
Fovea
Optic Nerve
Blind Spot Vitreous Humour
Nasal Side
[image:29.529.81.475.245.551.2]§2.3 The Retina 19
infra-red end of the spectrum tends to be absorbed by the aqueous humour and the vitreous humour.
At the rear of the eye is the retina, which covers the rear hemisphere of the eye. This is the component of the eye which converts the incident light into electrical impulses that can be processed by the brain. Of interest in the rear of the eye is a small indentation in the retina called the Fovea, which is the centre of vision. W hen an object is fixed upon by a person, light strikes the retina here. Approximately 16 degrees off the fixation axis towards the nasal side of the eye is the optic nerve which communicates impulses from the retina to the brain. Due to the high density of nerve fibres here, there are no sensory cells and it is therefore blind (this area of the retina is commonly called the blind spot).
2.3 The Retina
A cross-section of the retina reveals a series of layers which, for simplicity can be separated into two distinct areas, the receptors and the transducers. The receptor elements are rod and cone cells, which convert incident light into nerve impulses, whereas the transducer cells, such as the bipolar and ganglion cells, transcode the nerve im pulses before they are con veyed to the brain via the optic nerve. The boundary of the retina is the pigment epithelium which lies beyond the rod and cone cells. A high percentage of the light that reaches the retina is sensed by the receptors even though it m ust pass through several layers of trans ducer cells. In each eye, there are approximately 120 million rods, 7 million cones and only about 1 million nerve fibres linking the eye to the brain. At the periphery of vision, several rods and cones share nerve fibres whereas in the fovea, there is generally a one to one con nection between nerve fibres and receptors. This, presumably, increases the visual acuity in
the fovea.
In the centre of the fovea is a small indentation, w here the transducing cells that normally interfere w ith the light striking the sensory cells, are less inhibiting. This area, the fovea cen tralis, occupies a circular region of approximately 1mm in diam eter which is responsible for sensing the central 2 degrees of the field of vision. Hence, the ratio of rods to cones increases, as the angular displacement from the centre of the fovea increases and the properties of vi sion in the central 2 degrees of vision is governed by the properties of the cones.
wave-20 Vision
lengths below 400nm (violet) and above 600nm (orange). The regeneration of rhodopsin from fully bleached to the original reddish-purple state is an exponential process with 50 percent regeneration taking about 7 minutes. The reddish-purple state is commonly called the dark adapted state.
Given higher sensitivity of the rods in the dark adapted state, and their higher concen trations at the periphery of vision, it is evident that they are primarily for night vision and provide a low fidelity peripheral vision to detect motion. The hum an visual system has three separate stages depending up o n the intensity of light in the environment, these stages are know n as scotopic, mesopic and photopic. In scotopic vision, the light levels are too low for the cones to operate, hence vision is exclusively governed by the action of the rods. Mesopic vision is the transitory state w here both cones and rods can operate effectively. It is, how ever, a narrow region and not of much consequence. Photopic vision occurs at higher light intensities and is used for norm al daytime vision. At these light levels, the effectiveness of the rods is greatly reduced since they are bleached by the light, hence vision is prim arily gov erned by the cones, although the rods still play a part, especially in the periphery of vision. A general approxim ation is that cones will only respond to light levels above 10-3 candela m ~2, similarly, rods can respond to light levels down to 10_6candela m ~2.
Towards the centre of vision rods and cones are interspersed, and cannot be isolated to discover their individual properties. In the past 50 years there have been several investiga tions into the cone receptors which have shown that there are three types of cones, distin guished from each other by the wavelength of light they absorb strongest. The so called blue, green and red cones have their peak responses to wavelengths of approximately 440nm, 540nm and 590nm respectively.
2.4 Colour vision
Many theories have been proposed over the centuries as to how hum an colour vision oper ates, and it has only been through recent experiments that confidence in these theories has been gained. The oldest and still the most accepted theory of colour vision was first proposed by Thomas Young in 1802. His reasoning was that since the num ber of nerve pathw ays from the eye to the brain was limited, and that the triplicity of colour had no foundation in the theory of electromagnetic radiation, the eye therefore has three separate signalling m ech anisms which respond to red, green and blue. Herman von Helmholtz showed that m ore than three prim ary colours were required to match some colours exactly which was contrary to Young's theory and led to its rejection for m any years.
§2.4 Colour vision 21
receptors has been found.
Ewald Hering, at the begining of the 20th century, discovered that some colours tended to cancel each other out, for example, red cancels green and blue cancels yellow. Hering sub sequently postulated that there were indeed three different receptors in the eye, however, rather than responding to red, green and blue, they respond to red versus green, yellow ver sus blue and w hite versus black. This theory became known as the Hering O pponent Colour theory and was the most accepted theory in opposition to that of the Young-Helmholtz the ory.
The ability to perform electrical analysis of the process of seeing has provided great in sight into the operation of the eye, and in particular, communication between the eye and brain. These analyses have provided much understanding of how the hum an colour vision system works and its limitations. A reconstruction of the results obtained by Arakawa [6] is shown in Figure 2.2. These graphs show that colour vision extends from the centre of the field of view to about 50 to 60 degrees either side, which corresponds to approximately 100 degrees of the entire 180 degree field of view. Naturally, as the density of cones decreases proportionally w ith angular distance from the fovea, the colour acuity also decreases, and this can be seen from the abrupt decrease in response to different wavelengths as soon as the incident light moves away from the fovea.
Whilst there is evidence that there are indeed three types of cones as predicted by the Young-Helmholtz theory, arguably the most interesting result from electrical analysis is that early analysis of the retina of fish showed that certain cells gave potentials that became more negative for increasingly blue light, and more positive for increasingly yellow light. Other cells were also found to respond in a similar manner for red versus green light. This exper iment was repeated on the macaque monkey which has a colour vision system that more closely resembles that of humans. Similarly, cells were found which produced spike poten tials that increase the rate of firing depending on whether red versus green, or yellow versus blue light is incident upon them. Such cells are called opponent cells, and conversely there exist non-oponent cells that respond proportionally with luminosity.
22 Vision
1 i i i i i i r
E
-80 -60 -40 -20 0 20 40 60 80
-80 -60 -40 -20 0 20 40 60 80
[image:33.529.80.514.168.574.2]Degrees from Centre of Vision
§2.5 Temporal Aspects 23
2.5 Temporal Aspects
The coding of luminosity as potential spikes, where the frequency of the spikes is a measure of the intensity of the light (higher frequencies correspond to higher intensities), has several interesting side effects. Firstly, it takes approximately 10ms for a light stim ulus to be per ceived, and similarly the stimulus is still perceived a short period after it has gone, this is know n as the persistence of vision. An im portant consequence of this persistence is that, at high enough frequencies, a flickering light stim ulus will appear to have constant brightness. The point at which this occurs is called the flicker fusion frequency, which has been found to vary with the logarithm of the luminance to which the eye has adapted. An emperical formula which gives an approximation for the frequency is the Ferry-Porter law:
f c = a log10 L + b (2.1)
where L is the luminance to which the eye has adapted, and a and b are empirically derived constants. This frequency varies from about 10 Hz at low luminance levels to a m aximum of approximately 55 Hz. The application of this fact can be seen in the engineering of several devices. For example, fluorescent lights flicker at 100Hz when operated from a 50Hz supply (incandescent bulbs emit light via black body radiation and do not flicker). Movies are filmed at 24 frames per second, and at a cinema, each frame is shown twice to increase the flicker frequency to 48Hz. Television has 25 or 30 frames per second, depending on the particular broadcast standard, where each frame is split into two fields which can be interlaced back into a frame. Fields are shown sequentially (frame interlaced) so that, like cinema, the flicker frequency is doubled. Com puter monitors generally refresh the screen at m uch higher frequencies, 60 to 100 Hz, and this is primarily because they are typically used in bright office environments, w hen the ability of humans to perceive flickering is highest.
2.6 Eye M ovements
The orientation of the eye is controlled by six muscles that allow the eye to tilt up and down, pan left and right, and rotate about the fixation axis in either direction. There are several involuntary movements which prevent the eye from being able to fixate on a point for a long time. These m ovements are called tremors, saccades, and drift. The tremors have a frequency of approximately 50 Hz and an am plitude of less than 1 m inute of arc. The saccades occur approximately once a second and the fixation point moves up to 5 minutes of arc at high speed. Lastly, the fixation point tends to drift in between saccades, and this is probably due to the tremors. It has been shown through experiment that if an image is fixed on the retina, after a few seconds pattern and colour grey out and only a dim uniform field is seen. From these experiments, it has been theorized that the involuntary movements are responsible for limiting fatigue or enhancing contrast in the eye.
24 Vision
rotation of the eyes has been shown to counter rotations of the head, where a rotation of the head of 45 degrees results in a rotation of the eye of about 37 degrees. However, studies have also shown w ith rotated stereograms, that the eyes are also rotated to better accomodate the disparate images. Indeed, when viewing a stereo scene, the fixation point of each eye is changing constantly, including the vergence of the eyes, thus the scene is continuously scanned.
2.7 Binocular vision
Not a great deal is known about how depth is perceived from the two uniocular images that are sensed by the eyes. The optic nerves from each of the eyes remain separated until they fuse in the striate area of the brain. It is assum ed that this is the centre for binocular disparity processing. The discussion of hum an binocular vision will be limited to definitions, basic functions, and limitations.
Before discussing the fusion of two uniocular images, it is worthwhile to consider other depth cues which feature in hum an vision that can be gained from monocular vision and learned experience, as given by Helmholtz:
1. Judgem ent of distance from the size of the retinal image of objects whose approximate size is known, such as men and cattle.
2. The apparent converging of parallel lines in perspective as they recede.
3. The overlapping of one contour by another w hen a more distant object is partially concealed by another.
4. Clues given by shadows.
5. Aerial perspective or the softening of outline and colour changes of distant objects due to the atmosphere.
A common thread of thought is that binocular vision, rather than giving a quantitative sense of depth, enables an observer to judge the relative depths of objects in a scene, and thus construct a 3-Dimensional mental m odel of the current environment.
The two disparate images sensed by the left and right eyes are stereoscopically fused so that in general, we only perceive one image of the world, albeit, that image contains additional stereopsis 1 information. There are, of course, limits to this fusion process and these are governed prim arily by past experience providing conflicting depth cues and a limit on the am ount of angular disparity that can be fused. W hen fusion fails, one of two things occur. Two ghost images of the object that cannot be fused are seen, which is know n as
diplopia. Alternatively, the image received from one of the eyes is suppressed or blended
§2.7 Binocular vision 25
in preference for the other eye. This is called binocular rivalry, or sometimes eye dominance.
Sometimes this phenom enom oscillates between left and right eyes w ith a period of 1—5 seconds.
The angular areas w ithin which stereoscopic fusion is possible are called Panum 's fu- sional areas. The limiting angular disparities are commonly known as the diplopia thresh old. The accuracy of the m easurem ent of Panum 's area is not high due to wide discrepancies between experimental results. Figures quoted by Davson [21] give the value of 3 to 4 minutes of arc for vertical disparities and 5 to 26 minutes of arc for horizontal disparities. A more recent study, [25], showed that the diplopia threshold varies significantly between people and that training and various other factors greatly influence the threshold. A study, [83], with perhaps more relevance to this project showed that in stereoscopic colour displays, the limits of fusion were:
• 27.1 m inutes of arc for crossed disparity, and
• 24.3 m inutes of arc for un-crossed disparity.
These figures provide a useful reference later for measurements taken using stereoscopic display equipm ent. It should be noted that these measurements were taken for a stim ulus whose duration was 200ms, which is believed to circumvent the verging of the eyes to acco modate greater disparities. The results obtained from the same study using a stim ulus w ith a duration of 2 s were:
• 4.93 degrees of arc for crossed disparity, and
• 1.57 degrees of arc for un-crossed disparity.
The figures for the 200 ms stim ulus can be thought of as the maximum disparity from the current vergence point that can be stereoscopically fused. Disparities of angles greater than these m ust be scanned by an observer by adjusting their vergence. On the opposite side of the scale, Regan et al [62] quotes the minimum observable disparity as 2 seconds of arc for the best observers.
The hum an binocular vision system can also tolerate some degree of vertical disparity. Presumably this in cooperation w ith the rotation of the eyes enables depth perception w hen the head is tilted. In Duwaer et al [25], vertical disparities of between 1.2 and 19 m inutes of arc could be stereoscopically fused, depending on the observer. This has some im portant ramifications for both the display system and the camera setup as will be explained later.
The rotation of the eyes about the optical axis can also play a part in the stereoscopic fusion of two uniocular images. It is possible to stereoscopically fuse a stereo image pair rotated slightly w ith respect to each other, albeit w ith some effort. While this is not conclu sive proof that the eyes are rotated, it implies that some rotation operation is applied to the images, either of the eye or in the brain.
26
Vision
objects w ith high reflectance whose intensity can vary greatly w ith a small change in the viewing angle.
The last factor of importance, especially for stereoscopic display systems, is interocular cross-talk. In fact, this phenom enon is strictly restricted to stereoscopic display systems, which are sub-optimal. The projection of two uniocular images into separate eyes gener ally involves some degree of cross-talk, where some fraction of the image for the left eye is perceived in the right eye and visa-versa. The common result of this is the perception of "ghosting", particularly about high contrast edges. A study [83] using liquid crystal shut ter glass (described in a later section) found that extinction ratios 2 between 11:1 and 17:1 did not greatly effect fusional thresholds, nor estimation of depth. However, it was also found that increased levels of interocular cross-talk decreased the subjective ratings on qual ity and comfort in the fusion of the stereo images. This seems to indicate that the observer is required to exert greater effort in accomodating stereo imagery as levels of interoccular crosstalk increase.
As can be seen from these studies, the hum an binocular vision system is flexible and able to adapt to differences in two uniocular images, where some of these differences are not related to stereoscopic disparity. It is im portant though, to realise that binocular vision cannot give a quantitative measure of depth, but allows the perception of the relative depths of objects in a scene. Past experience and acquired knowledge give depth information that is used in conjunction w ith the stereopsis of the scene to provide the brain w ith a spatial representation of the environment in front of an observer. Hence, binocular vision requires other factors to give the information it contains a reference point. It should also be noted that monocular depth cues are given greater credence than binocular disparity, as is evidenced by the occurance of diplopia when monocular depth cues contradict w ith the binocular dis parity of a scene.
While this discussion has concentrated on the ability of binocular vision to provide depth information, other properties of hum an binocular vision have been neglected. Binocular vision has somewhat higher acuity than monocular vision, and it is believed that this is caused by some process in the brain that perform s a form of averaging betw een the eyes to improve acuity. It is believed that the constant tremor and saccades of the fixation point of the eyes, performs a similar process, since the blind spot of the eye is not perceived in either monocular or binocular vision except in rare circumstances. This averaging process prom pted some theories that binocular vision gives hum ans a greater chance for survival, in that damage to portions, or the entirety of one eye can to some degree be replaced by the use of the fellow eye.
Extinction ratio here is defined as the ratio of luminance for the correct eye to luminance for the fellow eye: Extinction ratio = : 1.
§2.8
Summary
27
2.8 Summary
The following features of the human visual system are of interest in the design of stereo
scopic display systems:
• up to 2 minutes of arc of disparity can be accomodated without the need for the eyes
of a subject to be verged,
• a small degree of vertical disparity and rotation of two uniocular images can be toler
ated,
Chapter 3
Display
The options available for the construction of the Robot Com mand Station are discussed. The final concept of the Robot Command Station is described, and the results of the con struction of a prototype are given.
3.1 Overview
The display of stereo images is not a new technology, it has been available in m any forms for several decades, but recent advances in stereo display technology has boosted its popularity. There are, however, some problems with stereo displays, in that they tend to cause fatigue in viewers who use them for long periods of time.
3.2 Stereoscopic display technologies
Present methods for the display of stereo imagery have m any principles in common. The requirement is to project, into each eye of a viewer, two uniocular images whilst limiting the am ount of interocular crosstalk. This is generally accomplished by projecting two images onto a projection screen or displaying two images on a monitor, and using filters or optics to direct the correct image to the desired eye.
As shown in Figure 3.1, an observer standing at some distance in front of the projection screen or monitor perceives different images in each eye. If we consider the image of a sphere placed between the observer and the screen, the projection of the sphere as seen by the observer will have a certain am ount of crossed disparity (see Figure 3.1a). Similarly, if the sphere is placed behind the screen, then the projection of the object onto the screen has an uncrossed disparity relative to distance away from the screen (see Figure 3.1b). This means that virtual objects in the plane of the screen will have zero disparity. An interesting thing to note is that if the display is set up to provide a true to scale representation of the w orld, then the maximum uncrossed disparity will be the distance betw een the observer's eyes. This can be seen from the fact that as an object moves further behind the screen, the projection lines from the object to the left and right eyes of the observer become more parallel, the limit at a
30 D isplay
Right Image Left Image
Screen
Sphere
Sphere
Left Image Right Image
Screen
0 6
Observers Eyes Observers Eyes
Figure 3.1: The disparity in stereo displays


![Figure 2.1: A horizontal section view of the human eye through the meridian [16]](https://thumb-us.123doks.com/thumbv2/123dok_us/1948104.155158/29.529.81.475.245.551/figure-horizontal-section-view-human-eye-meridian.webp)