A pilot study of road lighting, cycle
lighting and obstacle detection
S FotiosPhD,H QasemBArch,C ChealPhD andJ Uttley BSc School of Architecture, University of Sheffield, Sheffield, UK
Received 30 September 2015; Revised 26 November 2015; Accepted 9 December 2015
This paper investigates cyclists’ detection of an obstacle on the surface of the road ahead, observed in peripheral vision, and how this is affected by variations in light level from road and cycle lighting. The data analysed were the height at which a rising obstacle was detected, this simulating an approaching irregularity in the road surface. The results suggest that when cycling on a lit road, cycle lighting frequently offers no benefit for peripheral detection and may make it worse. It was demonstrated that position matters: At low illuminances, a hub-mounted lamp improved detection over a handlebar-mounted lamp. This benefit was sufficient to offset the reduction in detection found when decreasing road lighting from 2.0 lux to 0.2 lux.
1. Introduction
Obstacle detection is a critical visual task for pedestrians1–3 and we suspect it is a critical task also for cyclists. Road lighting must provide for adequate obstacle detection as a countermeasure to cycling accidents in add-ition to enhancing the visibility of cyclists to other road users.4Potential obstacles include uneven surfaces (e.g. a raised paving slab or manhole cover, potholes) and objects on the road that may cause a cyclist to fall from their bicycle or to suddenly swerve to avoid the obstacle if not anticipated in sufficient time to take safe avoiding action. Because cyclists are located on the road adjacent to motor vehicles, the consequences of falling or swer-ving are likely to be more serious than for pedestrians on the footpath.
Before investigating the effect of changes in lighting on cyclists’ visual needs, it would be useful to study what it is they desire look at for safe movement – for example by using
eye-tracking. This was recently done for pedestrians, using a dual task to identify fixations at critical moments2 and to estimate the distance and duration for which pedes-trians desire to carry out these fixations.5Eye tracking studies used to investigate cyclists’ visual behaviour have tended to use artificial settings such as watching a video6 and artifi-cial, straight lanes marked out in a gymna-sium.7 For pedestrians, natural settings and videos lead to different gaze allocation8 and the same is expected for cyclists. Vansteenkiste
et al.9studied the visual gaze behaviour of five cyclists along a city centre route and found a greater proportion of gazes were toward the road surface when the surface quality was low than when it was high, suggesting that detec-tion of potential obstacles was an important task. However, they did not employ a dual task or similar to distinguish critical fixations from all gaze fixations. Thus, there are cur-rently insufficient data regarding the visual fixations of cyclists in natural settings.
This paper reports three pilot studies carried out to explore how road lighting and bicycle-mounted lighting affect the ability to detect an obstacle located ahead but in Address for correspondence: S Fotios, School of Architecture,
The University of Sheffield, Arts Tower, Western Bank, Sheffield S10 2TN, UK.
peripheral vision. We anticipate this is a critical visual task for cyclists but that remains to be confirmed. We investigated detection in peripheral vision10 where the capability of the eye is mainly determined by contrast sensitiv-ity.11 The contrast between the luminance of the sides of a raised obstacle and that of the top surface and the surrounding floor surface will vary with the direction of light. For cyclists, this light may come from two sources – the road lighting and cycle-mounted lighting. This work considered three levels (illumin-ances) of road lighting but did not consider the spectral power distribution (SPD) or the uni-formity of this lighting. It also considered cycle lighting of different luminance and mounting position. In Experiment 1, we investigated obstacle detection using a handlebar mounted lamp at three luminances. In Experiment 2, the cycle lamp was set to only one luminance, the middle of the three used in Experiment 1, but was located at three vertical heights equivalent to the cyclist’s helmet, the handlebars and the wheel hub. These results suggested a benefit of hub-mounted lighting and hence in Experiment 3, we repeated Experiment 1 but with the cycle lamp mounted at the wheel hub.
We first report below the apparatus and the general method used in the three experi-ments, and then the conditions and results of the three experiments in turn.
2. Method
2.1. Apparatus
Obstacle detection was tested using the apparatus shown in Figure 1 which was previously used to investigate obstacle detec-tion for pedestrians.12 It is a chamber that is open on one side – where the participant was located – and lit from two overhead arrays of LEDs. The chamber has a raised floor con-taining cylinders which can be raised above the surface using electric motors to simulate obstacles. The chamber is of dimensions 2.4 m wide, 2.4 m high and 3.8 m long, with walls covered in black cotton cloth on three of the sides and open at the fourth side. The false floor was made from medium density fibre board and painted in Munsell N5 grey paint (reflectance¼0.2).
A static bicycle was placed at the open end of the chamber and during trials participants sat upon this cycle to replicate the head and
Video projector
LED luminaires
Foveal fixation
Screen to block sight of luminaires and projector
Mirror, moved by servo motors
Bicycle LED (Three positions)
LED
luminaires Obstacle
Apparatus Floor
Bicycle LED
Bicycle LED horizontal post mount
Participant
Cycling device Rollers
Cycling device
Rollers Obstacle (raised)
from apparatus Floor
Fixation target
[image:2.536.55.481.429.609.2]Peripheral detection
eye posture of a cyclist. To allow pedalling the bicycle was mounted on rollers, but for safety it was held upright using a frame. During trials, participants were instructed to pedal to simulate the cognitive demand of pedalling. To encourage pedalling at a reasonable speed, an alarm sounded if the rotational speed dropped below 50 revolutions per minute or above 80 revolutions per minute.
This experiment used one obstacle cylinder located at the centre of the false floor, 200 mm in diameter. This was normally flush with the surrounding floor but could be raised to one of seven heights (0.5 mm, 2.8 mm, 4.5 mm, 7.1 mm, 11.3 mm, 17.9 mm and 28.4 mm) to simulate an obstacle. The smallest height (0.5 mm) was used as a control condition as it was a height for which the detection probability was expected to approach zero. This was done in order to check for false positive responses. The sides and top of the obstacle were painted in the same grey paint as used for the rest of the surrounding surfaces. The centre of the obstacle was positioned 1.2 m from the far wall and approximately 2.6 m from the participant’s position on the cycle, giving an eye to obstacle distance of approximately 3 m. At this distance and for an eye level of 1.75 m, the obstacle subtended a width of 3.658 and height of 0.438 at the participant’s eyes at the maximum height used in this experiment (28.4 mm). Each of the seven obstacle heights was presented at two rising speeds (1.0 mm/s and 2.0 mm/s) giving 14 trials per lighting condition. The order in which these 14 trials took place was randomised for each lighting condition. Following analysis in previous work12 of the effect of obstacle rising speed, the current analysis used the average response across the two rising speeds.
Participants indicated detection by pressing a hand-held response button. If detection occurred before the obstacle reached its max-imum height, it would immediately return to lie flush with the surrounding surface, the home position, and a successful detection would be recorded. If the obstacle reached its
maximum height without the button being pressed, it would remain at this height for 2 s, or until the button was pressed (whichever was sooner), before returning to the home position. If the button was pressed within this 2 s period, a detection was recorded, but if not a miss was recorded. For the control condi-tion (0.5 mm obstacle height), the exposure time at maximum height was increased to 8 s, this representing the typical average time of other trials, including random time interval and time to reach and remain at the max-imum height. The 8 s control condition would capture false positive responses from guessing or pressing the response button randomly.
maintain foveal fixation on the fixation mark, thereby better ensuring peripheral vision was used for the obstacle detection task.13
The test area was lit from above by two identical arrays of LEDs as shown in Figure 1, simulating overhead road lighting. Each LED array contained six clusters of four types of LED, red, green, blue and amber. The control system allowed the intensity of each type of LED to be independently modulated, thus allowing a wide range of unique spectra to be set. The illuminance provided by these arrays was varied but only one SPD was used (S/P¼1.6, x¼0.46, y¼0.42). The SPD is shown in Figure 2. Tests were carried out under three horizontal illuminances, 0.2 lux, 2.0 lux and 20.0 lux, as measured at the centre of the obstacle, and a fourth condition in which the LED array was switched off. These illuminances bracket the illuminances recom-mended in UK road lighting guidelines14 and follow those used in previous peripheral detec-tion studies12,15,16to enable comparison.
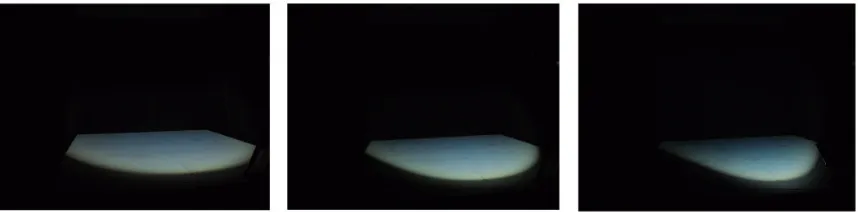
A second light source simulated a forward-facing bicycle-mounted lamp (LED Lenser model H14R.2). The bicycle lamp introduces many additional variables: mounting location on the bicycle, beam angle and direction, luminance and SPD, and careful consideration
of these may lead to improved lamp design.17 In this experiment, we investigated two vari-ables – mounting height and luminance. The three mounting positions were the wheel hub, handlebar or cyclists’ helmet, these giving heights above ground level as shown in Table 1. These positions were in a single vertical line, 1370 mm from the obstacle centre, at the centre line of the bicycle. At the three locations, the lamp was aimed so that the obs-tacle was approximately in the centre of the beam, with the leading edge at the same position. The beam patterns are shown in Figure 3. For luminance, the lamp was either switched off or set to 0.1 cd/m2, 0.32 cd/m2and 1.0 cd/m2as measured on the side of the raised obstacle facing the observer. This dimming was achieved using the lamp’s built-in control, with a neutral density filter (25% light trans-mission) placed directly in front of the lamp at all times to reduce its light output. A fibre optic cable located in the periphery of the beam, light sensor (TSL2591 and Arduino microcontroller) allowed accurate adjustment to predetermined intensities and corresponding to luminances of the obstacle side, and moni-toring/logging of the intensity during trials. The SPD is shown in Figure 2. The cycle lamp spectrum had a correlated colour temperature of 6500 K, a general colour rendering index of Ra¼75 and a S/P ratio of 2.1. Tables A1 to A3 in Appendix A show luminances measured on the top and front surfaces of the raised obstacle and of the floor immediately in front of the obstacle – for all test conditions.
In this work, illuminance is used to quantify the amount of road lighting since illuminance
1.0
Cycle lamp
LED array representing road lighting
0.9 0.8 0.7 0.6 0.5 0.4 0.3 0.2 0.1 0.0
350 450 550 Wavelength (nm)
Relative power
[image:4.536.52.256.454.592.2]650 750
Figure 2 Spectral power distributions (normalised to a
peak response of unity) for the LED array simulating overhead road lighting and for the cycle-mounted lamp
Table 1 Description of mounting positions of the bicycle
lamp
Location Height of lamp above floor (mm)
Beam direction
Handlebar 1370 208below horizontal Helmet 1830 358below horizontal
[image:4.536.273.489.563.626.2]is the quantity specified in guidance.14 Luminance is used to describe the amount of light from the cycle lamp to assist recognition of which light source is being referred to.
Three experiments were carried out, each using 10 participants, and these were paid a small fee as an incentive. The 30 test partici-pants included 12 males, 18 females, and their ages ranged from 18 to 36 years with an overall estimated mean age of 26 years; 13 participants wore their normal corrective lenses.
2.2. Procedure
Initially, normal vision was confirmed using a Landolt ring acuity chart and the Ishihara test for colour blindness. A 20-minute period allowed for dark adaptation; during this time, the test procedure was explained and partici-pants were given time to become accustomed to pedalling the bicycle.
A practice session was included to introduce the fixation task and the obstacle detection task (pressing the response button if they noticed a raised obstacle). This practice session intro-duced progressive levels of difficulty to the tasks to ensure participants became used to them and were able to complete them satisfactorily. For instance, the fixation target was static to begin with and positioned at the narrowest vertical visual angle with the obstacle.
In trials, participants were instructed to fixate upon the fixation target, stating aloud
any digits that appeared, whilst pedalling and pressing the response button if they detected a raised obstacle. To encourage participants to maintain foveal gaze on the moving fixation target, the experimenter stated that the fixation target task should be their primary focus.
For each lighting condition, a period of approximately 3 minutes was required to complete the 14 detection trials. If the par-ticipant requested a break or if four consecu-tive conditions had been completed, a short rest period was taken (approximately 3 min-utes to 4 minmin-utes) until the participant was ready to resume.
Experiment 1 examined variations in road lighting and cycle lighting luminances but the cycle light was retained in only one position, mounted on the handlebar, this being a common location for bicycle lamps. The 10 test participants (six male, four female, aged 18 years to 36 years, mean 27 years, four wore corrective lenses), each completed trials under the 16 conditions (four road lighting illumin-ances, four bicycle light luminances) in a random order within a single 2-hour test session. Experiment 2 examined the effect of vary-ing the location of the cycle lamp (change in vertical height) and did so with only one bicycle light luminance – 0.32 cd/m2 – the
middle of the three settings used in
[image:5.536.56.485.497.603.2]Experiment 1. The four road lighting illumin-ances were retained (off, 0.2 lux, 2.0 lux and 20 lux). The three vertical positions of the
Figure 3 Beam pattern on the floor surface ahead of the cyclists when the cycle-mounted lamp was located at the
cycle lamp were equivalent to the cyclist’s helmet – the handlebars and the wheel hub. The 10 test participants (two male, eight female; aged 19 to 36 years, mean age 27 years, three wore corrective lenses), each completed trials under all 12 conditions in a random order.
The results of Experiments 1 and 2 were analysed to devise a hypothesis to be tested in Experiment 3. Initially, a small number of conditions were chosen to confirm the appar-ent benefit of the hub-mounted bicycle lamp over a handlebar or helmet mounted lamp – in terms of increasing obstacle detection rate – with further conditions included to replicate for internal validation conditions used in Experiments 1 and 2. These conditions fell into a repeat of Experiment 1 but with the bicycle lamp mounted on the wheel hub rather than the handlebar and hence this is what was done. Thus, Experiment 3 examined variations in road lighting and cycle lighting luminances with the cycle light mounted on the wheel hub. The 10 test participants (four male, six female; aged 18 to 35 years, mean 24 years, six wore corrective lenses), each carried out trials under all 16 conditions (four LED illuminances, four bicycle light luminance) in a random order.
3. Results
3.1. Fixation target identification
The fixation cross changed to a number at random intervals during trials, and in each test condition, this occurred 40 times on average. Test participants were required to read aloud these numbers to provide a meas-ure of their focus on the fixation target. The overall rate of correct identification across all experiments was 88% (standard deviation 4.2 %), this being 91%, 90% and 84% in Experiments 1, 2 and 3, respectively. We conclude from this that participants were tending to direct their gaze towards the fixation mark as instructed and thus that the obstacle tended to lie in peripheral vision.
3.2. Validation conditions
[image:6.536.48.490.461.585.2]Two conditions were included to provide some measure of validation. These were no-light trials, i.e. tests carried out in the absence of road and cycle lighting (Experiments 1 and 3) and trials in all conditions with the smallest (0.5 mm) obstacle: In both cases, a low rate of detection is expected and a high detection rate would indicate false positives (e.g. random pressing of the detection button).
Table 2 Summary of results of validation conditions
Exp. no. No-light trials 0.2 lux trials Detection rate***
Detection rate*
Detection height**
Detection rate*
Detection height**
0.5 mm obstacle
2.8 mm obstacle
1 0.043 25.1 mm 0.51 6.65 mm 0.12 0.36
(6/140 trials) (range 20.6 to 26.0 mm, n¼4)
(71/140 trials) (range 5.0 to 11.2 mm, n¼16)
(37/300 trials) (108/300 trials)
2 – – – – 0.18 0.45
(44/240 trials) (109/240 trials)
3 0.10 22.3 mm 0.69 5.32 mm 0.18 0.69
(14/140 trials) (range 18.4 mm to 28.4 mm, n¼8)
(97/140 trials) (range 2.8 to 14.4 mm, n¼20)
(54/300 trials) (208/300 trials)
*Detection rate: Proportion of trials with all seven obstacle heights that were detected.
The results of these trials are shown in Table 2. For the no-light trials, detection probability was 0.07 across Experiments 1 and 3 and the 28.4 mm obstacle needed to reach a median height of over 22 mm to be detected. For comparison, Table 2 shows also the results of trials when the road lighting was set to its lowest level – 0.2 lux: The detection probability increased to 0.6 and the median detection height of the 28.4 mm obstacle decreased to approximately 6 mm. The large difference in detection responses between these two conditions suggests that test participants did not tend to make false alarm responses. That in a very small number of trials, test participants were able to detect a target during these no-light trials suggests the presence of some stray light – for example scattered light from the projected fixation mark. Detection probability for the 0.5 mm obs-tacle height was expected to be much lower than for the higher obstacle heights. The 0.5 mm obstacle was detected in 135 of the 840 occasions it was presented across the three experiments – a detection probability of 0.16. Compared with the next smallest obs-tacle in the range (2.8 mm) which had an overall detection probability of 0.51 across the three experiments, the 0.5 mm target was detected on relatively few occasions – again suggesting that test participants did not tend to make false alarm responses.
3.3. Experiment 1
Experiment 1 examined 16 light combin-ations (four LED illuminances, four bicycle light luminances) – with the bicycle lamp at the handlebar position. There are two approaches to examining the results, the detection probability for obstacles of different size and the height at which the largest obstacle (28.4 mm) was detected (detection height). In previous work, it was demon-strated that the results from both approaches converged.12 Therefore, we use here only the
height at which the largest obstacle was detected as the measure of detection ability.
Analysis of normality was carried out using a range of statistical and graphical measures (central tendency, distribution, Kolmogorov-Smirnov and Shapiro-Wilks). It was concluded that these data (and also for Experiments 2 and 3) were not drawn from a normally distributed population. Statistical analyses were therefore carried out using non-parametric statistical tests for repeated measures data.
Figure 4 and Table 3 show the median detection height for each test condition. Consider the curve for road lighting only (i.e. cycle lamp switched off): this shows that higher illuminance allows smaller obstacles to be seen and displays a trend similar to that found in previous work.12,15,16 At all three illuminances, there is no benefit in switching on the cycle lamp – obstacle detection was not improved. At low road light illuminance, there is a clear difference between the three cycle light lumi-nances, but at high road light illuminance, this difference disappears. For the lowest cycle light luminance, there is a steady improvement in obstacle detection as road light illuminance increases. However, for the two higher cycle light luminances, obstacle detection first decreases and then increases – indicating that contrast reversal has affected detection.
Here we analyse the data for 15 of the 16 test conditions, i.e. ignoring results from those trials with no road or cycle lighting. Using the Friedman test to compare these 15 conditions suggests that changes in road and cycle lighting had a significant effect (p50.001). For analyses where multiple appli-cation of statistical testing was used, we retained the standard threshold of p0.05 to indicate significant effects and did not make adjustments to this18 but instead drew conclusions as to significance by considering the overall pattern of results rather than placing emphasis on any single test.
level give a significant increase in detection (p50.05) but an increase above 2.0 lux does not have significant effect. Switching on the cycle lamp did not increase detection, regard-less of the luminance it was set to. With 2.0 lux road lighting, the addition of cycle lighting of any luminance significantly decreased detection performance (p50.05). At 0.2 lux and 20 lux, adding cycle lighting either makes no significant difference or leads to a significant decrease.
3.4. Experiment 2
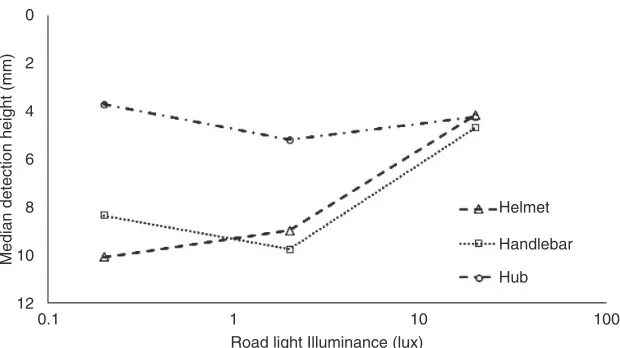
Experiment 2 examined 12 lighting com-binations comprising four road lighting illu-minances, one bicycle light luminance (0.32 cd/m2) and three cycle light positions resembling the helmet, handlebar and hub positions on a bicycle. The aim of this experiment was to determine whether the mounting position of a given cycle lamp would affect detection. The results are shown in Figure 5 and Table 4.
Figure 5 suggests that at lower road light-ing, illuminances detection is best for the hub-mounted cycle lamp and poorest for the helmet-mounted lamp. At the highest road light levels, this difference disappears. The Friedman test suggests that mounting positon has a significant effect (p50.01) for two cases, when the road lighting is switched off or set to the lower illuminance (0.2 lux), but does not suggest a significant effect at the higher illuminances (2.0 lux, 20 lux). This conclusion is confirmed using the Wilcoxon test for each pair of possible mounting locations. At zero or 0.2 lux, detection is best for the hub-mounted lamp and poorest for the helmet-mounted lamp. At 2.0 lux and 20 lux, a change in
0
2
4
6
8
10
12
0.1 1 10
Road light Illuminance (lux)
Median detection height (mm)
Cycle lamp off Cycle 0.1 cd/m2 Cycle 0.32 cd/m2 Cycle 1.0 cd/m2
[image:8.536.113.430.69.247.2]100
Figure 4 Results of Experiment 1: Median detection height (for 28.4 mm height) plotted against illuminance for four
[image:8.536.47.262.330.435.2]cycle lamp conditions. The bicycle light was located on the handlebar for all trials
Table 3 Results of Experiment 1: Median detection
height (for 28.4 mm obstacle) for each combination of road light illuminance and cycle light luminance.
Road LED illuminance (lux)
Detection height (mm) of 28.4 (mm) obstacle height under the given bicycle light luminance
0 0.1 cd/m2 0.32 cd/m2 1.0 cd/m2
0 25.1 7.12 7.02 5.25
0.2 6.65 10.0 7.28 6.52
2 4.20 6.85 9.80 5.85
20 4.12 3.68 3.78 4.20
mounting position of the cycle lamp did not affect detection.
3.3. Experiment 3
Experiment 3 examined 16 lighting com-binations (four LED road lighting illumin-ances and four bicycle light luminillumin-ances) – the same conditions as for Experiment 1 – but with the cycle lamp mounted at a lower vertical position, the wheel hub rather than the handlebar. The results are shown in Figure 6 and Table 5.
The road-lighting-only curve again dis-plays a trend similar to that of Experiment 1
(Figure 4) and as found in previous
work.12,15,16 Increasing the road illuminance from 0.2 lux to 20 lux did significantly increase detection (p50.01) but increases from 0.2 lux to 2.0 lux or from 2.0 lux to 20 lux were not suggested to be significant.
In contrast to Experiment 1, switching on the hub-mounted cycle lamp could lead to significant increase in detection performance, although only at 0.2 lux (p50.05). At 2.0 lux, switching on cycle lighting to 0.1 cd/m2 or 0.32 cd/m2 led to a significant decrease in detection performance but had no effect at 1.0 cd/m2. At 20 lux, switching on cycle light-ing to any luminance led to a significant decrease in detection. Note also that at 0.2 lux, the luminance of the cycle lamp did not have significant effect.
The curves for the individual cycle lamp luminances suggest an effect of contrast reversal as the road illuminance varies. The two lower luminances (0.1 cd/m2and 0.32 cd/ m2) follow the same pattern, with a significant decrease (p50.05) in detection ability, when increasing road lighting from 0.2 lux to 2.0 lux
Road light Illuminance (lux)
Median detection height (mm)
0
2
4
6
8
10
12
0.1 1 10
Helmet
Handlebar
Hub
[image:9.536.114.424.70.244.2]100
Figure 5 Results of Experiment 2: Median detection height (for 28.4 mm height) plotted against illuminance when the
[image:9.536.46.261.330.425.2]cycle lamp was mounted on either the helmet, handlebar or wheel hub
Table 4 Results of Experiment 2: Median detection
height (for 28.4 mm obstacle) for each combination of road light illuminance and cycle light location.
Road LED illuminance (lux)
Detection height (mm) of 28.4 (mm) obstacle height under the given bicycle light location
Helmet Handlebar Hub
0 12.5 6.3 3.32
0.2 10.1 8.35 3.7
2.0 8.98 9.78 5.18
20 4.12 4.65 4.22
followed by an increase in detection ability when increasing from 2.0 lux to 20 lux, although this latter change is not suggested to be significant. This is a similar trend to that exhibited by the handlebar-mounted lamp at 0.32 cd/m2 in Experiment 1 (Figure 4) and Experiment 2 (Figure 5). For the higher luminance (1.0 cd/m2), there is a gradual reduction in detection ability as road lighting illuminance increases, but this is suggested to be significant only when changing from 0.2 lux to 2.0 lux.
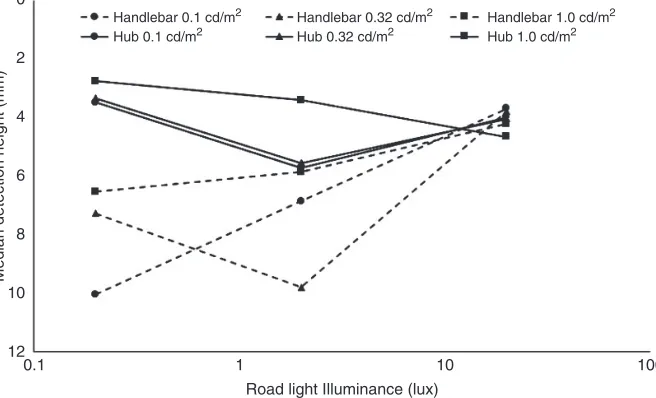
Comparing results of Experiments 1 and 3 for those conditions with the cycle lamp switched on enables a comparison of the
hub and handlebar mounting positions
(Figure 7). These data reinforce the advantage of the hub light at low road light illumin-ances. Results from the two experiments were compared using the Mann–Whitney test for unrelated samples. This suggested the hub-mounted lamp gave significantly better detec-tion (p50.001) than the handlebar-mounted lamp at 0.2 lux, for all three cycle lamp luminances: At 2.0 lux, the difference is sig-nificant (p50.05) for only the higher lumi-nance (1.0 cd/m2) but the difference is not suggested to be significant at 20 lux (p40.54).
4. Discussion
4.1. Summary of findings
Experiment 1 employed a
handlebar-mounted cycle lamp – the common mounting location – and found that switching on this lamp led either to reduced detection perform-ance or had no effect. Experiment 2 suggested that mounting the cycle lamp at a lower vertical
0
1
2
3
4
5
6
0.1 1 10
Road light Illuminance (lux)
Median detection height (mm)
Cycle lamp off Cycle 0.1 cd/m2 Cycle 0.32 cd/m2 Cycle 1.0 cd/m2
[image:10.536.102.439.71.260.2]100
Figure 6 Results of Experiment 3: Median detection height (for 28.4 mm height) plotted against illuminance. The
bicycle light was located on the hub for all trials
Table 5 Results of Experiment 3: Median detection
height (for 28.4 mm obstacle) for each combination of road light illuminance and cycle light luminance.
Road LED illuminance (lux)
Detection height (mm) of 28.4 (mm) obstacle height under the given bicycle lamp luminance
0 0.1 cd/m2 0.32 cd/m2 1.0 cd/m2
0 22.3 3.52 3.20 3.30
0.2 5.32 3.48 3.32 2.75
2 3.68 5.70 5.55 3.40
20 3.15 3.98 4.02 4.65
[image:10.536.47.261.342.447.2]position – here being the hub of the front wheel – led to a significant increase in detection at low road light illuminance (0.2 lux) but this benefit was not apparent at higher illuminances. Experiment 3 confirmed that the hub-mounted lamp increased detection but only at 0.2 lux, again with no advantage at 2.0 lux or 20 lux.
Regarding the hub-mounted lamp,
Experiment 2 used only one cycle lamp lumi-nance – 0.32 cd/m2. The results of Experiment 3 show that the lower luminance (0.1 cd/m2) provided similar detection performance. The advantage of the higher luminance (1.0 cd/m2) was that it avoids the decrease in detection performance at 2.0 lux found with lower lumi-nances but did not offer significant advantage over road lighting alone.
Regarding road lighting, the results of Experiments 1 and 3 suggest little benefit in providing an illuminance above 2.0 lux. If the road lighting illuminance is reduced from 2.0 to 0.2 lux, this leads to a reduction in detection performance, suggested to be a significant reduction in Experiment 1 (p50.05) but not suggested to be significant in Experiment 3.
This reduction in detection can be offset by cycle lighting if this is mounted on the hub but is not offset if the lamp is mounted on the handlebar or helmet.
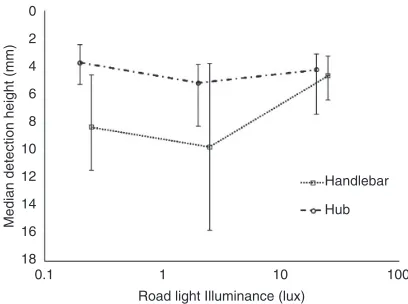
The above analyses used detection height, the height at which the largest obstacle (28.4 mm) was detected to investigate the effect of changes in lighting. An alternative approach to comparing lighting conditions is to compare the obstacle height for 50% detection (h50). This second approach was also considered during analyses and – as in previous work12– led toward the same conclusions regarding the relationship between cycle and road lighting. As an example, Figure 8 shows h50plotted against illuminance for Experiment 3 with the hub-mounted cycle lamp. To illustrate the variance found in the detection height data, Figure 9 shows the interquartile ranges found in Experiment 2 with the handlebar and hub-mounted cycle lamps.
4.2. Internal validation by repetition
Three pairs of identical conditions
were examined independently in two
0
2
4
6
8
10
12
0.1 1 10
Road light Illuminance (lux)
Median detection height (mm)
Handlebar 0.1 cd/m2 Hub 0.1 cd/m2
Handlebar 0.32 cd/m2 Hub 0.32 cd/m2
Handlebar 1.0 cd/m2 Hub 1.0 cd/m2
[image:11.536.105.433.78.277.2]100
Figure 7 Median detection height (for 28.4 mm height) plotted against illuminance for the with-cycle-lighting
experiments – namely road light only (Experiments 1 and 3) – handlebar mounted cycle lamp set to 0.32 cd/m2 (Experiments 1 and 2) and hub mounted cycle lamp set to 0.32 cd/m2(Experiments 2 and 3). The results of these conditions are shown in Figure 10. In each case, results from the two separate experiments tend to follow the same trend and this provides a measure of robustness. The Mann–Whitney test for independent samples did not suggest differences for iden-tical conditions between experiments to be statistically significant.
4.3. Contrast reversal
In this experiment, the LED array (repre-senting road lighting) lit the obstacle from above – creating a relatively bright top surface and surrounding surface compared with the side of the obstacle. The cycle lamp was projected toward the obstacle from the side and therefore created a brighter obstacle side than the surrounding horizontal surface. As the relative proportions of road
and cycle light were changed, the relative contrast of the obstacle against the back-ground (side versus surround) was also changed – with a larger contrast when either
5 5 4 4 3 3 2 2 1 1 0
0.1 1 10
Road light Illuminance (lux)
Obstacle height for 50% detection rate, h
50
(mm)
Cycle lamp off
Cycle 0.1 cd/m2
Cycle 0.32 cd/m2
Cycle 1.0 cd/m2
[image:12.536.112.426.74.291.2]100
Figure 8 Results of Experiment 3: Obstacle height for 50% detection (h50) plotted against illuminance. The bicycle light
was located on the hub for all trials
Road light Illuminance (lux)
Median detection height (mm)
0
2
4
6
8
10
12
14
16
18
1
0.1 10
Handlebar
Hub
100
Figure 9 Results of Experiment 2: Median detection
[image:12.536.279.483.348.500.2]road or cycle lighting were dominant and a smaller contrast (and hence reduced detec-tion) when they presented luminances of similar magnitude.
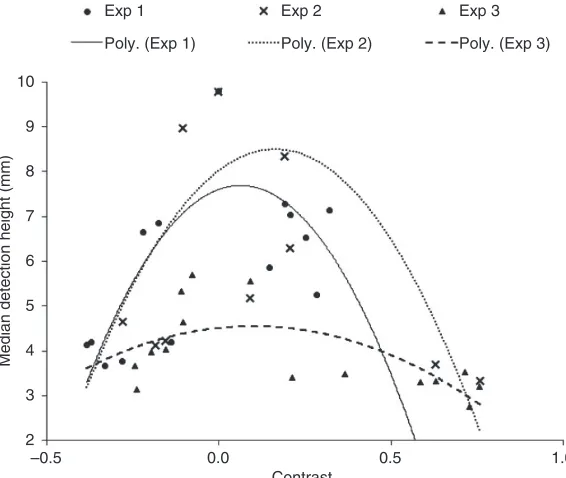
This can be seen in Figure 11 in which detection height is plotted against obstacle
contrast. Contrast was defined using
Equation 1. Luminances were measured
2 3 4 5 6 7 8 9 10
Contrast
Median detection height (mm)
Exp 1
Poly. (Exp 1) Poly. (Exp 2) Poly. (Exp 3)
Exp 2 Exp 3
[image:13.536.127.411.75.259.2]–0.5 0.0 0.5 1.0
Figure 11 Median detection height (mm) plotted against obstacle contras
0
1
2
3
4
5
6
7
8
9
10
11
0.1 1 10
Road light Illuminance (lux)
Median detection height (mm)
Exp 1: road light only Exp 1, handlebar, 0.32 cd/m2 Exp 2, hub, 0.32 cd/m2
Exp 3 road light only Exp 2, handlebar, 0.32 cd/m2 Exp 3, hub, 0.32 cd/m2
[image:13.536.126.409.302.541.2]100
from the observation point with the obstacle luminance measured on the raised side of the obstacle and surround luminance measured immediately in front of the obstacle.
Contrast¼ðLO LSÞ=LS ð1Þ
where, LO¼obstacle luminance and LS¼surround luminance
The relationship between detection height and contrast is approximately explained by a second order polynomial equation – with R2 values of 0.52, 0.40 and 0.42 for Experiments 1, 2 and 3, respectively. These trend lines indicate the expected relationship between detection height and obstacle contrast – with better detection performance at higher contrast.
In Figure 11, a negative contrast means the surround is brighter than the side of the obstacle and vice-versa for positive contrast. For a given absolute contrast magnitude, a negative value of contrast permits detection of smaller obstacles, e.g. for the results of Experiment 1, a contrast of 0.25 requires a detection height of 7 mm, but with a contrast of –0.25, the detection height reduces to approximately 5.5 mm, an improve-ment in detection performance. This suggests it is better to have a bright surround (obstacle seen in silhouette) than a bright obstacle – road lighting is more effective than cycle lighting.
We should also note that shadows may have affected obstacle detection. With the cycle light mounted in different locations, this would affect the length of shadow cast by the obstacle, being larger for the hub-mounted lamp (approxi-mately 150 mm from far edge of obstacle to tip of shadow) and smaller for the helmet-mounted lamp (approximately 40 mm). This may provide an alternative explanation as to why the hub lamp permits better detection than the handle-bar and helmet positions.
5. Conclusion
This experiment explored obstacle detection for cyclists, investigating the relationship
between lighting from overhead road lighting and a cycle-mounted lamp.
Detection under road lighting alone tended to follow the trend observed in previous work12,15,16with negligible reduction in detec-tion when reducing illuminance from 20 lux to 2.0 lux, but a significant decrease in detection when reducing below 2.0 lux.
For the range of road lighting illuminances and cycle lamp luminances considered in the current study, it was found that – except for one case – the cycle lamp did not tend to enhance detection performance and could make detection worse through a reduction in obstacle-surround contrast. This case was for road lighting of low illuminance (0.2 lux) when mounting the cycle lamp on the wheel hub improved detection compared with detec-tion when mounted at the vertically higher and more common location of the handlebar. If road lighting was reduced from 2.0 lux to 0.2 lux, the reduction in detection can be offset by using a hub-mounted lamp.
A conclusion from these findings is that there is little benefit in using cycle lamps to aid obstacle detection when cycling along a lit road, so the cycle lamp characteristics should be chosen to aid the visibility of the cyclist to other road users rather than the cyclist’s visual performance. An exception to this is using a hub-mounted lamp when the road lighting illuminance is low. Further, increas-ing the cycle-light luminance for a given road lighting illuminance may lead to improved detection, but such an increase also increases the risk of causing glare to other road users.
thus to better simulate the cognitive demand of maintaining balance, and that the obstacle location is varied. We expect age to have a significant effect at low illuminance12,16 and therefore the young age of the sample used in the current work (18 years to 36 years old) should be extended to include also older people.
Funding
This work was carried out through support from EPSRC (EP/H050817, EP/M02900X/1) as part of the University of Sheffield MERLIN project and a scholarship from the government of Kuwait.
References
1 Caminada JF, van Bommel WJM. New lighting considerations for residential areas.
International Lighting Review1980; 3: 69–75. 2 Fotios S, Uttley J, Cheal C, Hara N. Using
eye-tracking to identify pedestrians’ critical visual tasks. Part 1. Dual task approach.
Lighting Research and Technology2015; 47: 133–148.
3 Fotios S, Uttley J, Yang B. Using eye-tracking to identify pedestrians’ critical visual tasks. Part 2. Fixation on pedestrians.Lighting Research and Technology2015; 47: 149–160. 4 Fotios S, Castleton HF. Lighting for cycling –
A review.Lighting Research and Technology
First published online 6 October 2015. DOI: 10.1177/1477153515609391. 5 Fotios S, Yang B, Uttley J. Observing
other pedestrians: Investigating the typ-ical distance and duration of fixation.
Lighting Research and Technology2015; 47: 548–564.
6 Igari D, Shimizu M, Fukuda R. Eye movements of elderly people while riding bicycles.
Gerontechnology2008; 7: 128.
7 Vansteenkiste P, Cardon G, D’Hondt E, Philippaerts R, Lenoir M. The visual control of
bicycle steering: The effects of speed and path width.Accident Analysis and Prevention2013; 51: 222–227.
8 Foulsham T, Walker E, Kingstone A. The where, what and when of gaze allocation in the lab and the natural environment.Vision Research2011; 51: 1920–1931.
9 Vansteenkiste P, Zeuwts L, Cardon G, Philippaerts R, Lenoir M. The implications of low quality bicycle paths on gaze behavior of cyclists: A field test.Transportation Research Part F: Traffic Psychology and Behaviour2014; 23: 81–87.
10 Inditsky B, Bodmann HW, Fleck HJ. Elements of visual performance.Lighting Research and Technology1982; 14: 218–231.
11 Bodmann HW. Elements of photometry, brightness and visibility.Lighting Research and Technology1992; 24: 29–42.
12 Uttley J, Fotios S, Cheal C. Effect of illumin-ance and spectrum on peripheral obstacle detection by pedestrians.Lighting Research and TechnologyFirst published online, 22 September 2015. DOI: 10.1177/
1477153515602954.
13 Fotios S, Uttley J, Cheal C. Maintaining foveal fixation during a peripheral detection task.Lighting Research and Technology2015. First published online 28 April 2015.
DOI: 10.1177/1477153515583710.
14 British Standards Institution.BS 5489-1:2013 Code of Practice for the Design of Road Lighting: Lighting of Roads and Public Amenity Areas. London: BSI, 2012.
15 Fotios S, Cheal C. Using obstacle detection to identify appropriate illuminances for lighting in residential roads.Lighting Research and Technology2013; 45: 362–376.
16 Fotios SA, Cheal C. Obstacle detection: A pilot study investigating the effects of lamp type, illuminance and age.Lighting Research and Technology2009; 41: 321–342.
17 Cai J-Y, Lo Y-C, Feng S-T, Sun C-C. Design of a highly efficient LED-based bicycle head lamp with additional ground illumination.
Lighting Research and Technology2014; 46: 747–753.
Appendix A. Obstacle luminances
Table A1 Obstacle luminances in Experiment 1
Test conditions Obstacle luminance
Road
illuminance (lux)
Cycle luminance
(cd/m2) Side ofobstacle Top surfaceof obstacle Floor immediatelyin front of obstacle
0 0 0.001 0.001 0.001
0 0.1 0.078 0.044 0.059
0 0.316 0.248 0.141 0.206
0 1.0 0.800 0.465 0.623
0.2 0 0.013 0.016 0.017
0.2 0.1 0.087 0.057 0.076
0.2 0.316 0.261 0.158 0.219
0.2 1.0 0.808 0.476 0.645
2.0 0 0.078 0.122 0.124
2.0 0.1 0.153 0.168 0.186
2.0 0.316 0.328 0.266 0.329
2.0 1.0 0.870 0.585 0.759
20 0 0.756 1.223 1.228
20 0.1 0.850 1.267 1.269
20 0.316 1.028 1.367 1.429
20 1.0 1.585 1.698 1.840
Table A2 Obstacle luminances in Experiment 2
Test conditions Obstacle luminance
Road
illuminance (lux)
Cycle lamp position
Side of obstacle
Top surface of obstacle
Floor immediately in front of obstacle
0 Helmet 0.167 0.143 0.172
0 Handlebar 0.248 0.141 0.206
0 Hub 0.208 0.074 0.118
0.2 Helmet 0.177 0.151 0.182
0.2 Handlebar 0.261 0.158 0.219
0.2 Hub 0.208 0.081 0.128
2.0 Helmet 0.255 0.258 0.285
2.0 Handlebar 0.328 0.122 0.329
2.0 Hub 0.262 0.195 0.240
20 Helmet 1.088 1.335 1.337
20 Handlebar 1.028 1.367 1.429
[image:16.536.47.493.349.509.2]Table A3 Obstacle luminances in Experiment 3
Test conditions Obstacle luminance
Road
illuminance (lux)
Cycle luminance (cd/m2)
Side of obstacle
Top surface of obstacle
Floor immediately in front of obstacle
0 0 0.001 0.001 0.001
0 0.1 0.066 0.026 0.039
0 0.316 0.208 0.074 0.118
0 1.0 0.637 0.226 0.401
0.2 0 0.014 0.016 0.015
0.2 0.1 0.068 0.036 0.050
0.2 0.316 0.208 0.081 0.128
0.2 1.0 0.621 0.221 0.360
2.0 0 0.093 0.122 0.123
2.0 0.1 0.144 0.143 0.156
2.0 0.316 0.262 0.195 0.240
2.0 1.0 0.632 0.359 0.521
20 0 0.918 1.214 1.207
20 0.1 0.960 1.238 1.194
20 0.316 1.075 1.293 1.273