cell-macrophage immunological synapses
.
White Rose Research Online URL for this paper:
http://eprints.whiterose.ac.uk/130857/
Version: Accepted Version
Article:
Kasprowicz, Richard Mark Robert, Rand, Emma, O'Toole, Peter John
orcid.org/0000-0001-5295-2001 et al. (1 more author) (2018) A correlative and quantitative
imaging approach enabling characterization of primary cell-cell communication: Case of
human CD4+ T cell-macrophage immunological synapses. Scientific Reports. ISSN
2045-2322
https://doi.org/10.1038/s41598-018-26172-3
[email protected] https://eprints.whiterose.ac.uk/ Reuse
This article is distributed under the terms of the Creative Commons Attribution (CC BY) licence. This licence allows you to distribute, remix, tweak, and build upon the work, even commercially, as long as you credit the authors for the original work. More information and the full terms of the licence here:
https://creativecommons.org/licenses/
Takedown
If you consider content in White Rose Research Online to be in breach of UK law, please notify us by
Title:
A correlative and quantitative imaging approach enabling
characterization of primary cell-cell communication: Case of human
CD4
+T cell-macrophage immunological synapses.
Richard Kasprowicz
1, Emma Rand
2, Peter J O’Toole
3and Nathalie Signoret
1*1
Centre for Immunology and Infection, Department of Biology and Hull York Medical
School, University of York, YO10 5DD York, United Kingdom.
2
Department of Biology, University of York, YO10 5DD York, United Kingdom.
3
Bioscience Technology Facility,
Department of Biology, University of York, YO10 5DD
York, United Kingdom
*
corresponding author
:
[email protected]
Words count:
Abstract: 198
Intro + results + discussion: 4573
8 Figures
Abstract:
Introduction:
Contact-based cell communication is an essential mode of crosstalk in the functioning of mammalian organs, tissues, nervous and immune systems. Understanding the molecular basis of functional cell connections is therefore important to tackle diseases resulting from their breakdown. Insights require techniques to visualize and characterize these connections in action, many of which have been developed to investigate immune communication. Cells of the immune system can form specialized cell-cell junctions defined as immune synapses and kinapses (IS and IK), two differing modes of signaling interactions that are interchangeable but remain functionally distinct1-6. IS is a stable signaling junction marked by the formation of micrometer scale three-dimensional domains of signaling components, cell surface proteins and lipids that accumulate to the cell interface3,7-9. Our knowledge of the organization and dynamics of these junctions comes from in vitro or in vivo studies using genetically modified cells over-expressing labeled cellular markers to track conjugates formed between a T cell and an antigen-presenting cell (APC)6,10-13. These relatively targeted experimental approaches are tailored for investigations of known or predicted events associated with already characterized T cell-APC conjugates6,10-13. However, conjugates are highly regulated and dictated by the subsets, activation status and combination of cell involved, as well as the type of antigen presented2,14,15.
population-based investigations of cell-cell junctions, even with primary cells.
To test the validity of such an approach, we investigated an uncharacterized form of T cell-APC junction between human CD4+ T cells and macrophages in primary cell cultures. Antigen-dependent interaction of macrophages with CD4+ T cells forms an important aspect of cell-mediated immunity that can result in macrophage activation. In vitro, IS or IK formation between murine macrophage lines and transformed T cells has been shown to be highly dynamic19. However, direct visualization of this type of junction and whether typical markers accumulate to the cell-cell interface has not yet been demonstrated in primary cells. Peripheral blood mononuclear cells (PBMCs) are convenient to investigate diversity in immune cell interactions because non-clonal subpopulations of T cells and autologous APCs can be isolated, activated and/or differentiated in vitro. Various forms of T cell/APC conjugates have been reported using PBMCs and described by confocal microscopy or imaging flow cytometry20-23. By adding live calcium imaging and recording to correlated confocal imaging of cell conjugates, we deliver an improved method, focusing on the formation of functional cell-cell interactions.
Results
:
To account for the diversity of antigen-dependent interactions, we chose to assess the interaction of human MDMs with autologous CD4+ T cells in presence of bacterial superantigen (sAg). Staphylococcal sAgs, enterotoxins A, B and/or E (SEA, SEB, SEE), stabilize immune cell-conjugates by crosslinking Major Histocompatibility Complex class II (MHCII) molecules on APCs to T cell receptors (TCR) for up to 20% of the peripheral blood T cell repertoire24. This scenario creates diversity in the experimental situation, as only a subset of T cells will be engaged in stabilized antigen-dependant interactions.
Assessing the frequency of signal productive conjugates within a population
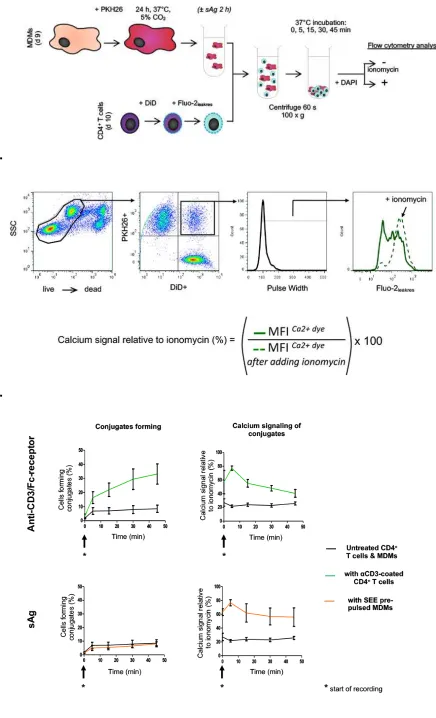
A time-staggered flow cytometry protocol was developed to investigate the extent to which addition of sAg affects the proportion of T cell–APC conjugates forming over time, and T cell signaling within these conjugates. The protocol involved labeling live MDMs and CD4+ T cells with lipophilic membrane dyes, while loading T cells with a calcium sensitive reporter dye (described in Fig. 1A). This protocol makes effective use of the high sampling rate of a flow cytometry platform to analyze a large population of cells, from which the frequency of CD4+ T cell-MDM conjugate formation can be determined by gating on events positive for both lipophilic dyes (PKH26+DiD+ cells, Fig. 1B). Loading of T cells with Fluo-2
leakres allowed for measurements of antigen-dependent signaling within the CD4+ T cell-MDM conjugates formed. At each time point, samples were acquired to detect Fluo-2leakres fluorescent signal before and after addition of ionomycin. Levels of intracellular calcium signals within the population of conjugate formed could be expressed as a fraction of the reference maximum signal released by ionomycin (Fig. 1B).
sAg-dependent CD4+ T cell-MDM interactions trigger calcium signaling within the conjugate population.
Developing an image-based assay capable of identifying productive CD4+T-MDM
conjugates
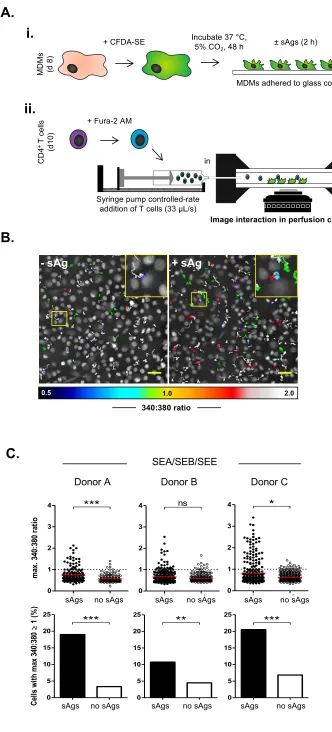
Fow cytometry protocol provided a Boolean measure for occurrence of antigen-dependent interactions and a measure of their frequency within mixed cell populations, through rapid sampling of over 10,000 events per samples. However, the next steps involved determining the nature of these cell-cell interactions, which requires measurements of temporal events of individual cells and assessment of the spatial arrangement of proteins at the cell-cell interface. Since such measurements cannot be determined via traditional flow cytometry, we chose to adapt our approach for live cell wide-field fluorescence microscopy. We used the prior flow cytometry results to inform development of a protocol for imaging interactions between CFSE-labeled MDMs and CD4+ T cells pre-loaded with the ratiometric intracellular calcium indicator Fura-2/AM (Fig. 2A). The assay was conducted at high cell densities (107 ± 48 CD4+T cells and 198 ± 38 MDMs [mean ± SD] per 470 x 470 µm region) due to the expected 8% frequency of conjugate-forming events. Based on the fast-onset of sAg-dependent calcium signaling detected by flow cytometry, we opted for a controlled rate injection of T cells over MDMs in a perfusion chamber with immediate imaging initialization and use of an imaging interval of 10s. A color scale was applied to Fura-2/AM 340:380 intensity ratio time-lapse images, to indicate the cytoplasmic calcium levels of CD4+ T cells during interactions with MDMs pre-pulsed or not with sAg (Fig. 2B). The extended duration of red or white flashing T cells in time-lapse images provides an immediate visual indicator that more T cells exhibit high levels of intracellular calcium in the presence of sAg (Mov. 1-3). To quantify the extent of intracellular calcium and T cell migration, T cells were tracked over the assay time course with measures of 340:380 ratios extracted for individual cell. The maximum 340:380 ratio (340:380max) was used as an immediate readout of the amplitude of calcium signaling for each CD4+ T cell within the imaged region (Fig. 2C).
Initially, imaging experiments were carried out using only SEE (Fig.S1), but to improve donor-to-donor consistency in T cell responses, subsequent assays were conducted using a cocktail of three sAgs (SEA, SEA and SEE) to broaden the spectrum of TCR Vβ recognized by the sAg, as previously reported27. Analysis of the entire T cell population imaged includes contributions of both T cells engaged in conjugates and those existing in isolation (Fig. 2C, beeswarm plots). Non-significant differences between all T cell calcium responses ± sAgs reflect the low frequency of conjugate formation. Sensitivity to events with low frequency within the population requires exclusion of the basal CD4+ T cell calcium signaling events (340:380
threshold (340:380max ≥ 1) to the analysis (Fig. 2C,bar graphs). Fisher’s exact test of the number of events above threshold revealed that the number of CD4+ T cells responding with calcium levels ≥ 1 was significantly greater for all donors when cells were introduced into MDM cultures pulsed with sAgs (Fig. 2C,bar graphs). Thus, we have established an imaging assay and analysis routine with sufficient sensitivity to immediately detect sAgs-dependent calcium signaling events that occur at a low frequency between a heterogeneous, polyclonal co-culture of MDMs and autologous CD4+ T cells derived from human blood.
Single-cell analysis of CD4+ T cell calcium signatures
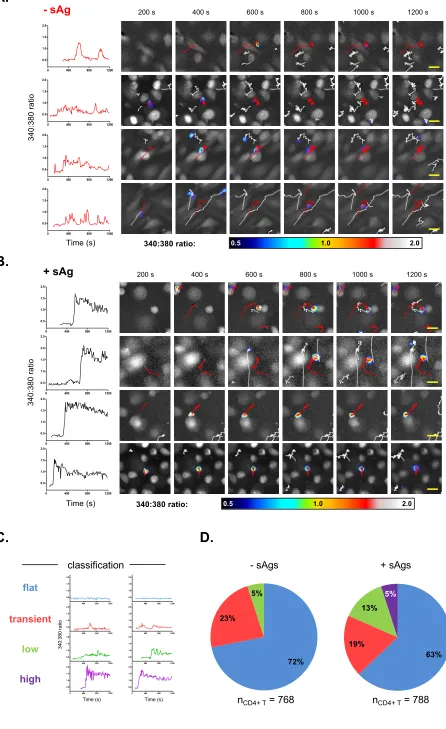
Up to now, CD4+ T cell-MDM interactions have been considered on the population level. All CD4+ T cell intracellular calcium responses have been measured according to the maximum level of calcium experienced by each cell throughout the assay. Yet the image-based assay provides a temporal axis over which intracellular calcium levels of individual CD4+ T cell can be plotted. Each plot, which we term a calcium signature, can then be considered on a single-cell basis. Examples of calcium signatures that occurred within untreated and sAgs-pulsed MDM samples are shown in Fig. 3A and Fig. 3B, respectively. All the signatures depicted come from T cells designated to belong to the acute calcium-signaling group (340:380max ≥ 1), as defined in the population-type analysis. Despite all the signatures shown being grouped together, clear differences in temporal aspects of calcium signaling are apparent when viewed as single-cell signatures. In the absence of sAgs, calcium profiles of CD4+ T cells show transient rises that return to baseline levels within the 20 min imaging timeframe (Fig. 3A). In contrast, when MDMs are pulsed with sAgs, the calcium profiles of CD4+ T cells often have sharp, high-amplitude onsets that maintain a high level for the remainder of the imaging timeframe (Fig. 3B).
Multiparametric space analyses identify CD4+ T cell ‘responders’ in conjugates
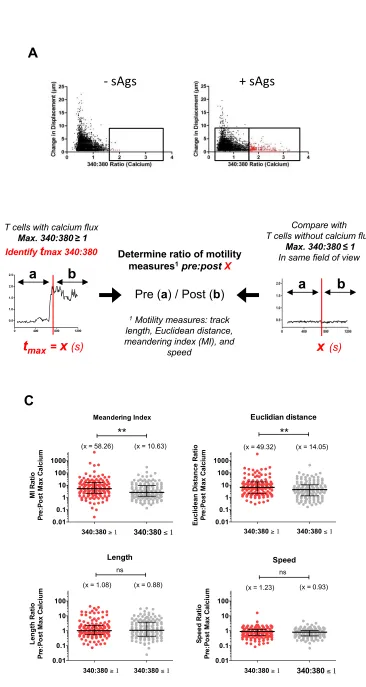
Time-lapse images ±sAgs show that a fraction of T cells undergo calcium signaling with concurrent restriction of migration, whilst in close proximity to an MDM (Mov. 4). Plots of frame-to-frame displacement against 340:380 calcium ratio for all time points within every T cell track show that restriction of migration is not uniquely associated with increased calcium signaling (Fig. 4A); albeit acute calcium signals (340:380max ≥ 1) only occurred in T cells exhibiting changes in displacement < 5 µm/frame. We sought to identify whether the onset of calcium signaling, defined as the time of 340:380max (t340:380max), is followed by any significant changes in the following T cell motility measures: track length, Euclidean distance, meandering index (Euclidean distance/ track length), and speed. The t340:380max for each T cell recorded as undergoing acute calcium signaling (340:380max ≥ 1) was matched to the cell with the closest t340:380max within the T cell population undergoing basal calcium signaling (340:380max ≤ 1). Next, the ratio of the total motility measure [pre-t340:380max]: [post-t340:380max] was calculated (Fig. 4B). Performing t340:380max matching and determining the ratio of each motility measure on a per-cell basis accounts for the gradual slowing in fluid flow after initial perfusion of T cells and for positional variation in the speed of fluid flow within the perfusion chamber. Analysis of ratio motility measures between T cells from acute and basal calcium signaling groups within sAg-pulsed samples showed statistically greater Pre/Post t340:380max ratios of Euclidean distance and meandering index for T cells undergoing acute signaling (Fig. 4C). This equates to reduced Euclidean distance but not track length or speed in response to calcium signals. Such differences were not detected when comparing conjugates formed without sAgs (Fig. S2). Overall, our motility analysis indicates that CD4+ T cells engaged with MDMs in a sAg-dependent manner do not simply stop migrating but become corralled to a position close to the initial site of calcium signal onset.
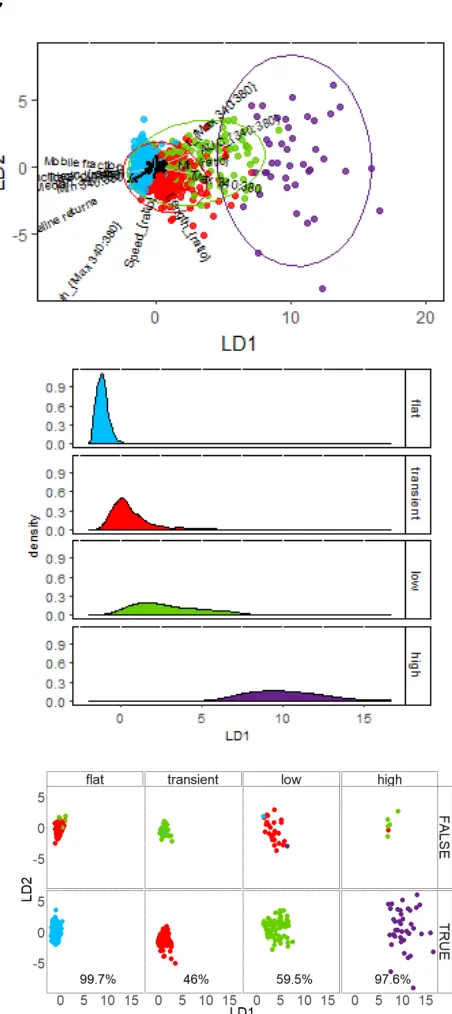
only seen with sAgs clustered as a separate population of ‘responders’ away from all origins (Fig. 5B and Mov. 5). To ascertain the relevance of our visual calcium classification in separating out ‘responders’ we used Fisher's Linear Discriminant Analysis (LDA), a supervised statistical method that maximizes the separation between groups28. LDA identified the different calcium signature groups (Fig 5C, bi-plot), showed complete separation on the first linear discriminant for the ‘flat’
and ‘high’ groups, but overlap for ‘transient’ and ‘low’ signatures, suggesting less accuracy in allocating intermediate profiles (Fig. 5C, LD1 density plots). There was very high correspondence between predicted and observed ‘high’ profiles that defined T cell ‘responders’, with 97.6% of cases correctly classified (Fig 5C, class prediction plot). These analyses confirm that quantitative parameters derived from calcium cell tracking can discriminate CD4+ T cells responding to MDMs pulsed with sAgs.
Calcium signatures that correspond to the formation of the CD4+ T cell –MDM immune
synapse
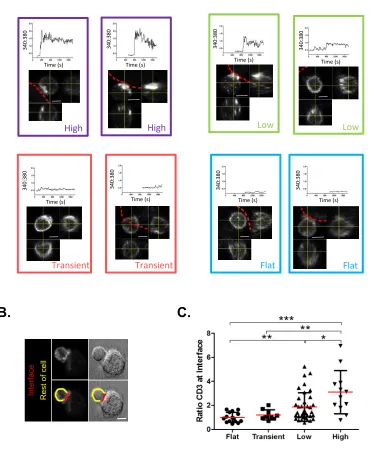
To assess which calcium signature(s) relate to CD4+ T cell-MDM immunological synapse formation, calcium signaling of cell conjugates was recorded for 30 min prior to fixation and immunolabeling with anti-CD3 for correlated imaging. Confocal Z-stacks were acquired of cells in the original regions used for live calcium recording, and CD3 3D distribution linked to the calcium signatures on a single-cell basis. The accumulation of endogenous CD3 to the interface of sAgs-dependent cell-cell conjugates marked IS formation (Fig. 6). Orthogonal images showed the accumulation of CD3 correlating with cells exhibiting sustained calcium signatures (‘high’ and ‘low’), whilst CD3 appeared to be evenly distributed across the surface of T cells with basal calcium signals (‘transient’ and ‘flat’; Fig. 6A). The ratio of CD3 at the CD4+ T cell-MDM interface compared to the rest of the T cell was determined to quantify its accumulation (Fig. 6B). Quantification confirmed that CD3 accumulation to synapse interface only occurs in CD4+ T cells that have experienced ‘high’ or low calcium signatures (Fig. 6C). Interestingly, not all ‘low’ calcium signatures result in measurable CD3 accumulation at the cell-cell interface, suggesting a mix of either kinapses or recently formed synapses6,16. Note that the fixation process eliminates free or weakly interacting CD4+ T cells and increases the apparent proportion of cells with ‘high’ or ‘low’
calcium (Fig. S3). Combining assessments of intracellular calcium and CD3 distribution together, led us to capture rare incidences of bona fide immune synapses formed.
Analysis of endogenous proteins localizing to the interface of productive CD4+ T cell-MDM
synapses
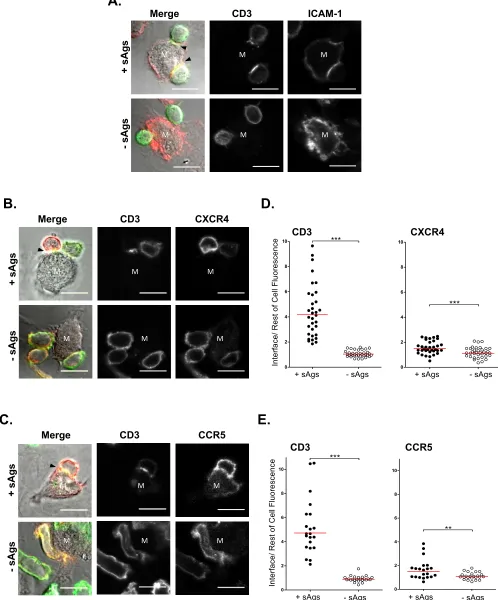
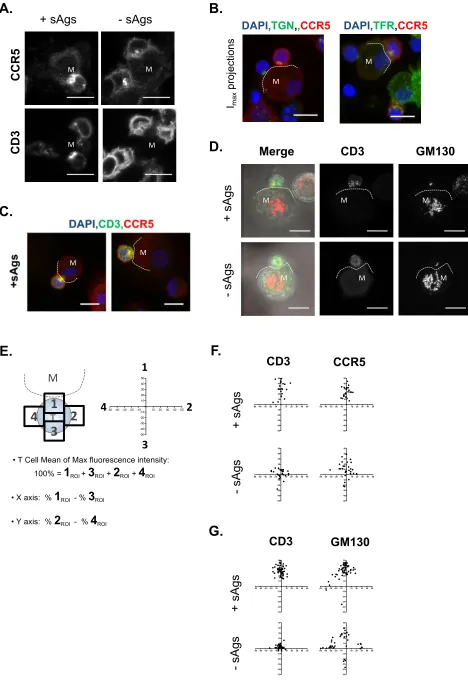
ICAM-1 expressed at the surface of MDMs was observed to accumulate opposite to capped CD3 with sAgs (Fig. 7A), as reported for other synapses9. Note that the classical concentric rearrangement of CD3 and ICAM-1 on opposite sides of a synapse could be seen when, in rare occasions, the orientation of a CD4+ T cell-MDM conjugate allowed for a planar interface (Fig. S3). Surface protein ccumulation alongside CD3 on T cells was then examined. Previous reports have indicated that GFP-fused chemokine receptors CXCR4 and CCR5 ectopically expressed in CD4+ T cells accumulated at IS interfaces formed with DCs or B cells27,29. Here, we investigated the fate of endogenous CXCR4 or CCR5, the latter being expressed on some but not all CD4+ T cells (Fig. S4)30. We found that conjugates stained fixed/intact to only detect cell surface CXCR4 and CCR5 molecules showed very marginal changes in their overall distribution on MDM-interacting CD4+ T cells, compared to CD3 (Fig. 7B & C). Nevertheless, analysis of the ratio of staining accumulation to the interface (via the method illustrated in Fig. 6B) revealed that for CD4+ T cells interacting with MDMs with sAgs, CXCR4 and CCR5 slightly but significantly increased at the interface concomitantly to CD3 (Fig. 7D & E). Although MDMs also express cell surface CCR531, the staining pattern of MDM CCR5 did not change with the formation of conjugates. Following antigen-dependent IS formation, many molecular rearrangements occur under the plasma membrane of the interacting T cells, such as the polarization of intracellular organelles32. Labeling conjugates after permeabilization exposed an intracellular pool of CCR5 close to cell-cell interfaces, even in the absence of sAgs (Fig. 8A). This pool overlapped with the trans-golgi network (TGN) or the Transferrin receptor (TfR), confirming that some CCR5 is intracellular in CD4+ T cell, and follows a well-established early recycling route (Fig. 8B & S5)33,34. In presence of sAgs, CCR5 and CD3 positive vesicles appeared under the cell-cell interface (Fig. 8C), suggesting internalization events known to take place after IS formation35. The position of the Golgi apparatus was examined for conjugates co-stained for CD3 and GM130 after fixation and permeabilization. As for CCR5 (Fig. 8A) examples of Golgi apparatus polarized towards conjugate interfaces were visible ± sAgs (Fig. 8D). We modified the quantitative method of analysis described in Fig. 6B to assess the total distribution of cellular markers including surface and internal localization (Fig. 8E). These analyses revealed that sAgs promoted tpolarization of the T cell pool of CCR5 and GM130 labelled Golgi towards the interface of CD3 capping synapses (Fig. 8F & G). This set of experiments demonstrate that our approach allows for quantitative detection of subtle endogenous molecular rearrangements consequent to IS formation.
Discussion
Being able to capture events of cell-to-cell communication in real time to investigate the dynamic molecular events engaged, is leading to advance in our understanding of cellular behaviours. Current techniques are largely based on in vitro and in vivo live imaging of cells expressing specific fluorescent markers, and relatively inaccessible to investigations using primary cell cultures. Here we developed an approach enabling detailed single cell- and population-based investigations of cell-cell junctions with primary cells, which is based on the detection of a ubiquitous second messenger (intracellular calcium). By combining fluorescence time lapse recording and correlative imaging, with multivariate statistical methods of analysis, we deliver unique high throughput and unbiased assessments of rare and dynamic cell-cell interaction events. The approach makes as few assumptions about the nature of the cell engagement as possible. It enables the extent of cell-cell interactions within a heterogeneous, polyclonal culture to be measured using widely available scientific instrumentation to define signal-productive events.
significantly greater proportion of CD4+ T cells exhibited high levels of intracellular calcium upon interaction with sAg-pulsed MDMs.
Live calcium recording allowed dynamic analysis of interacting CD4+ T cells and showed that onset of intracellular signaling (340:380max ratio ≥1) coincided with CD4+ T cells arrest on MDMs reflecting stable fully signaling conjugate events. Yet many mobile T cells showed low calcium signals (340:380max ratio ≤1), which could correspond to kinapses19 and reconcile motile behaviour previously seen in murine macrophage-CD4+ T cell interactions in vitro19,41. To convincingly identify such kinapses, the imaging technique needs to be able to differentiate between stable (< 1µm/min), slowly mobile (1-2 µm/min) and dynamic crawling (1-10µm/min) states2, which requires a higher resolution image. CD4+ T cells showed ‘flat’ calcium profiles for most cells analyzed, but where increases in calcium were apparent, variable profiles in terms of intensity and duration were classified as ‘transient’ and more sustained profiles as ‘low’ or ‘high’. The classification was based on validated systems17,18,42, which we have adapted to report upon polyclonal CD4+ T cell population responses that have an intrinsically wide range of affinities for antigens. This qualitative analysis revealed that ‘high’ calcium profiles were only associated with conjugates formed in presence of sAgs, while the proportion of ‘low’ profiles increased with addition of sAgs, which suggests a mix of synapses and kinapses according to the model suggested by Kummerow et al16. Importantly, onsets of ‘high’ profiles correlated with CD4+ T cells close apposition to MDM, and an arrest indicative of stable IS formation. Considering thirteen different motility and calcium related measures of individual T cells in multivariate statistical analyses (PCA and LDA) showed how ‘high’ signatures correlated with the appearance of a separate population of ‘responders’. The unsupervised PCA established calcium signaling as prevalent discriminator of T cell engagement, while LDA indicated our visual classification was less discriminatory for ‘low’ and ‘transient’ events, but nearly fully accurate when allocating ‘high’
profiles. This highlights potential to automate and accurately identify calcium functioning conjugates by using the measurements and unsupervised statistical methods described.
our analysis confirmed the polarization of intracellular compartments in IS, whilst revealing a modest but significant accumulation of endogenous chemokine receptors from T cells towards the interface with MDMs. This validates observations reported in other experimental settings27,29,43. Together, our experiments defined essential characteristics of a novel form of IS between primary human CD4+ T cells and macrophages.
Methods:
Reagents and Antibodies
Tissue culture reagents and secondary antibodies [AlexaFluor-488 conjugated
goat-anti-mouse (GAM) IgG1, AlexaFluor-647 conjugated GAM IgG2a, and AlexaFluor-488
conjugated donkey-anti-sheep IgG] were purchased from Invitrogen. Primary antibodies
used were sheep-anti-human TGN46 (TGOLN2; IgG) from Bio-Rad; mouse-anti-human
CCR5 (MC-5, IgG2a
44) and CXCR4 (12G5, IgG2a
45), CD3 (UCHT1, IgG1; OKT3, IgG2a)
from BioLegend, GM130 (35/GM130, IgG1) from BD Biosciences and TfR (H68.4; IgG1)
from Invitrogen. Recombinant
Staphylococcus aureus
enterotoxins and sAgs SEA, SEB
and SEE were purchased from Sigma-Aldrich and Toxin Technology Inc., respectively.
Other reagents were purchased from Sigma-Aldrich, unless stated.
Cell isolation and culture
Monocytes were isolated from healthy donor blood leukaphoresis cones (National Blood
Service, UK) and differentiated to MDMs in cell culture medium [RPMI 1640 with 2 mM
L-glutamine, 10% foetal bovine serum (FBS; PAA), 100 U/ml penicillin, 0.1 mg/ml
streptomycin, 25 mM HEPES] with 50 ng/ml M-CSF (PeproTech)
46. One fifth volume of
each cone was used for isolation of autologous human CD4
+T cells via RosetteSep
human CD4
+T cell enrichment cocktail (Stemcell Technologies). CD4
+T cells were
cultured at a starting density of 2 x 10
6cells/ml in medium supplemented with 5 µg/ml
phytohaemagglutinin for 3 days, then 7 days culture with 10 U/ml recombinant human
interleukin-2 (PeproTech).
Flow cytometry strategy for assessing conjugate formation
MDMs (day 9) were detached then labelled with 2 µM PKH-26 (Sigma-Aldrich) for 5 min
at room temperature (RT). Labeling was quenched with FBS, cells were washed in media
and returned to culture at 0.5-1.0 x 10
6cells/well in a 6 well plate (Corning) for 24 h.
Labeled MDMs were left untreated or pulsed with 1 µg/ml sAg SEE for 2 h at 37°C in
suspension. During this time, CD4
+T cells were labelled with 250 nM DiD (Life
Technologies) at a density of 1 x 10
6cells/ml for 5 min at 37°C. DiD-labelled T cells were
washed and incubated in media at a density of 4 x 10
5cell/ml for incubation with 300 nM
5% CO
2. Both cells were washed in media before adding T cells to MDMs at a 1:1 cell
ratio. Unlabelled control and 6 compensation samples were also prepared, in which cells
were co-incubated as described but labelled with either PKH26, DiD, Fluo-2
leakres, PKH26
and Fluo-2
leakres, or PKH26 and DiD. MDM-CD4
+T cell interactions were synchronized by
centrifugation (100 x g for 1 min) and conjugate formation analyzed immediately (T=0) or
after incubation at 37°C. Samples were run on a CyAn
TMADP flow cytometer (Beckman
Coulter) after addition of 4',6-diamidino-2-phenylindole (DAPI; 50 µg/ml). For each
sample 30 µl of 10 µg/ml ionomycin (Sigma-Aldrich) were added after acquisition, and the
sample was re-acquired; analysis was performed using FlowJo software (TreeStar). Dead
cells (DAPI
+) were excluded and the percentage of events within the PKH26
+DiD
+quadrant was used as readout of MDM-CD4
+T cell conjugate formation. A pulse-width >
100 selection gate was used in order to strictly exclude smaller-sized double positive
MDM events that might occur as a result of DiD transfer by phagocytosis. This gate was
used along with conjugate (PKH26
+, DiD
+) population gates in order to obtain a calcium
signal not skewed by false positive single cell-type events exhibiting intermediate DiD
fluorescence. The Fluo-2
leakresmean fluorescence intensity (MFI) of cells within the DiD
+gate from run one was normalised to the maximum calcium signal obtainable, which was
determined using an identical gate on a tandem second acquisition of the same sample
after ionomycin addition; this calcium signal relative to ionomycin was used as a readout
of CD4
+T cell signalling in conjugates formed with MDMs. These experiments were
performed on cells from N=3 donors.
Live cell imaging of MDM-CD4
+T cell conjugates
MDMs (day 8) were detached, counted and adjusted to a density of 1 x 10
7cells/ml, and
labeled with 840 nM CFDA-SE (Life Technologies) in PBS for 15 min at 37°C. Labeled
cells were washed and quenched in medium for 30 min at 37°C, 5% CO
2then seeded
onto poly-
D-lysine (Sigma-Aldrich) coated glass coverslips (2 x 10
5cells/coverslip). After
24 h cells were left untreated or pulsed with 1 µg/ml sAgs for 2 h at 37°C, 5% CO
2,as
indicated. Concurrently, autologous CD4
+T cells were labelled in medium at 37°C for 30
min with a ratiometric calcium sensitive dye (5 µM fura-2/AM; Biotium Inc), then
resuspended at 1 x 10
6cells/ml in phenol-red free media and incubated at RT for 30 min.
MDMs on coverslips were washed prior to being affixed into an RC-21BRFS closed
device was filled with phenol-red free medium and sealed by applying another coverslip
to form the upper face of the chamber. Imaging was performed with an incubated inverted
epifluorescence microscope (see supplemental material). Experiments were repeated
with three technical replicates on cells from N ≥ 3 donors.
Cell tracking and processing of live cell images
Image analysis was performed using ImageJ
47, the RatioPlus plugin was used to generate
an output ratio image of 340 nm and 380 nm time-sequence 16-bit images. The 32-bit
ratio image was set to min/max values of 0.5/2.0, which was then translated to a 16-bit
range and false-colored by applying a ’16 colors’ look-up table. Ratio images were
overlaid over the 485/20 nm images of MDMs from the same time sequence, which had
been false-colored white. MTrackJ plugin manually tracked the CD4
+T cells in each time
sequence, which were measured with a circular point size of 20 pixels. Tracks of < 5 min
duration were immediately excluded. The level of T cell intracellular calcium (340:380 nm
ratio) for every T cell in each time sequence was plotted over time, defining calcium
signatures.
Motility data analysis
MATLAB (The MathWorks Inc.) was used to manipulate .csv outputs from MTrackJ to
generate the following thirteen measures of T cell behavior: mobile fraction (fraction of
track where cell is moving > 2 µm/min); track duration [s]; t
max 340:380[s] (time of max
340:380 ratio); % track length
max 340:380(percentage of track length at which t
max 340:380occurs); returns to baseline (R2B; number of returns to within 20% of the baseline, defined
as the median value of ten tracks with lowest 340:380 range); min
340:380(minimum
340:380 value of the track); max
340:380(maximum 340:380 value of the track);
median
340:380(median 340:380 value of the track); area under curve (AUC)
340:380(area
between the 340:380 curve and the baseline/ track duration); length
ratio(track length [µm]
pre t
max 340:380/ track [µm] length post t
max 340:380); speed
ratio(speed [µm/s] pre t
max 340:380/
speed [µm/s] post t
max 340:380); meandering index (MI = Euclidean distance/track length)
ratio(MI pre t
max 340:380/ MI post t
max 340:380); Euclidian distance
ratio(displacement [µm] from track
origin to t
max 340:380\ displacement [µm] from t
max 340:380to track end). Tracks with fewer than
non-signalling cells, tracks from T cells with max. 340:380 ≤ 1 were selected according to
the closest match of t
max 340:380to T cells with max. 340:380 ≥ 1.
Correlative imaging of live and fixed MDM-CD4
+T cell conjugates
Live cell imaging of MDM-CD4
+T cell interactions was performed as described, but with
CFSE-labelled MDMs seeded in a glass-bottomed 35 mm dish (MatTek corporation) and
pulsed with 1 µg/ml sAgs. A mark was made on the base of the dish to facilitate orientation
and location of a nearby region. Live cell imaging of the region took place for a total of 30
min, directly after which the sample was fixed in 3% PFA for 20 min, permeabilized and
immunolabeled with anti-CD3 (OKT3) as described below. Guided by the mark, the
original FOV was located on a confocal fluorescence microscope and z-stacks of the CD3
distribution of all remaining T cells in the region were acquired. The position of each T
cell within the region was used to match the z-stack of a given T cell to the calcium
signature it demonstrated prior to fixation.
Classification of CD4
+T cell intracellular calcium levels
Population-level analysis: The maximum 340:380 nm ratio was used as a
high-throughput, global readout of the extent of intracellular calcium signaling exhibited by
each CD4
+T cell over the timeframe of the live-cell imaging assay. Where indicated, a
340:380 nm threshold of 1 was utilized in order to exclude the large number of T cells that
only underwent basal calcium signaling.
Single-cell analysis: The different calcium signatures were qualitatively classified in a
blinded manner into four groups defined by
‘flat’
: no rise or sharp spikes above baseline
calcium level;
‘transient’
: a rise in calcium followed by one or more returns to baseline
over the course of the assay;
‘low’
: a rise in calcium that neither returned to baseline nor
fulfilled the acceptance criteria of the
‘high’
group;
‘high’
: a calcium onset rising above a
340:380 ratio of 1.5 that is sustained above 1 for the duration of the experiment or,
alternatively, a calcium onset exceeding a 340:380 ratio of 2.
MDM-CD4
+T cell conjugate formation and immunolabeling for confocal
fluorescence microscopy
2 x 10
5MDMs (day 8) were seeded onto 10 mm diameter glass coverslips and allowed
for 2 h, washed with medium, before autologous CD4
+T cells were added at a T cell:
MDM ratio of 2:1 and interactions synchronized by centrifugation (100 x g for 1 min).
MDMs and CD4
+T cells were co-incubated for 30 min, 37°C, 5% CO2, then fixed with
3% PFA for 20 min at RT. Coverslips were washed and quenched with 50 mM NH
4Cl in
PBS for 20 min at RT. They were either left intact or permeabilized by including 0.05%
Saponin in all subsequent labeling and wash solutions. For staining, Fc receptors were
blocked with 30 µg/ml human IgG (hIgG) in PBS containing 1% FBS (PBS-FBS) for 30
min. Coverslips were incubated for 60 min at RT with the relevant primary antibodies or
the corresponding isotype controls diluted at 5 µg/ml in PBS-FBS with 5µg/ml hIgG.
Samples were then washed and incubated for 60 min with 4 µg/ml GAM IgG1
AlexaFluor488 and IgG2a AlexaFluor647, or anti-sheep AlexaFluor488 secondary
antibodies in PBS-FBS with 5µg/ml hIgG, as indicated. Following further washes, samples
were labeled with 1 µg/ml DAPI in PBS for 5 min before coverslips were mounted in
mowiol. Individual confocal sections or z-stacks images were acquired to analyze the
distribution of cell markers, as indicated. Controls showed no negligible binding of
isotypes controls and no cross-reactivity. Experiments were performed with cells from N
≥ 3 donors.
Analysis of marker accumulation to the MDM-CD4
+T cell interface
Bright-field images were used as a position guide in order to manually trace the plasma
membrane of cells (traces of 10 pixels in width) over the following regions: (i) the
MDM-CD4
+T cell interface; (ii) the CD4
+T cell surface not in contact with the MDM. The MFI of
cell surface labelling within each region was measured. A ratio of surface marker
accumulation at the interface was calculated by dividing the interface MFI by the MFI
measured across the remaining T cell surface. For permeablized cells, 50x50 pixel square
(3.37 x 3.37µm) regions of interest (ROI) were drawn at four positions: the interface,
opposite the interface (away), and either side of the T cell, to include intracellular staining
in the quantification. The MFI within each ROI was expressed as a percentage of the sum
MFI of all four ROIs. A measure of side-to-side and front-to-back polarity of CCR5 was
determined and plotted together on x and y axes respectively, to graphically indicate the
overall polarization of individual markers when interacting with a MDM.
Data were analyzed with GraphPad PRISM v5.03 and normality determined using
D’Agostino-Pearsons test before statistical comparison with the appropriate test, as
indicated.
P
-values of <0.05 were considered significant: *
P
< 0.05, **
P
<0 .01, and ***
P
<0.005. PCA and LDA were performed on scaled data from all samples, using MATLAB
algorithms and R
48, respectively. LDA was implemented in the package MASS
28. Figures
were produced using ggplot2
49and ggbiplot
50. Individual scripts are provided as
supplemental files.
Data Availability:
Raw datasets generated during and/or analyzed during the current
References:
1 Celli, S., Garcia, Z. & Bousso, P. CD4 T cells integrate signals delivered during successive DC encounters in vivo. The Journal of experimental medicine 202, 1271-1278 (2005).
2 Friedl, P., den Boer, A. T. & Gunzer, M. Tuning immune responses: diversity and adaptation of the immunological synapse. Nature reviews. Immunology5, 532-545 (2005).
3 Dustin, M. L. Modular design of immunological synapses and kinapses. Cold Spring Harbor perspectives in biology1, a002873, 10.1101/cshperspect.a002873 (2009). 4 Grakoui, A. et al. The immunological synapse: a molecular machine controlling T cell
activation. Science285, 221-227 (1999).
5 Dustin, M. L. Synaptic asymmetry to go. Cell132, 733-734 (2008).
6 Azar, G. A., Lemaitre, F., Robey, E. A. & Bousso, P. Subcellular dynamics of T cell immunological synapses and kinapses in lymph nodes. Proceedings of the National Academy of Sciences of the United States of America107, 3675-3680 (2010). 7 Burack, W. R., Lee, K. H., Holdorf, A. D., Dustin, M. L. & Shaw, A. S. Cutting edge:
quantitative imaging of raft accumulation in the immunological synapse. Journal of immunology169, 2837-2841 (2002).
8 Fooksman, D. R., Shaikh, S. R., Boyle, S. & Edidin, M. Cutting edge: phosphatidylinositol 4,5-bisphosphate concentration at the APC side of the
immunological synapse is required for effector T cell function. Journal of immunology
182, 5179-5182 (2009).
9 Monks, C. R., Freiberg, B. A., Kupfer, H., Sciaky, N. & Kupfer, A. Three-dimensional segregation of supramolecular activation clusters in T cells. Nature395, 82-86 (1998). 10 Friedman, R. S., Beemiller, P., Sorensen, C. M., Jacobelli, J. & Krummel, M. F.
Real-time analysis of T cell receptors in naive cells in vitro and in vivo reveals flexibility in synapse and signaling dynamics. The Journal of experimental medicine207, 2733-2749 (2010).
11 Choudhuri, K. et al. Polarized release of T-cell-receptor-enriched microvesicles at the immunological synapse. Nature507, 118-123, doi:10.1038/nature12951 (2014). 12 Ritter, A. T. et al. Actin depletion initiates events leading to granule secretion at the
immunological synapse. Immunity42, 864-876 (2015).
13 Kallikourdis, M. et al. Phosphatidylinositol 4-Phosphate 5-Kinase beta Controls
Recruitment of Lipid Rafts into the Immunological Synapse. Journal of immunology196, 1955-1963 (2016).
14 Thauland, T. J. & Parker, D. C. Diversity in immunological synapse structure.
Immunology131, 466-472 (2010).
15 Dustin, M. L. Impact of the immunological synapse on T cell signaling. Results and problems in cell differentiation43, 175-198 (2006).
16 Kummerow, C. et al. The immunological synapse controls local and global calcium signals in T lymphocytes. Immunological reviews231, 132-147 (2009).
18 Wulfing, C. et al. Kinetics and extent of T cell activation as measured with the calcium signal. The Journal of experimental medicine185, 1815-1825 (1997).
19 Underhill, D. M., Bassetti, M., Rudensky, A. & Aderem, A. Dynamic interactions of macrophages with T cells during antigen presentation. The Journal of experimental medicine190, 1909-1914 (1999).
20 Tourret, M. et al. T cell polarity at the immunological synapse is required for CD154-dependent IL-12 secretion by dendritic cells. Journal of immunology185, 6809-6818 (2010).
21 Barreira da Silva, R., Graf, C. & Munz, C. Cytoskeletal stabilization of inhibitory
interactions in immunologic synapses of mature human dendritic cells with natural killer cells. Blood118, 6487-6498 (2011).
22 Duchez, S., Rodrigues, M., Bertrand, F. & Valitutti, S. Reciprocal polarization of T and B cells at the immunological synapse. Journal of immunology187, 4571-4580 (2011). 23 Markey, K. A., Gartlan, K. H., Kuns, R. D., MacDonald, K. P. & Hill, G. R. Imaging the
immunological synapse between dendritic cells and T cells. Journal of immunological methods423, 40-44 (2015).
24 Misfeldt, M. L. Microbial "superantigens". Infection and immunity58, 2409-2413 (1990). 25 Rinnooy Kan, E. A., Wright, S. D., Welte, K. & Wang, C. Y. Fc receptors on monocytes
cause OKT3-treated lymphocytes to internalize T3 and to secrete IL-2. Cell Immunol98, 181-187 (1986).
26 Bunnell, S. C. et al. T cell receptor ligation induces the formation of dynamically regulated signaling assemblies. J Cell Biol158, 1263-1275 (2002).
27 Contento, R. L. et al. CXCR4-CCR5: a couple modulating T cell functions. Proceedings of the National Academy of Sciences of the United States of America105, 10101-10106 (2008).
28 Venables, W. N. & Ripley, B. D. Modern Applied Statistics with S. Fourth Edition. (Springer, 2002).
29 Molon, B. et al. T cell costimulation by chemokine receptors. Nature immunology6, 465-471 (2005).
30 Mo, H. et al. Expression patterns of the HIV type 1 coreceptors CCR5 and CXCR4 on CD4+ T cells and monocytes from cord and adult blood. AIDS Res Hum Retroviruses
14, 607-617 (1998).
31 Fox, J. M., Kasprowicz, R., Hartley, O. & Signoret, N. CCR5 susceptibility to ligand-mediated down-modulation differs between human T lymphocytes and myeloid cells.
Journal of leukocyte biology98, 59-71 (2015).
32 Martin-Cofreces, N. B., Baixauli, F. & Sanchez-Madrid, F. Immune synapse: conductor of orchestrated organelle movement. Trends Cell Biol24, 61-72 (2014).
33 Shirvani, H. et al. Evidence for internal stores of CCR5 in blood cells. Blood118, 1175-1176 (2011).
34 Bennett, L. D., Fox, J. M. & Signoret, N. Mechanisms regulating chemokine receptor activity. Immunology134, 246-256 (2011).
36 Lillemeier, B. F. et al. TCR and Lat are expressed on separate protein islands on T cell membranes and concatenate during activation. Nature immunology11, 90-96 (2010). 37 Moreau, H. D. et al. Dynamic in situ cytometry uncovers T cell receptor signaling during
immunological synapses and kinapses in vivo. Immunity37, 351-363 (2012).
38 Morgan, M. M. et al. Superantigen-induced T cell:B cell conjugation is mediated by LFA-1 and requires signaling through Lck, but not ZAP-70. Journal of immunology167, 5708-5718 (2001).
39 Burchiel, S. W. et al. Analysis of free intracellular calcium by flow cytometry: multiparameter and pharmacologic applications. Methods21, 221-230 (2000). 40 Lee, W. T., Prasad, A. & Watson, A. R. Anergy in CD4 memory T lymphocytes. II.
Abrogation of TCR-induced formation of membrane signaling complexes. Cell Immunol
276, 26-34 (2012).
41 Dolmetsch, R. E., Lewis, R. S., Goodnow, C. C. & Healy, J. I. Differential activation of transcription factors induced by Ca2+ response amplitude and duration. Nature386, 855-858 (1997).
42 Mohammed, Z. A., Doran, C., Grundy, D. & Nassar, M. A. Veratridine produces distinct calcium response profiles in mouse Dorsal Root Ganglia neurons. Scientific reports7, 45221 (2017).
43 Perez-Martinez, M. et al. F-actin-binding protein drebrin regulates CXCR4 recruitment to the immune synapse. Journal of cell science123, 1160-1170 (2010).
44 Blanpain, C. et al. Multiple active states and oligomerization of CCR5 revealed by functional properties of monoclonal antibodies. Molecular biology of the cell13, 723-737 (2002).
45 Hesselgesser, J. et al. Identification and characterization of the CXCR4 chemokine receptor in human T cell lines: ligand binding, biological activity, and HIV-1 infectivity.
Journal of immunology160, 877-883 (1998).
46 Fox, J. M., Letellier, E., Oliphant, C. J. & Signoret, N. TLR2-dependent pathway of heterologous down-modulation for the CC chemokine receptors 1, 2, and 5 in human blood monocytes. Blood117, 1851-1860 (2011).
47 Schneider, C. A., Rasband, W. S. & Eliceiri, K. W. NIH Image to ImageJ: 25 years of image analysis. Nature methods9, 671-675 (2012).
48 R Core Team (2017). R: A Language and Environment for Statistical Computing.R Foundation for Statistical Computing, Vienna, Austria. URL https://www.R-project.org/. 49 Wickham, H. ggplot2: Elegant Graphics for Data Analysis.(Springer-Verlag 2009). 50 Vu, V. Q. ggbiplot: A ggplot2 based biplot. R package version 0.55.,
Acknowledgements:
We are grateful for colleagues from the CII and the University of York, who have provided technical support, contributed to constructive discussionsand critically reading of the manuscript. In particular Dr. Gareth Evans (Department of Biology), Dr. Julie Wilson (York Cross-disciplinary Centre for Systems Analysis-YCCSA) and Dr. James Fox (CII). R.K was supported by a PhD studentship from the Biotechnology and Biological Sciences Research Council (London, UK).
Authors contribution:
E.R. performed multivariate statistical data analyses. R.K. created the drawings and
performed the experiments presented in the paper, contributing to their design and the
writing of the manuscript with P.J.O’T. and N.S. who was responsible for the study.
Conflict of Interest disclosure:
Figure Legends:
Figure 1
:
Flow cytometry strategy to assess the frequency and signaling of
MDM-CD4+ T cell conjugates.
(
A
) Schematic diagram describing the experimental protocol
developed; MDMs labeled with the lipophilic membrane dye PKH26 were exposed or not
to sAg (1 µg/ml SEE) , before incubation with Fluo-2
leakresloaded CD4
+T cells pre-labeled
with distinct lipophilic membrane dye (DiD); DAPI stained samples were exposed or not
to ionomycin and analyzed by flow cytometry (>10,000 events acquired per sample). (
B
)
Gating strategy and output metrics (tabulated). Pulse Width gated Fluo-2
leakresMean
Fluorescence Intensity signal (MFI; green bold line) was expressed as a percentage of
the signal within the same gate after adding ionomycin to the sample (green dotted line).
(
C
) Graphs showing cell conjugate formation over time and the intensity of calcium signals
within these conjugates, for T cells pre-coated with an anti-CD3 antibody (OKT3, 5 µg/ml;
Anti-CD3/Fc receptor panel), presented to SEE pre-pulsed MDMs (1 µg/ml; sAg panel)
or to untreated MDMs (black lines). Each graph represents the mean (± SD) from
experiments performed on cells from N=3 donors.
Figure 2
:
Imaging CD4
+T cell signaling in the context of MDM-CD4
+T cell
conjugates.
(
A
) A cartoon diagram of the live imaging strategy: (i) CFDA-SE labeled
MDMs seeded on glass coverslips were pulsed or not with sAg, (ii) before recording
calcium signals from Fura-2-AM loaded CD4
+T cells perfused over MDMs, with an
inverted fluorescence microscope. (
B
) Image of the final timeframe of acquisition (t=30
min) recording changes in intracellular calcium signals (340:380 ratio) from T cells added
to MDMs (white cells) treated or not with sAg (1 µg/ml SEE). Individual T cells were
tracked using MTrackJ and tracks were colored according to the maximum 340:380 ratio
experienced over the course of the assay (green ≤ 0.5, white, ≥ 0.5 and ≤1.0; red, ≥ 1.0).
Insets are zoomed views of yellow boxed-regions; scale bars = 50 µm. (
C
) Similar
experiments carried out using cells from three donors and MDMs pulsed with a mixture
of sAgs (SEA/SEB/SEE); for each donor, results are expressed for the maximum 340:380
ratio for every cell in field of views and data were compared using a Mann-Whitney U test
(beeswarm plots: red bar, median; dotted line, 340:380 threshold level) or by plotting the
frequency of events acquired, which fall above the 340:380 threshold level (bar graphs:
Figure 3
:
Single cell analysis of time-lapse images reveals that CD4
+T cells exhibit
distinct intracellular calcium signatures when interacting with sAgs-pulsed MDMs
.
(
A
and
B
) Intracellular calcium profiles of CD4
+T cells recorded with a 340:380 ratio
exceeding the threshold value (
³
1); plots show the intracellular calcium fluxes of CD4
+T
cells over time, when perfused over untreated (
A
) or sAgs-pulsed (
B
) MDMs; the MDM
(large white cell) interacting CD4
+T cell considered in each plot is visible in the adjacent
image frames, highlighted with a red track and labeled according to the 340:380
color-scale. (
C
) Calcium signature of CD4
+T cells on MDMs were grouped into four categories
according to their 340:380 ratio (
³
1) profiles, as illustrated with representative plots. (
D
)
Charts indicating the percentage of CD4
+T cell calcium signatures classified into each
group in the presence and absence of sAgs. Scale bars = 20 µm.
Figure 4: Analysis of the change in motility parameters either side of the maximum
calcium signal tracked. (A)
CD4
+T cells were perfused over sAgs-spiked or untreated
MDMs. Scatter plots show individual “objects” (T cells) identified in every image frame
from live imaging experiments with cells from one donor. The change in displacement
measures how far that object has moved since the previous time frame. Objects with
340:380 ratios greater than two standard deviations above the mean (i.e. ratios > 1.636)
of maximum calcium intensities are highlighted in red.
(B)
Diagram of the pre:post max
340:380 ratio analysis adopted to determine differences in motility before and after
calcium flux within a background of a flow rate that decreases over time and can differ
between regions imaged in different lateral positions.
(C)
Comparison of meandering
index (MI) ratio, Euclidean distance ratio, length ratio and speed ratio before and after the
max 340:380 signal. Each point represents an individual cell measured from donor (n=3)
samples treated with sAgs [Mean, x; Bars: median ± interquartile range. Statistical
analysis: Mann Whitney U test].
Figure 5: multivariate data analysis:
Observations (n = 1391) for 13 measures of T cell responses ± sAgs projected on to the
first two principal components (
A
and
B
) and linear discriminants (
C
). (
A
) PCA bi-plot
projecting observations from sAgs-treated (close symbols) and untreated (open symbols)
projecting the same observations according to the visual calcium classification. (
C
) LDA
assessing calcium signatures separation (
‘Flat’
blue,
‘transient’
red,
‘low’
green,
‘high’
purple): Bi-plot of the first two LD scores identifying the calcium profile groups with 95%
confidence ellipses for individual groups (top panel); density plots of the first linear
discriminate (middle panel) and class prediction plots (bottom panel) demonstrate the
reliability of classification to the ‘flat’ and ‘high’ categories of calcium signatures;
percentage of predictions that agree with visual classification is given.
Figure 6: Correlative imaging approach to assess CD4
+T cell calcium signatures
from immune synapses.
Following live recording of intracellular calcium, samples were
fixed, permeabilized and stained to identify synapses
by accumulation of CD3 at the
MDM-CD4
+T cell interface. A pre-defined point of reference on the glass-bottom dish
help to mark out the position of the original field of view to Z stack confocal images, and
allows correlation between intracellular calcium profile and CD3 capping on individual
CD4
+T cells. (
A
) Calcium profiles (classified into the indicated group) and their
corresponding orthogonal views of CD3 accumulation at the MDM-CD4
+T cell interface.
The leading edge of the interacting MDM is indicated by the red dotted line; scale bars =
5 µm. (
B
) Diagram of the method used to determine accumulation ratio of the CD3 marker
to the cell-cell interface. (
C
) Accumulation of CD3 occurs within each class of calcium
signatures, but the accumulation ratio significantly increases with the intensity of the
calcium signal. Experiments were performed on cells from N=4 donors; statistical
comparison was performed using ANOVA followed by a Tukey post-hoc test.
Figure 7
:
Adhesion proteins, the Golgi and surface chemokine receptors are
recruited to the MDM-CD4
+T cell
interface within synapses.
Immunolabeling of intact
MDM-CD4
+T cell conjugates formed ± sAgs. T cell surface distribution of CD3 with
ICAM-1 from MDMs (
A
), CXCR4 (
B
), or CCR5 (
C
); synapses are identifiable by capping
of T cell CD3 (black arrowheads in merge panels) at the interface with the interacting
MDM (M). Quantification of the accumulation of CD3 and CXCR4 (
D
) or CD3 and CCR5
(
D
) to the cell-cell interface compared to the rest of the T cell surface; a minimum of 21
conjugates from N=2 donors were recorded and a ± sAgs comparison was performed
Figure 8
:
Polarization of cell surface and internal CCR5 from CD4
+T cell towards
the MDM-CD4
+T cell
interface.
Confocal fluorescence images of MDM-CD4
+T cell
conjugates formed ± sAgs and immunolabeled after permeabilization; the edge of the
interacting MDM (M) is identified with a dotted line; scale bars = 10 µm. (
A
) Comparing
total CCR5, and CD3, distribution in the presence and absence of sAgs; representative
single sections of conjugates imaged from two to three donors. (
B
) Panels of maximum
intensity projections (I
max) for CCR5 and TGN or TfR co-staining. (
C
) Z-stack projection
of CD4
+T cells-MDM conjugates with sAgs, co-stained for CD3 and CCR5. (
D
) Confocal
fluorescence images show CD3 and T cell GM130 polarized towards the interface of cell
conjugates stained permeabilized. (
E
) Diagram of the method used to quantify the
polarization of total (surface and internal) staining from CD4
+T cells in conjugates. (
F
)
Plots showing the distribution of total CCR5 and CD3 quantified from at least 23
conjugates ± sAgs for N=2 donors. (
G
) Distribution of GM130 and total CD3 quantified
A.
B.
[image:30.540.50.486.62.780.2]0.5 1.0 2.0 + sAg 340:380 ratio - sAg
B.
C.
sAg noAg 0 5 10 15 20 25 !!! C el ls w it h m ax 3 40 :3 80 ³ 1 ( % )sAg no Ag 0 1 2 3 4 !!! m a x . 34 0: 38 0 ra ti o sAg noAg 0 5 10 15 20 25 !! sAg no Ag 0 1 2 3 4 ns sAg noAg 0 5 10 15 20 25 !!! sAg no Ag 0
1 2 3
4 !
Donor A Donor B Donor C
sAgs no sAgs
C
D
4
+ T
c e lls (d 1 0 ) MD Ms (d 8 )
+ Fura-2 AM + CFDA-SE
MDMs adhered to glass coverslip
Image interaction in perfusion chamber
± sAgs (2 h) Incubate 37 °C,
5% CO2, 48 h
Syringe pump controlled-rate addition of T cells (33 µL/s)
to waste
sAgs no sAgs sAgs no sAgs
A.
in
i.
ii.
[image:31.540.92.424.48.780.2]C.
D.
A.
0 400 800 1200
0.5 1.0 1.5 2.0
0 400 800 1200
0.5 1.0 1.5 2.0
0 400 800 1200
0.5 1.0 1.5 2.0
0 400 800 1200
0.5 1.0 1.5 2.0
0 400 800 1200
0.5 1.0 1.5 2.0
0 400 800 1200
0.5 1.0 1.5 2.0
0 400 800 1200
0.5 1.0 1.5 2.0
0 400 800 1200
0.5 1.0 1.5 2.0 flat classification transient low high 63% 19% 13% 5% + sAgs
n = 788
72% 23%
5%
- sAgs
n = 768
Track 18
0 400 800 1200
0.5 1.0 1.5 2.0
Track 22
0 400 800 1200
0.5 1.0 1.5 2.0
0 400 800 1200 0.5
1.0 1.5 2.0
0 400 800 1200 0.5
1.0 1.5 2.0
Track 53
0 400 800 1200
0.5 1.0 1.5 2.0 2.5 Track 33
0 400 800 1200
0.5 1.0 1.5 2.0
0 400 800 1200 0.5
1.0 1.5 2.0
0 400 800 1200 0.5
1.0 1.5 2.0
Time (s) 340:380 ratio: 0.5 1.0 2.0
3 4 0 :3 8 0 r a ti o - sAg + sAg 3 4 0 :3 8 0 r a ti o
B.
Time (s) 340:380 ratio: 0.5 1.0 2.0
200 s 400 s 600 s 800 s 1000 s 1200 s
200 s 400 s 600 s 800 s 1000 s 1200 s
Time (s) Time (s)
[image:32.540.42.488.51.780.2]0.01 0.1 1 10 100 1000 **
340:380 ≥ 1 340:380 ≤ 1
Meandering Index
(x = 58.26) (x = 10.63)
MI R a ti o Pr e :Po s t M a x C a lc iu m 0.01 0.1 1 10 100 1000 **
(x = 49.32)
Euclidian distance
340:380 ≥ 1 340:380 ≤ 1
(x = 14.05)
Eu c li d e a n D is ta n c e R a ti o Pr e :Po s t M a x C a lc iu m 0.01 0.1 1 10 100 ns Length
340:380 ≥ 1 340:380 ≤ 1
(x = 1.08) (x = 0.88)
L e n g th R a ti o Pr e :Po s t M a x C a lc iu m 0.01 0.1 1 10 100 ns
340:380 ≥ 1 340:380 ≤ 1
Speed
(x = 1.23) (x = 0.93)
Sp e e d R a ti o Pr e :Po s t M a x C a lc iu m
- sAgs
B
+ sAgs
Track 530 400 800 1200
0.5 1.0 1.5 2.0 2.5
T cells with calcium flux
Max. 340:380 ≥ 1
Identify
t
max 340:380t
max =x
(s)a
b
Compare with T cells without calcium flux
Max. 340:380 ≤ 1
In same field of view
x
(s)a
b
Determine ratio of motility measures1pre:postX
Pre (a) / Post (b)
1Motility measures: track
length, Euclidean distance, meandering index (MI), and
speed
A
[image:33.540.90.456.50.737.2]Figure 5
A
B
B.
A.
MergeC.
+ s A g s -s A g s CD3 CCR5 Merge + s A g s -s A g s CD3 CXCR4 Merge In te rf a c e / R e s t o f C e ll F lu o re s c e n c e 0 2 4 6 8 10 !!! 0 2 4 6 8 10 !!! CD3 CXCR4 In te rf a c e / R e s t o f C e ll F lu o re s c e n c e + sAgs+ sAgs - sAgs - sAgs
0 2 4 6 8 10 !!! 0 2 4 6 8 10 !! CD3 CCR5 + sAgs
[image:36.540.22.520.79.679.2]+ sAgs - sAgs - sAgs
Figure 7
M M M
M M M
M M M
M M M
D.
E.
+ s A g s -s A g s CD3 ICAM-1 MergeM M M