UNIVERSITI TEKNIKAL MALAYSIA MELAKA
FIBER OPTIC SENSOR DEVELOPMENT ON LIQUID
CETIRIZINE DETECTION FOR PHARMACEUTICAL
INDUSTRY
This report submitted in accordance with requirements of the University Technical Malaysia Melaka (UTeM) for the Bachelor’s Degree in Electronic Engineering
Technology (Telecommunication) (Hons.)
By
SANKIRAN DHARMA BIN DORAISINGAM B071410154
921107-61-5053
UNIVERSITI TEKNIKAL MALAYSIA MELAKA
BORANG PENGESAHAN STATUS LAPORAN PROJEK SARJANA MUDA
TAJUK: Fiber Optic Sensor Development on Liquid Cetirizine Detection for Pharmaceutical Industry
SESI PENGAJIAN: 2017/18 Semester 1
Saya SANKIRAN DHARMA BIN DORAISINGAM
mengaku membenarkan Laporan PSM ini disimpan di Perpustakaan Universiti Teknikal Malaysia Melaka (UTeM) dengan syarat-syarat kegunaan seperti berikut:
1. Laporan PSM adalah hak milik Universiti Teknikal Malaysia Melaka dan penulis. 2. Perpustakaan Universiti Teknikal Malaysia Melaka dibenarkan membuat salinan
untuk tujuan pengajian sahaja dengan izin penulis.
3. Perpustakaan dibenarkan membuat salinan laporan PSM ini sebagai bahan pertukaran antara institusi pengajian tinggi.
4. **Sila tandakan ( )
SULIT
TERHAD
TIDAK TERHAD
(Mengandungi maklumat yang berdarjah keselamatan atau kepentingan Malaysia sebagaimana yang termaktub dalam AKTA RAHSIA RASMI 1972)
(Mengandungi maklumat TERHAD yang telah ditentukan oleh organisasi/badan di mana penyelidikan dijalankan)
Alamat Tetap:
NO. 12, PRSN BUNTONG JAYA 27,
TMN BUNTONG JAYA
30100 IPOH, PERAK.
Tarikh: ________________________
Disahkan oleh:
Cop Rasmi:
Tarikh: _______________________
DECLARATION
I hereby, declared this report entitled “Fiber Optic Sensor Development on Liquid Cetirizine Detection for Pharmaceutical Industry” is the results of my own research
except as cited in references.
Signature : ………
Author’s Name : SANKIRAN DHARMA BIN DORAISINGAM
APPROVAL
This report is submitted to the Faculty of Engineering Technology of UTeM as a partial fulfillment of the requirements for the degree of Bachelor of Electronic Engineering Technology (Telecommunication) (Hons.). The member of the supervisory is as follow:
i
ABSTRACT
ii
ABSTRAK
Sensor fiber optik adalah teknologi yang menggunakan kabel gentian optik untuk mengesan cecair Cetirizine. Kajian ini dibuat untuk mencipta sebuah sensor yang dapat mengesan parameter dalam cecair. Sensor ini dikaji dalam 6 peratusan kepekatan yang berbeza iaitu 50%, 60%, 70%, 80%, 90% dan 100%, dan 4 wavelength yang berbeza iaitu 850nm, 1300nm, 1310nm dan 1550nm yang turut dikaji dalam setiap kepekatan. Sensor gentian optik direndam dalam cecair Cetirizine mengikut kepekatan dalam masa 1 jam dan data yang diperolehi akan dicatatkan setiap 5 minit. Langkah ini diulang dengan menukar nilai kepekatan Cetirizine dan sumber cahaya
wavelength yang lain. Akhirnya, kepekatan cecair Cetirizine akan memberi kesan
iii
DEDICATIONS
This report is dedicated to my beloved parents Mr. Doraisingam and Mrs. Sakti Rani, to my supervisor Madam Rahaini Binti Mohd Said, kind lecturers and to all
iv
ACKNOWLEDGMENTS
Throughout this project, I received a lot of helps and supports especially from my supervisor, lecturers, researchers, family members and friends. Without their helps I can’t afford to prepare and finish this report within the stipulated time. Furthermore, through their helps this project run smoothly from beginning till the end.
Firstly, I would like to give my upmost thanks to my supervisor, Madam Rahaini Binti Mohd Said who provide me an opportunity to do this project under her. She was my mentor for guiding and assisting me through the completion of this project. Without her guidance and persistent help, this project would not have been successful.
Secondly, I would like to express my deepest appreciation to my parents Mr. Doraisingam and Mrs. Sakti Rani in supporting me mentally and financially, for their encouragements and supports.
v
TABLE OF CONTENT
Abstract i
Abstrak ii
Dedication iii
Acknowledgement iv
Table of Content v
List of Tables viii
List of Figures x
List Abbreviations, Symbols and Nomenclatures xiii
CHAPTER 1: INTRODUCTION 1
1.0 Overview 1
1.1 Project Background 1
1.2 Objectives 2
1.3 Problem Statement 2
1.4 Project Scope 3
CHAPTER 2: LITERATURE REVIEW 4
2.0 Introduction 4
2.1 Fiber Optic 4
2.2 Fiber Optic Sensor 9
2.2.1 Advantages of Optical Fiber Sensor 9
2.2.2 Generic Optical Fiber Sensor 11
2.2.3 Classifications 12
2.2.4 Modulation Schemes 13
2.2.5 Fields of Applications 14
2.2.6 Issues 17
2.2.7 Fiber Selection for Sensors 19
2.3 Cetirizine Liquid 21
2.3.1 Refractive Index of Cetirizine Liquid 23
vi
2.4 Fiber Optic Sensors in Biomedical Engineering 25
2.4.1 Fiber-Optic Biomedical Sensors 26
2.4.2 Requirements and Applications 28
2.4.3 Latest Product Developments 29
2.4.4 Outlook 31
CHAPTER 3: METHODOLOGY 32
3.0 Introduction 32
3.1 Project Flow 32
3.1.1 Title Finding 33
3.1.2 Literature Review 33
3.1.3 Material Deciding 34
3.1.4 Sensor Development 34
3.1.5 Sensor Testing 34
3.1.6 Results Analysis 34
3.1.7 Formal Report Writing 35
3.2 Flow Chart of Project 35
3.3 Flow Chart of Fiber Optic Splicing Process 37
3.4 Process of Experiment 37
3.4.1 Work Area Preparation 37
3.4.2 Stripping 38
3.4.3 Cleaving 38
3.4.4 Cleaning 39
3.4.5 Splicing 39
3.4.6 Testing 40
3.4.7 Record Results and Analysis 40
CHAPTER 4: RESULTS 41
4.0 Introduction 41
4.1 Analysis of 50% Cetirizine Concentration using 4 Different L.S 42 4.2 Analysis of 60% Cetirizine Concentration using 4 Different L.S 48
vii
4.5 Analysis of 90% Cetirizine Concentration using 4 Different L.S 66 4.6 Analysis of 100% Cetirizine Concentration using 4 Different L.S 72 4.7 Summary for the best selected L.S in each Concentration of 78
Cetirizine Liquid based on Sensitivity
CHAPTER 5: CONCLUSION & FUTURE WORK 83
5.0 Introduction 83
5.1 Summary of Chapter 1 83
5.2 Summary of Chapter 2 83
5.3 Summary of Chapter 3 84
5.4 Summary of Chapter 4 84
5.5 Recommendations for Future Work 85
viii
LIST OF TABLES
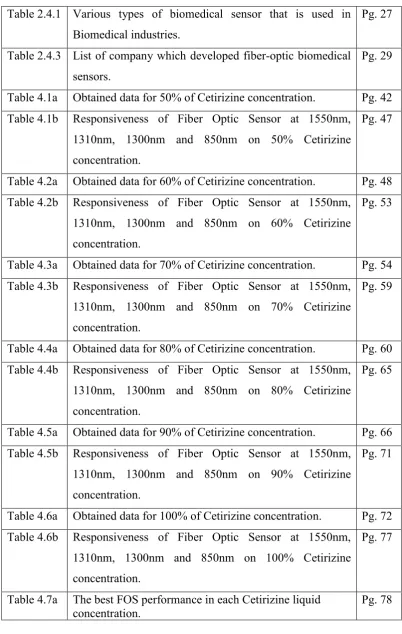
Table 2.4.1 Various types of biomedical sensor that is used in Biomedical industries.
Pg. 27
Table 2.4.3 List of company which developed fiber-optic biomedical sensors.
Pg. 29
Table 4.1a Obtained data for 50% of Cetirizine concentration. Pg. 42 Table 4.1b Responsiveness of Fiber Optic Sensor at 1550nm,
1310nm, 1300nm and 850nm on 50% Cetirizine concentration.
Pg. 47
Table 4.2a Obtained data for 60% of Cetirizine concentration. Pg. 48 Table 4.2b Responsiveness of Fiber Optic Sensor at 1550nm,
1310nm, 1300nm and 850nm on 60% Cetirizine concentration.
Pg. 53
Table 4.3a Obtained data for 70% of Cetirizine concentration. Pg. 54 Table 4.3b Responsiveness of Fiber Optic Sensor at 1550nm,
1310nm, 1300nm and 850nm on 70% Cetirizine concentration.
Pg. 59
Table 4.4a Obtained data for 80% of Cetirizine concentration. Pg. 60 Table 4.4b Responsiveness of Fiber Optic Sensor at 1550nm,
1310nm, 1300nm and 850nm on 80% Cetirizine concentration.
Pg. 65
Table 4.5a Obtained data for 90% of Cetirizine concentration. Pg. 66 Table 4.5b Responsiveness of Fiber Optic Sensor at 1550nm,
1310nm, 1300nm and 850nm on 90% Cetirizine concentration.
Pg. 71
Table 4.6a Obtained data for 100% of Cetirizine concentration. Pg. 72 Table 4.6b Responsiveness of Fiber Optic Sensor at 1550nm,
1310nm, 1300nm and 850nm on 100% Cetirizine concentration.
Pg. 77
Table 4.7a The best FOS performance in each Cetirizine liquid
ix
Table 4.7b Sensitivity reading of a light source in each
x
LIST OF FIGURES
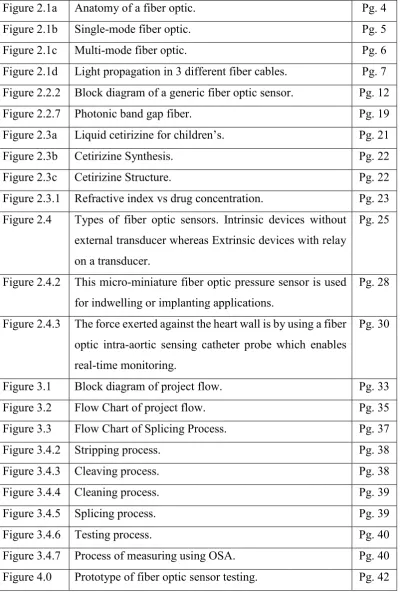
Figure 2.1a Anatomy of a fiber optic. Pg. 4
Figure 2.1b Single-mode fiber optic. Pg. 5
Figure 2.1c Multi-mode fiber optic. Pg. 6
Figure 2.1d Light propagation in 3 different fiber cables. Pg. 7 Figure 2.2.2 Block diagram of a generic fiber optic sensor. Pg. 12
Figure 2.2.7 Photonic band gap fiber. Pg. 19
Figure 2.3a Liquid cetirizine for children’s. Pg. 21
Figure 2.3b Cetirizine Synthesis. Pg. 22
Figure 2.3c Cetirizine Structure. Pg. 22
Figure 2.3.1 Refractive index vs drug concentration. Pg. 23 Figure 2.4 Types of fiber optic sensors. Intrinsic devices without
external transducer whereas Extrinsic devices with relay on a transducer.
Pg. 25
Figure 2.4.2 This micro-miniature fiber optic pressure sensor is used for indwelling or implanting applications.
Pg. 28
Figure 2.4.3 The force exerted against the heart wall is by using a fiber optic intra-aortic sensing catheter probe which enables real-time monitoring.
Pg. 30
Figure 3.1 Block diagram of project flow. Pg. 33
Figure 3.2 Flow Chart of project flow. Pg. 35
Figure 3.3 Flow Chart of Splicing Process. Pg. 37
Figure 3.4.2 Stripping process. Pg. 38
Figure 3.4.3 Cleaving process. Pg. 38
Figure 3.4.4 Cleaning process. Pg. 39
Figure 3.4.5 Splicing process. Pg. 39
Figure 3.4.6 Testing process. Pg. 40
[image:14.595.127.528.141.734.2]xi
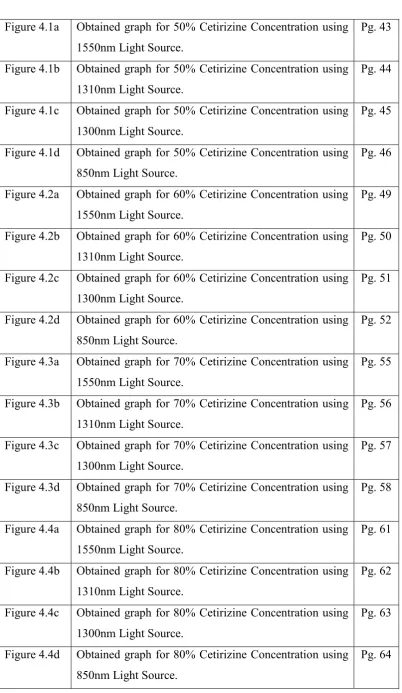
Figure 4.1a Obtained graph for 50% Cetirizine Concentration using 1550nm Light Source.
Pg. 43
Figure 4.1b Obtained graph for 50% Cetirizine Concentration using 1310nm Light Source.
Pg. 44
Figure 4.1c Obtained graph for 50% Cetirizine Concentration using 1300nm Light Source.
Pg. 45
Figure 4.1d Obtained graph for 50% Cetirizine Concentration using 850nm Light Source.
Pg. 46
Figure 4.2a Obtained graph for 60% Cetirizine Concentration using 1550nm Light Source.
Pg. 49
Figure 4.2b Obtained graph for 60% Cetirizine Concentration using 1310nm Light Source.
Pg. 50
Figure 4.2c Obtained graph for 60% Cetirizine Concentration using 1300nm Light Source.
Pg. 51
Figure 4.2d Obtained graph for 60% Cetirizine Concentration using 850nm Light Source.
Pg. 52
Figure 4.3a Obtained graph for 70% Cetirizine Concentration using 1550nm Light Source.
Pg. 55
Figure 4.3b Obtained graph for 70% Cetirizine Concentration using 1310nm Light Source.
Pg. 56
Figure 4.3c Obtained graph for 70% Cetirizine Concentration using 1300nm Light Source.
Pg. 57
Figure 4.3d Obtained graph for 70% Cetirizine Concentration using 850nm Light Source.
Pg. 58
Figure 4.4a Obtained graph for 80% Cetirizine Concentration using 1550nm Light Source.
Pg. 61
Figure 4.4b Obtained graph for 80% Cetirizine Concentration using 1310nm Light Source.
Pg. 62
Figure 4.4c Obtained graph for 80% Cetirizine Concentration using 1300nm Light Source.
Pg. 63
Figure 4.4d Obtained graph for 80% Cetirizine Concentration using 850nm Light Source.
[image:15.595.125.528.53.747.2]xii
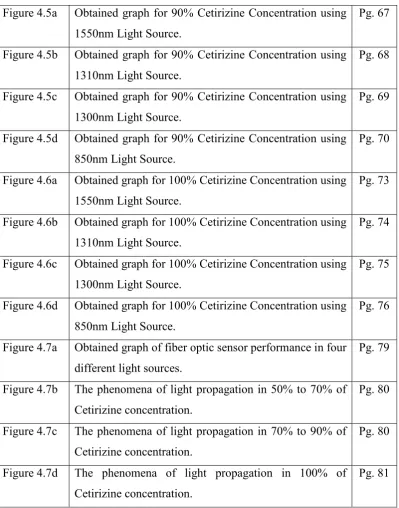
Figure 4.5a Obtained graph for 90% Cetirizine Concentration using 1550nm Light Source.
Pg. 67
Figure 4.5b Obtained graph for 90% Cetirizine Concentration using 1310nm Light Source.
Pg. 68
Figure 4.5c Obtained graph for 90% Cetirizine Concentration using 1300nm Light Source.
Pg. 69
Figure 4.5d Obtained graph for 90% Cetirizine Concentration using 850nm Light Source.
Pg. 70
Figure 4.6a Obtained graph for 100% Cetirizine Concentration using 1550nm Light Source.
Pg. 73
Figure 4.6b Obtained graph for 100% Cetirizine Concentration using 1310nm Light Source.
Pg. 74
Figure 4.6c Obtained graph for 100% Cetirizine Concentration using 1300nm Light Source.
Pg. 75
Figure 4.6d Obtained graph for 100% Cetirizine Concentration using 850nm Light Source.
Pg. 76
Figure 4.7a Obtained graph of fiber optic sensor performance in four different light sources.
Pg. 79
Figure 4.7b The phenomena of light propagation in 50% to 70% of Cetirizine concentration.
Pg. 80
Figure 4.7c The phenomena of light propagation in 70% to 90% of Cetirizine concentration.
Pg. 80
Figure 4.7d The phenomena of light propagation in 100% of Cetirizine concentration.
[image:16.595.127.527.67.576.2] [image:16.595.125.527.69.595.2]xiii
LIST OF ABBREVIATIONS, SYMBOLS AND
NOMENCLATURES
L.S - Light Source
dB - Decibels
ASE - Amplified Spontaneous Emission OSA - Optical Spectrum Analyzer FOS - Fiber Optic Sensor
pH - Power of Hydrogen
RF - Radio Frequency
EM - Electromagnetic
pO2 - Partial Pressure of Oxygen
pCO2 - Partial Pressure of Carbon Dioxide
O2 - Oxygen
Sn2 - Slush Nitrogen HCl - Hydrochloric Acid
CT - Computed Tomography
MRI - Magnetic Resonance Imaging
SPECT - Single-photon Emission Computed Tomography PET - Positron Emission Tomography
EFPI - Extrinsic Fabry-Perot Interferometers FBG - Fiber Bragg Gratings
MIS - Minimally Invasive Surgery IPA - Isopropyl Alcohol
1
CHAPTER 1
INTRODUCTION
1.0 Overview
In this part of chapter, project background will be discussed briefly to understand the concept of Fiber Optic sensor. This chapter also includes the explanations for problem statement, objectives and scope of this project.
1.1 Project Background
Fiber optic is a transparent flexible fiber made by silica glass or plastic that has slightly thicker diameter than a human hair. Fiber optics are widely used in telecommunication field due to its ability in sending information in high speed data rate. In general, fiber optic uses light source as a medium to transmit data from one end to another end. This is the main factor why telecommunication industries use fiber optics as a communication system. In addition, fiber optics are also immune to an electromagnetic interference that makes fiber optic better instead of using metal wires. Furthermore, fiber optics are guaranteed has small amounts of data losses that makes it more reliable and its preciseness is one of the reason fiber optics were used in sensor applications.
2
By using fiber optic as a sensor or in other words called as Fiber Optic Sensor, this project will focus on determining the effectiveness of fiber optic sensor towards the detection of concentration level in a cetirizine liquid. Due to its advantages such as accuracy, simplicity of design, low cost fabrication and flexible dynamic range makes Fiber Optic Sensor more unique and beneficial for real-field applications. Therefore, the purpose of this project is to analyse the sensitivity of Fiber Optic Sensor towards the concentration level of cetirizine liquid.
The implementation of fiber optics for detecting applications is one of the advance technology that worlds have today. Fiber Optic Sensors (FOS) are widely used in Civil Engineering, Chemical Engineering, and Aeronautics, but now thru the evolution, it is now expending to Biotechnology, Medicine and Pharmaceutical Industry.
1.2 Objectives
The objectives of this project are stated as below: 1) To study Fiber Optic Sensor operation.
2) To develop Fiber Optic Sensor on liquid cetirizine detection. 3) To analyse the performance of Fiber Optic Sensor.
1.3 Problem Statement
3
pharmaceutical industries to detect the most suitable dosage or concentration medicine level that a patient should take especially children age below 12 year’s old.
1.4 Project Scope
A coordinated scope of work need to be done in order to develop a fiber optic sensor. By determining the scope of this project, it is believe that the objectives can be achieve. Below are the scopes of work in this project:
a) Study the compatibility of fiber optic as a sensor on the concentration of cetirizine liquid.
b) Analyzing the effectiveness of fiber optic as sensor.
4
CHAPTER 2
LITERATURE REVIEW
2.0 Introduction
Literature review need to be done at the start before proceeding with the project. It is important so that the current knowledge on the project will be more extensive. In other words, it is actually the reading of the works of others before commencing on our own work. Broader knowledge will have better understanding if proper literature review are made about the project. Literature review can be found in primary sources, secondary sources and general sources. Example of sources are books, journals, newspaper and magazines. This chapter will study some projects that related to fiber optic sensor on liquid cetirizine concentration detections.
2.1 Fiber Optic
[image:21.595.123.533.597.712.2]Based on the understanding of a study, a fiber optic is a flexible, transparent fiber that made of glass or solid ultrapure plastic rode that will carry light along the core of fiber optic with the help of total internal reflections. An optical fiber consists of core, cladding, coating or buffer, strengthening fibers and cable jacket as shown in Figure 2.1a below.
5
The purpose of special coating which applied to the outside of cladding is to seal and preserve the strength of the fiber and also protect against moisture to reduce stress corrosion. The function of claddings is to reflect light back into the core. This situation will help reduce losses of transferred data. Besides that, the function of outer layer which is the cable jacket is to protect from moisture and also mechanical damage.
There are 3 types of fiber optic, which are the Plastic Core and Cladding, Glass Core and Plastic Cladding and Glass Core and Cladding. The advantage of using plastic fibers are more flexible but the problem is it produce higher attenuation than glass fibers. The best type of fiber optic to use is the Glass Core and Cladding where it offer better light propagation and easier termination. However, Glass Core and Plastic Cladding have less affected to external radiation.
There are two types of fiber optic cables, they are named as the multi-mode fiber optic cable and single-mode fiber optic cable. A single-mode fiber optic cable
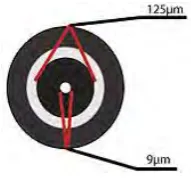
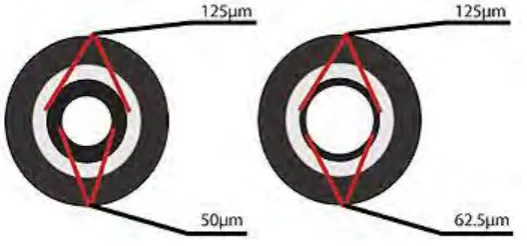
[image:22.595.270.366.654.743.2]is a single stand of a glass or plastic fiber where normally have a diameter of 8.3 to 10 microns that allows only one light to propagate. In other words, single-mode fiber optic relatively have narrow diameter area through which only single mode can propagate typically 1310 or 1550nm. Single-mode fiber carries greater bandwidth than multi-mode fiber, but it require a narrow spectral width of a light source. One of the main advantage of using single-mode fiber is the distance allowance where it allows 50 times longer distance with a higher transmission rate than multi-mode fiber optic. However, single-mode fiber will costs more due to only single light can propagate in a time. As shown in Figure 2.1b and Figure 2.1c, single-mode fiber optic has a smaller core diameter than multi-mode fiber optic. The small core diameter and single light wave will practically eliminate any distortion that might result from overlapping light pulses, hence will provide least signal attenuation and higher transmission speed.
6
Figure 2.1c: Multi-mode fiber optic.
Multi-mode fiber optic cable is made of glass material fibers, commonly with
diameter in the range of 50 to 100 microns. The most common size fiber optic diameter that is used today is 62.5 microns. Using a multi-mode fiber optic allows higher bandwidth at high speed over average distances. However, in long distance, multiple paths of lights will cause signal distortion at the receiving edge, which leads to an unclear and imperfect data transmission.
The main difference between single-mode and multi-mode fiber optic is that the multi-mode has larger core diameter typically between 50 to 100 micrometers. Due to its large core and also the probability of large numerical aperture, multi-mode fiber optic has a higher light-gathering size than a single-mode fiber optic cable. Practically, larger core size simplifies connection and allows to use lower cost electronics equipment such as light-emitting diodes (LED’s). Nevertheless, compared to a single-mode fiber optic, the multi-mode fiber optic bandwidth distance is limited.
7
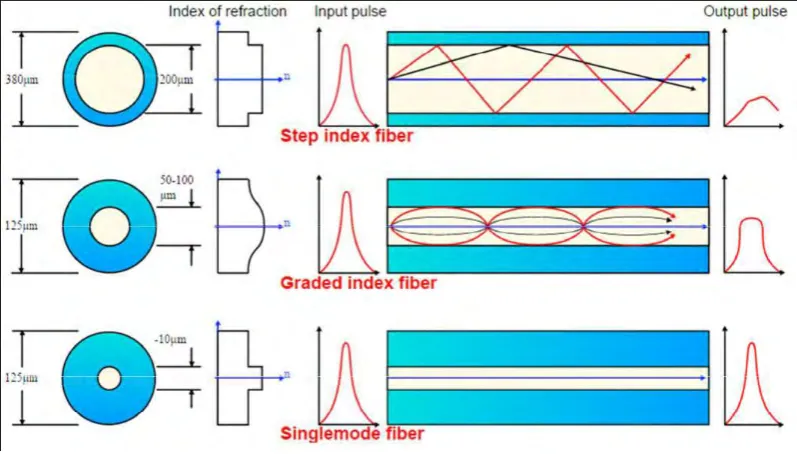
Figure 2.1d: Light propagation in 3 different fiber cables.
Figure 2.1d shows light propagation in 3 different fiber cables. Two of it is a type in a multi-mode fiber optic cable, which is the step-index fiber and graded-index fiber. A step-index fiber has a large core, therefore some light rays may travel in a
direct route, while others in the shape of zigzag as they reflect off the cladding. This every other paths will lead to different groups of light rays to arrive separately at the receiving point. This behavior will cause the pulse begins to scatter and losing its shape. The necessity of leaving a space between pulses is to avoid overlapping limits of information that can be sent. This type of fiber optic is suitable for short distance transmission.
Graded-index fiber consists a core where the refractive index decreases